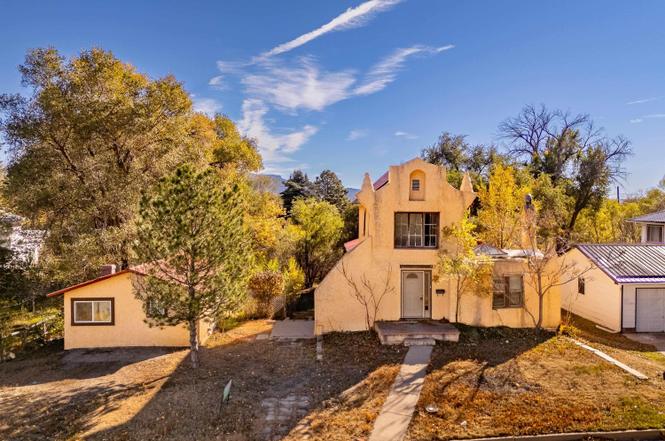
625 S 5th St · Raton, NM
Flood risk No data
- FEMA flood zone
- —
- Chance of flooding over 30 yrs
- %
- Est. flood insurance / yr
- —
Fire risk No data
- Est. fire insurance / yr
- —
Heat risk No data
- Hot days now (above °F)
- days/yr
- Hot days in 30 yrs
- days/yr
Wind risk No data
- Chance of severe wind over 30 yrs
- %
Air-quality risk No data
- Unhealthy air days now
- days/yr
- Unhealthy air days in 30 yrs
- days/yr
Risk factors via First Street. Map © Google.
Why this score? — see what drove the D grade
The composite is a weighted blend of 9 inputs, each scored 0–100. Each bar is that input's sub-score; the figure is the points it added to the 100-point composite (weight × sub-score).
- Cash flow +15.5/30.0
- ARV discount +7.5/15.0
- DSCR +4.8/10.0
- 1% rule +4.3/10.0
- Livability +3.5/5.0
- Rent growth +2.5/5.0
- Condition / age +2.5/5.0
- Schools +1.9/10.0
- Appreciation +0.0/10.0
$125,000
🖨 Deal sheet 📄 Offer letter ✓ Due diligence
Listing remarks
Investor Alert! This 3-bedroom, 1.5-bath home is the perfect live-in project with income-producing potential! Bursting with character and unique features throughout, this property is ready for a fresh start and creative vision. Live comfortably in the updated, quaint studio while you bring the main home back to life — an ideal setup for contractors, handymen, or savvy investors seeking sweat equity. Located in a prime area close to downtown, you’ll enjoy walking distance to schools, the library, local coffee shops, and more. With great bones, tons of potential, and a location that can’t be beat, this fixer-upper is ready for its next chapter — and its next opportunit
Key facts
- Updated studio
- 0.24 acre lot
- Built 1940
Tags
Neighborhood map
What this means for you Summary
Snapshot
- This is a 3-bed/2.5-bath single-family listed at $125k.
Deal economics
- At list price, monthly cash flow is $50 ($596/yr) — positive.
- The deal already cash-flows at list — no discount required.
- To meet the 1% rule (rent ≥ 1% of price), the offer needs to be $116k (7.5% below list).
- Recommended offer: $110k (12.0% below list) — sets the bar for market timing.
Location & tenants
- Location reads 69/100 on livability (#23 in NM) — a middle-class / working-renter tenant base. Strengths: cost of living A+, housing A+, health & safety A+; Watch: crime C-, schools F, amenities F.
- Raton Public Schools (town): math 14% / reading 24% proficiency, ranked #71 of 95 in NM (top 75%) — low school quality limits family demand, transient renter base, plan for 1-2y turnover.
- Market conditions: 65 active listings in the ZIP.
Forward outlook
- Local home prices are declining (-3.0%/yr); year-one equity from $864 of loan paydown is wiped out by about $4k of value loss. Plan a longer hold.
- Colfax County population projected at -39% by 2050 — secular population decline; favor cash flow + early exit over multi-decade hold.
Negotiation context
- It's been on market 172 days — a 12% lower offer ($110k) is reasonable based on typical stale-listing flexibility.
Risks & watch-outs
- Watch-outs: built in 1940 — expect roof / HVAC / electrical / plumbing capex.
Questions for the listing agent
- It's been on market 172 days. Have you received any prior offers? Is the seller open to a 12% concession, seller financing, or rate buy-down credit?
- Built in 1940 — when were the roof, HVAC, electrical panel, plumbing, and water heater last replaced?
- Why hasn't it sold? Are there any deal-killer items the seller is aware of (foundation, flood, title, zoning, code violations)?
- Is there a deadline driving the sale (1031 exchange, divorce, estate, relocation)? That informs how much negotiation room exists.
- Schools are F-rated, which usually means shorter tenancies and higher turnover. Who's the typical renter profile here, and what's been the actual vacancy rate?
- The area grade is low — what's the realistic commute time and amenity access for the typical tenant pool here? Any planned neighborhood developments (good or bad) we should know about?
- What's the average days-on-market for RENTAL listings here right now (not sales)? A rising rental-DOM trend means longer vacancies and softer asking-rent achievability than the comps imply.
- What's the recent tenant-quality profile in this submarket — average credit score on applications, eviction rate, late-payment / NSF rate, and stable-employment percentage? A property-management company in the area should have these aggregated.
- How much new for-sale + rental construction is in the pipeline within 1–3 miles? Heavy new supply typically softens prices + rents 12–24 months out; constrained supply supports both.
Investment metrics
- 1% rule
- 0.93% ✗
- Cap rate
- 6.77%
- Cash-on-cash
- 1.70%
- DSCR
- 1.08
- GRM
- 9.0
CMA / ARV
No comps found within radius.
Projected returns pro-forma
-3.0% appreciation · 3.0% rent growth · sell at horizon
- IRR
- -13.6%
- Equity multiple
- 0.51×
- Total profit
- $-17,077
- Equity at exit
- $18,638
- IRR
- -4.7%
- Equity multiple
- 0.69×
- Total profit
- $-10,729
- Equity at exit
- $10,808
Cash invested: $35,000 (down + closing). Projections, not guarantees.
Landlord ↔ Tenant lean methodology
- Overall (STATE)
- 55 Moderately Landlord-Leaning
- State New Mexico
- 55 Moderately Landlord-Leaning · D+3
- County
- — inherits STATE
- City
- — inherits STATE
ZIP-level market 87740
- Active inventory
- 65
- Price-to-rent
- 9.0×
Monthly cashflow live
- Estimated rent
- $1,156 medium interval (Pro) →
- Mortgage (P&I)
- −$656
- Tax est. 1.5%
- −$156 /mo · $1,875/yr
- Insurance
- −$52
- HOA
- −$0
- Vacancy / Maint / Mgmt
- −$243
- Net cashflow
- $50
Break-even live
UW: 25.0% down · 7.5% · 30yr · 1.5% tax · 5.0% vac · 8.0% maint · 8.0% mgmt
Financing live
Cash to close
- Down payment
- $31,250
- Closing costs
- $3,750
- Reserves months
- —
- Total cash needed
- —
Loan-product check · same deal, 3 products live
Conventional
25% down · 7.5% · 30yr
- Down + closing
- —
- Monthly P&I
- —
- Monthly cashflow
- —
- DSCR
- —
- Eligible?
- —
Personal DTI + credit; lowest rate.
DSCR
20% down · 8.5% · 30yr
- Down + closing
- —
- Monthly P&I
- —
- Monthly cashflow
- —
- DSCR
- —
- Eligible?
- —
No personal income docs; deal must DSCR.
Hard money
10% down · 12.0% · 12mo
- Down + closing
- —
- Monthly P&I
- —
- Monthly cashflow
- —
- DSCR
- —
- Eligible?
- —
Short-term bridge; refi at stabilization.
Listing history 2 events
-
2026-06-18remarks 675-char remark
-
2026-06-18$125,000 Active 172 DOM
ⓘ Source: listings_history table (triggers on properties + properties_extension) + one-shot
backfill from property_details.listing_events for pre-trigger history.
Nearby sold comps map
Loading sold comps map…
Walkable amenities ~0.75 mi
Loading nearby amenities…
Taxation est. · year 1
- Rental income
- $13,876
- − Mortgage interest
- −$7,002
- − Property taxes
- −$1,875
- − Insurance
- −$625
- − Repairs & maintenance
- −$1,110
- − Management
- −$1,110
- − Depreciation
- −$3,636
- Taxable loss
- −$1,483
- Est. tax savings @ 24.0%
- +$356
- After-tax cash flow
- $951/yr
For passive investors: Depreciation is non-cash, so a rental often shows a tax loss while cash-flowing — sheltering income. Rental losses are passive: they offset passive income freely, and up to $25,000/yr can offset ordinary (W-2) income if you actively participate and your MAGI is under $100k (phasing out to $0 by $150k); unused losses carry forward. On sale, claimed depreciation is recaptured at up to 25%, and gains may owe capital-gains tax (a 1031 exchange can defer both). Figures are a year-1 estimate at your 24.0% rate — not tax advice; consult a CPA.
Schools (NCES district)
- District
- Raton Public Schools
- NCES district ID
- 3502190
- Math proficiency
- 14% —
- Reading proficiency
- 24% —
- Median HH income
- $33,774
- Composite
- 18.8/100
- National rank
- #13993
- State rank
- #71 of 95 in NM
Livability — Raton
- Score
- 69/100
- State rank
- #23
- US rank
- #8557
Category grades
Schools grade is shown separately in the Schools card above.
Census & demographics
- Census place
- Raton, NM
- Population (ZIP)
- 7,055
Population outlook (Colfax County) Hauer SSP2
- Today (2025)
- 10,260 people
- By 2030
- 9,240 · -9.9%
- By 2040
- 7,474 · -27.2%
- By 2050
- 6,285 · -38.7%
- By 2075
- 5,109 · -50.2%
- By 2100
- 4,684 · -54.3%
Race, ethnicity, and origin ACS 2023
- Neighborhood character
- Majority Hispanic (52%)
- Race & ethnicity
- Hispanic / Latino 52% White 44% Two or more races 21% Native American 1%
- Hispanic origin (detail)
- Mexican 24%
- Common ancestry
- Italian 2% Lithuanian 1% Iranian 1%
- Foreign-born
- 2% · Canada
- Languages at home
- 83% English-only · Spanish 14%
Political lean MEDSL · Colfax
- 2024 margin
- R (+14.0) · D 41.9% · R 55.9% · Other 2.1%
- 2008→2024 swing
- -24.8pp toward R · 2008: 10.7pp · 2024: -14.0pp
- All cycles
- 2024: R+14.0 2020: R+11.0 2016: R+8.6 2012: D+2.0 2008: D+10.7
Not yet ingested
- Civics
- —
Market trends
- HPI YoY
- ▼ -80.47%
- Current HPI
- 133.0875
- Rent YoY
- —
- Metro
- —
- State GDP YoY
- —
- F500 in state
- 0
Cash-flow waterfall
monthlySold comps — $/sqft
last 12 mo · ≤1 miLoading sold comps…