 Duplex
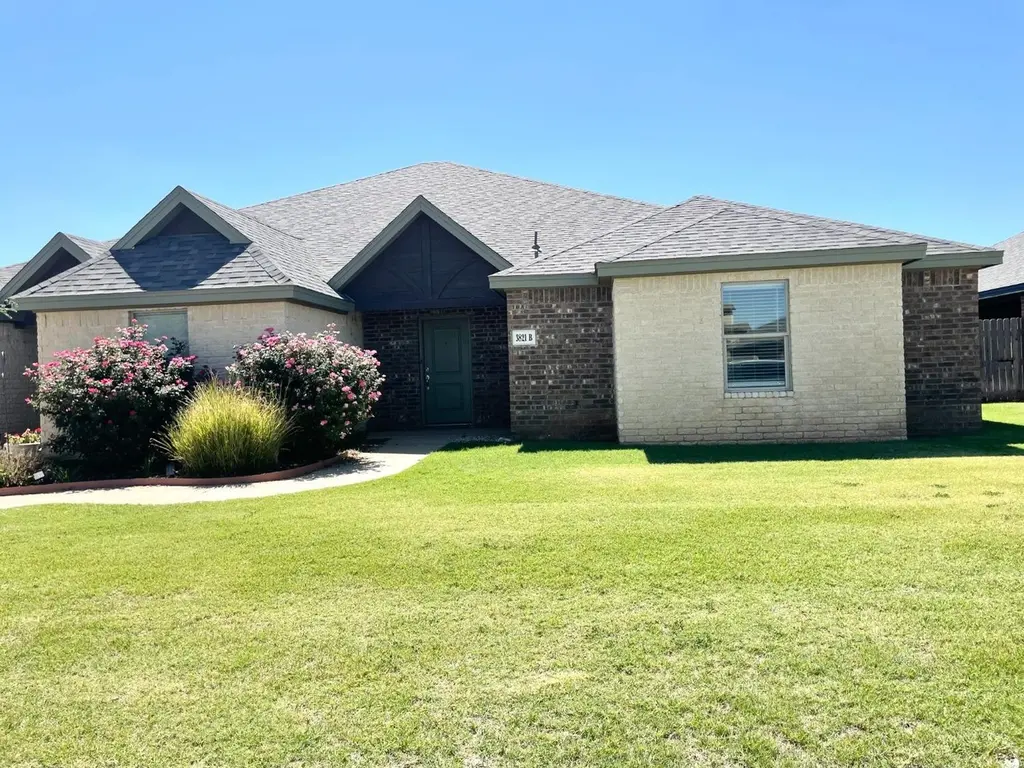
3821 133rd St · Lubbock, TX
Flood risk 1/10 · Minimal
- FEMA flood zone
- X (unshaded)
- Chance of flooding over 30 yrs
- 0.0%
- Est. flood insurance / yr
- $507 – $1,088
Fire risk 1/10 · Minimal
- Est. fire insurance / yr
- $1,222 – $2,270
Heat risk 5/10 · Moderate
- Hot days now (above 99°F)
- 6 days/yr
- Hot days in 30 yrs
- 17 days/yr
Wind risk 2/10 · Minimal
- Chance of severe wind over 30 yrs
- —
Air-quality risk 2/10 · Minimal
- Unhealthy air days now
- 1 days/yr
- Unhealthy air days in 30 yrs
- 1 days/yr
Risk factors via First Street. Map © Google.
Why this score? — see what drove the C- grade
The composite is a weighted blend of 9 inputs, each scored 0–100. Each bar is that input's sub-score; the figure is the points it added to the 100-point composite (weight × sub-score).
- Cash flow +19.4/30.0
- ARV discount +7.5/15.0
- DSCR +6.1/10.0
- 1% rule +5.4/10.0
- Schools +4.8/10.0
- Livability +4.0/5.0
- Rent growth +3.0/5.0
- Condition / age +2.5/5.0
- Appreciation +0.0/10.0
$420,000
🖨 Deal sheet (PDF) 📄 Offer letter ✓ Due diligence
Multi-family units
County records classify this as Multi-Family (2-4 Unit). Listing-text estimate: 2 units. confirmed
Listing remarks MLS
South Lubbock living, close to schools, shopping, restaurants and parks. This property is part of a package or sell by itself. Properties inc. ; 2123 143rd, 319 79th, 3817 133rd, 3819 133rd, 5504 110th, 5724 96th and 7513 103rd.
Key facts
- Close to parks
- Close to schools
- Close to restaurants
Tags
Neighborhood map
What this means for you Summary
Snapshot
- This is a 2 × 3-bed/?-bath units multifamily listed at $420k.
Deal economics
- At list price, monthly cash flow is $466 ($6k/yr) — positive. Per door: $233/mo.
- The deal already cash-flows at list — no discount required.
- Meets the 1% rule at list price ($4k rent vs $420k).
- Recommended offer: $370k (12.0% below list) — sets the bar for market timing.
Location & tenants
- Location reads 80/100 on livability (#37 in TX, #1,749 nationally) — a professional / high-income tenant draw. Strengths: commute A+, cost of living A+, housing A+; Watch: employment C-, crime F.
- Lubbock-Cooper ISD (rural): math 54% / reading 52% proficiency, ranked #98 of 826 in TX (top 12%) — acceptable for families but not a draw, mixed tenant base, ~2y average lease.
- Zoned schools: Lubbock-Cooper Central El (math 57% / reading 59%, grade C+, #480 of 4,322 statewide, top 11%, 849 students, 23% FRL); Lubbock-Cooper Laura Bush Middle (math 53% / reading 50%, grade C, #318 of 1,662 statewide, top 20%, 971 students, 34% FRL); Lubbock-Cooper H S (math 67% / reading 65%, grade B, #189 of 1,632 statewide, top 12%, 2,117 students, 31% FRL) — zoned schools at 30% FRL track the district average.
- Market conditions: Rents rising (+2.1%/yr); 673 active listings in the ZIP; 1 comparable units currently listed for rent nearby; solid renter incomes; 2,219 units permitted in Lubbock County in 2024 (252 in 5+ unit buildings).
- At $4,377/mo this rent would consume 62% of the median local household income ($85k/yr) (locally 1385% of renters already pay >50% of income on rent) — very limited rent-growth headroom before tenants either downsize or default.
Forward outlook
- Local home prices are declining (-3.0%/yr); year-one equity from $3k of loan paydown is wiped out by about $13k of value loss. Plan a longer hold.
- Lubbock County population projected at +39% by 2050 — long-run rental-demand tailwind backs the buy-and-hold thesis.
Negotiation context
- It's been on market 146 days — a 12% lower offer ($370k) is reasonable based on typical stale-listing flexibility.
- 2 sale attempts since 4y ago with the ask held roughly flat each time — persistent listings suggest the price (not the market) is what's stuck; bring a comps-based counter.
Risks & watch-outs
- Climate carrying-cost: extreme-heat days projected 6→17/yr by 2055 (HVAC capex compounding) — expect insurance premiums to compound above CPI over the hold.
Questions for the listing agent
- It's been on market 146 days. Have you received any prior offers? Is the seller open to a 12% concession, seller financing, or rate buy-down credit?
- Can we see the unit-by-unit rent roll, current vacancy, and any below-market leases? What's the average tenancy length?
- What capital expenditures (roof, boiler, parking lot, exteriors) have been made in the last 5 years, and what's planned in the next 2?
- Why hasn't it sold? Are there any deal-killer items the seller is aware of (foundation, flood, title, zoning, code violations)?
- Is there a deadline driving the sale (1031 exchange, divorce, estate, relocation)? That informs how much negotiation room exists.
- Schools are D-rated, which usually means shorter tenancies and higher turnover. Who's the typical renter profile here, and what's been the actual vacancy rate?
- Crime grade is F in this area — have there been break-ins, vandalism, or insurance claims at this property in the last 3 years? What carrier currently insures it and at what premium?
- What's the average days-on-market for RENTAL listings here right now (not sales)? A rising rental-DOM trend means longer vacancies and softer asking-rent achievability than the comps imply.
- What's the recent tenant-quality profile in this submarket — average credit score on applications, eviction rate, late-payment / NSF rate, and stable-employment percentage? A property-management company in the area should have these aggregated.
- How much new apartment / multifamily construction is in the pipeline within 1–3 miles? Heavy new supply (>2% of stock underway) typically softens rents 12–24 months out; light construction supports rent growth.
Investment metrics
- 1% rule
- 1.04% ✓
- Cap rate
- 7.62%
- Cash-on-cash
- 4.76%
- DSCR
- 1.21
- GRM
- 8.0
CMA / ARV
No comps found within radius.
Projected returns pro-forma
-3.0% appreciation · 2.13% rent growth · sell at horizon
- IRR
- -9.9%
- Equity multiple
- 0.64×
- Total profit
- $-42,050
- Equity at exit
- $62,623
- IRR
- -1.7%
- Equity multiple
- 0.89×
- Total profit
- $-13,216
- Equity at exit
- $36,314
Cash invested: $117,600 (down + closing). Projections, not guarantees.
Landlord ↔ Tenant lean methodology
- Overall (STATE)
- 87 Strongly Landlord-Friendly
- State Texas
- 87 Strongly Landlord-Friendly · R+5
- County
- — inherits STATE
- City
- — inherits STATE
ZIP-level market 79423
- Rents YoY
- 2.1%
- Active inventory
- 673
- Price-to-rent
- 16.0×
Monthly cashflow live
- Estimated rent
- $4,377 high interval (Pro) →
- Mortgage (P&I)
- −$2,203
- Tax from tax record
- −$614 /mo · $7,370/yr
- Insurance
- −$175
- HOA
- −$0
- Vacancy / Maint / Mgmt
- −$919
- Net cashflow
- $466
Break-even live
Sensitivity live
| Price | -10% $704 | -5% $585 | +0% $466 | +5% $347 | +10% $228 |
|---|---|---|---|---|---|
| Rent | -10% $120 | -5% $293 | +0% $466 | +5% $639 | +10% $812 |
| Rate | -1.0pp $678 | -0.5pp $573 | base $466 | +0.5pp $357 | +1.0pp $247 |
2-unit breakdown (identical units grouped — click to expand)
| Units | Beds | Baths | Est. rent |
|---|---|---|---|
| 2× units | 3 | — | $4,378 |
| #1 | 3 | — | $2,189 |
| #2 | 3 | — | $2,189 |
| Total (2 units) | $4,377 | ||
UW: 25.0% down · 7.5% · 30yr · 1.5% tax · 5.0% vac · 8.0% maint · 8.0% mgmt
Financing live
Cash to close
- Down payment
- $105,000
- Closing costs
- $12,600
- Reserves months
- —
- Total cash needed
- —
Loan-product check · same deal, 3 products live
Conventional
25% down · 7.5% · 30yr
- Down + closing
- —
- Monthly P&I
- —
- Monthly cashflow
- —
- DSCR
- —
- Eligible?
- —
Personal DTI + credit; lowest rate.
DSCR
20% down · 8.5% · 30yr
- Down + closing
- —
- Monthly P&I
- —
- Monthly cashflow
- —
- DSCR
- —
- Eligible?
- —
No personal income docs; deal must DSCR.
Hard money
10% down · 12.0% · 12mo
- Down + closing
- —
- Monthly P&I
- —
- Monthly cashflow
- —
- DSCR
- —
- Eligible?
- —
Short-term bridge; refi at stabilization.
Rent comps 1 comps
| Address | Beds | Baths | Sqft | Rent | $/sqft | DOM | Units | Dist |
|---|---|---|---|---|---|---|---|---|
| 2925 138th Pl Lubbock, TX | 5.0 | 2.5 | 2135 | $2,495 | $1.17 | 15d | 1 | 1.25mi |
Listing history 28 events
-
2026-06-21days on market $420,000 Active 146 DOM
-
2026-06-18days on market $420,000 Active 143 DOM
-
2026-06-17days on market $420,000 Active 142 DOM
-
2026-06-16days on market $420,000 Active 141 DOM
-
2026-06-15days on market $420,000 Active 140 DOM
-
2026-06-14days on market $420,000 Active 138 DOM
-
2026-06-13days on market $420,000 Active 137 DOM
-
2026-06-10days on market $420,000 Active 135 DOM
-
2026-06-09days on market $420,000 Active 134 DOM
-
2026-06-08days on market $420,000 Active 133 DOM
-
2026-06-07days on market $420,000 Active 132 DOM
-
2026-06-05days on market $420,000 Active 129 DOM
-
2026-06-03days on market $420,000 Active 128 DOM
-
2026-06-02days on market $420,000 Active 127 DOM
-
2026-06-01days on market $420,000 Active 126 DOM
-
2026-05-31days on market $420,000 Active 125 DOM
-
2026-05-30days on market $420,000 Active 124 DOM
-
2026-01-26$420,000 Active 228-char remark
Show marketing remark (228 chars)
South Lubbock living, close to schools, shopping, restaurants and parks. This property is part of a package or sell by itself. Properties inc. ; 2123 143rd, 319 79th, 3817 133rd, 3819 133rd, 5504 110th, 5724 96th and 7513 103rd.
-
2024-12-13price $412,000
-
2024-11-16price $417,000
-
2024-09-13price $420,000
-
2022-08-25soldstatus
-
2022-08-24soldstatus Closed
-
2022-08-12status Pending
-
2022-08-11price $1,600
-
2022-07-28$420,000 Active
-
2020-02-06soldstatus
-
2020-02-06soldstatus
ⓘ Source: listings_history table (triggers on properties + properties_extension) + one-shot
backfill from property_details.listing_events for pre-trigger history.
Tax reassessment forecast TX · Resets to sale price
- Current annual tax
- $7,370 · $614/mo
- Projected year-2 tax
- $7,686 · $640/mo
- Expected delta
- +$316/yr (+$26/mo · 4.3%)
ⓘ Screening estimate from a state-policy table — verify with the county assessor before closing.
Climate risk First Street
- Flood 1/10 Low FEMA zone X (unshaded) · 0% chance over 30 yrs
- Wildfire 1/10 Low
- Heat 5/10 Major 6 d/yr ≥99°F today · 17 d/yr by 30 yrs out
- Wind 2/10 Low
- Air quality 2/10 Low 1 unhealthy d/yr today · 1 by 30 yrs out
Nearby sold comps map
Loading sold comps map…
Walkable amenities ~0.75 mi
Loading nearby amenities…
Taxation est. · year 1
- Rental income
- $52,524
- − Mortgage interest
- −$23,527
- − Property taxes
- −$7,370
- − Insurance
- −$2,100
- − Repairs & maintenance
- −$4,202
- − Management
- −$4,202
- − Depreciation
- −$12,218
- Taxable loss
- −$1,095
- Est. tax savings @ 24.0%
- +$263
- After-tax cash flow
- $5,856/yr
For passive investors: Depreciation is non-cash, so a rental often shows a tax loss while cash-flowing — sheltering income. Rental losses are passive: they offset passive income freely, and up to $25,000/yr can offset ordinary (W-2) income if you actively participate and your MAGI is under $100k (phasing out to $0 by $150k); unused losses carry forward. On sale, claimed depreciation is recaptured at up to 25%, and gains may owe capital-gains tax (a 1031 exchange can defer both). Figures are a year-1 estimate at your 24.0% rate — not tax advice; consult a CPA.
Schools (NCES district)
- District
- Lubbock-Cooper ISD
- NCES district ID
- 4815180
- Math proficiency
- 54% ▼ -7.00%
- Reading proficiency
- 52% ▼ -3.00%
- Median HH income
- $77,347
- Composite
- 47.9/100
- National rank
- #2214
- State rank
- #98 of 826 in TX
Livability — Lubbock
- Score
- 80/100
- State rank
- #37
- US rank
- #1749
Category grades
Schools grade is shown separately in the Schools card above.
Census & demographics
- Census place
- Lubbock, TX
- County
- Lubbock County · 293,542 people
- City population
- 283,030
- Metro
- Lubbock, TX
- Population (ZIP)
- 46,998
- Household income
- $84,933
- Rent vs Own
- Severe rent burden
- 1385.0
Population outlook (Lubbock County) Hauer SSP2
- Today (2025)
- 345,960 people
- By 2030
- 371,449 · +7.4%
- By 2040
- 424,539 · +22.7%
- By 2050
- 481,150 · +39.1%
- By 2075
- 633,467 · +83.1%
- By 2100
- 746,853 · +115.9%
Race, ethnicity, and origin ACS 2023
- Neighborhood character
- Majority White (61%)
- Race & ethnicity
- White 61% Hispanic / Latino 31% Two or more races 15% Black 4% Asian 2%
- Hispanic origin (detail)
- Mexican 26%
- Common ancestry
- Slovak 1% Italian 1% Serbian 1%
- Foreign-born
- 5% · Canada
- Languages at home
- 84% English-only · Spanish 13% Tagalog/Filipino 1% Other Asian/Pacific 1%
Political lean MEDSL · Lubbock
- 2024 margin
- Solid R (+39.5) · D 29.7% · R 69.2% · Other 1.0%
- 2008→2024 swing
- -2.8pp toward R · 2008: -36.7pp · 2024: -39.5pp
- All cycles
- 2024: R+39.5 2020: R+32.2 2016: R+38.4 2012: R+40.9 2008: R+36.7
Not yet ingested
- Civics
- —
Market trends
- HPI YoY
- ▼ -155.00%
- Current HPI
- 213.6491
- Rent YoY
- ▲ 2.13%
- Metro
- Lubbock, TX
- State GDP YoY
- ▲ 3.95%
- F500 in state
- 110
Industry mix (Fortune 500 HQ in TX)
| Industry | F500 HQs | Revenue |
|---|---|---|
| Energy | 16 | $1,198B |
|
||
| Technology | 5 | $198B |
|
||
| Engineering / Construction | 4 | $72B |
|
||
| Energy Services | 3 | $60B |
|
||
| Utilities | 3 | $41B |
|
||
| Healthcare | 2 | $330B |
|
||
Price history
+0.0% since first listed11 events — show timeline
- 2026-01-26 Listed $420,000 LARMLS
- 2024-12-13 Price Changed $412,000 LARMLS
- 2024-11-16 Price Changed $417,000 LARMLS
- 2024-09-13 Price Changed $420,000 LARMLS
- 2022-08-25 Sold (Public Records) — Public Records
- 2022-08-24 Sold (MLS) — LARMLS
- 2022-08-12 Pending — LARMLS
- 2022-08-11 Price Changed $1,600 RENT.
- 2022-07-28 Listed $420,000 LARMLS
- 2020-02-06 Sold (Public Records) — Public Records
- 2020-02-06 Sold (Public Records) — Public Records
Property tax history
-0.1%/yrLatest (2025): $7,370 · -2.2% YoY. Source: county tax records.
Cash-flow waterfall
monthlySold comps — $/sqft
last 12 mo · ≤1 miLoading sold comps…