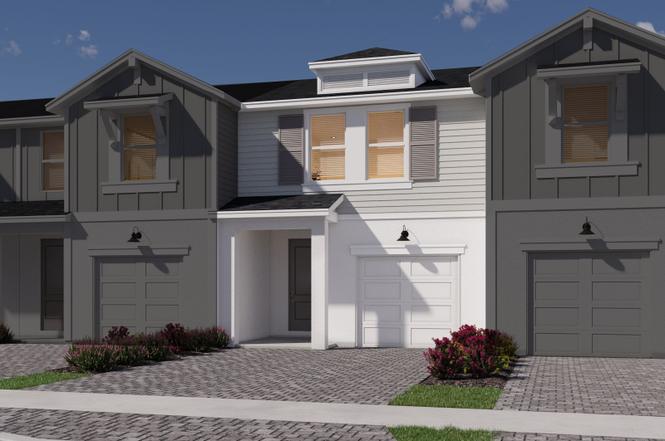
12977 SW Forli Way · Port St. Lucie, FL
Flood risk 6/10 · Moderate
- FEMA flood zone
- X (unshaded)
- Chance of flooding over 30 yrs
- 0.97%
- Est. flood insurance / yr
- $507 – $1,088
Fire risk 5/10 · Moderate
- Est. fire insurance / yr
- $947 – $1,759
Heat risk 9/10 · Severe
- Hot days now (above 107°F)
- 6 days/yr
- Hot days in 30 yrs
- 20 days/yr
Wind risk 10/10 · Severe
- Chance of severe wind over 30 yrs
- 99.0%
Air-quality risk 1/10 · Minimal
- Unhealthy air days now
- 0 days/yr
- Unhealthy air days in 30 yrs
- 0 days/yr
Risk factors via First Street. Map © Google.
Why this score? — see what drove the D grade
The composite is a weighted blend of 9 inputs, each scored 0–100. Each bar is that input's sub-score; the figure is the points it added to the 100-point composite (weight × sub-score).
- Cash flow +13.5/30.0
- ARV discount +10.1/15.0
- DSCR +4.1/10.0
- 1% rule +3.8/10.0
- Schools +3.7/10.0
- Rent growth +3.2/5.0
- Livability +2.5/5.0
- Condition / age +2.5/5.0
- Appreciation +0.0/10.0
$330,390
🖨 Deal sheet (PDF) 📄 Offer letter ✓ Due diligence
Listing remarks
Open-concept townhome with a central kitchen island, perfect for prepping dinner while entertaining. Upstairs, an oversized loft suits game nights or a home office, plus a private primary suite with a large bath and walk-in closet.
Key facts
- Oversized loft
- Large bath
- Walk-in closet
Tags
Property features AI
Finance
- Financial info: List price $330,390
Exterior
- Parking: 1 parking space
- Home design: Single-family design (Pompano plan)
- Exterior features: Living area about 1506; Street address: 12977 SW Forli Way, Port Saint Lucie, FL 34987
Interior
- Bedrooms: 3 bedrooms
- Bathrooms: 2 full bathrooms and 1 half bathroom
- Interior features: Spec home (Pompano plan); Active listing
Neighborhood map
What this means for you Summary
Snapshot
- This is a 3-bed/2.5-bath single-family listed at $330k.
Deal economics
- At list price, monthly cash flow is $10 ($126/yr) — positive.
- The deal already cash-flows at list — no discount required.
- To meet the 1% rule (rent ≥ 1% of price), the offer needs to be $290k (12.1% below list).
- Recommended offer: $290k (12.1% below list) — sets the bar for 1% rule.
- Cap rate 6.3% vs local median 3.9% in Port St. Lucie — top-decile yield for the area; either an underpriced asset or a hidden risk that comps aren't pricing in. Stress-test before assuming the spread holds.
Location & tenants
- Location reads: area grade D — affects rentability + tenant quality, not the cash-flow math above.
- St. Lucie (urban): math 40% / reading 48% proficiency, ranked #51 of 73 in FL (top 70%) — families likely to look elsewhere, expect single-tenant / working-renter base with shorter leases.
- Zoned schools: Manatee Academy K-8 (math 53% / reading 51%, grade C-, #990 of 2,144 statewide, top 48%, 1,664 students, 65% FRL); Southern Oaks Middle School (math 39% / reading 43%, grade F, #353 of 571 statewide, top 63%, 894 students, 76% FRL); Fort Pierce Central High School (math 15% / reading 45%, grade F, #441 of 667 statewide, top 67%, 3,091 students, 62% FRL).
- Market conditions: Rents rising (+2.8%/yr); 1149 active listings in the ZIP; 39 comparable units currently listed for rent nearby; rentals at typical pace (median 16d on market — plan ~3-4 weeks tenant-placement turnaround); solid renter incomes; 4,868 units permitted in St. Lucie County in 2024 (268 in 5+ unit buildings).
- This rent runs 39% of the median local income ($90k/yr) — at the standard rent-burdened threshold; future hikes will face affordability resistance.
Forward outlook
- Local home prices are declining (-3.0%/yr); year-one equity from $2k of loan paydown is wiped out by about $10k of value loss. Plan a longer hold.
- St. Lucie County population projected at +20% by 2050 — long-run rental-demand tailwind backs the buy-and-hold thesis.
Negotiation context
- Only 11 days on market — expect competitive offers; lowballing is unlikely to land.
Risks & watch-outs
- Climate carrying-cost: major flood risk; severe wind risk, 99% chance of damaging wind over 30y; moderate wildfire risk; extreme-heat days projected 6→20/yr by 2055 (HVAC capex compounding) — expect insurance premiums to compound above CPI over the hold.
Questions for the listing agent
- Is there a deadline driving the sale (1031 exchange, divorce, estate, relocation)? That informs how much negotiation room exists.
- The area grade is low — what's the realistic commute time and amenity access for the typical tenant pool here? Any planned neighborhood developments (good or bad) we should know about?
- What's the average days-on-market for RENTAL listings here right now (not sales)? A rising rental-DOM trend means longer vacancies and softer asking-rent achievability than the comps imply.
- What's the recent tenant-quality profile in this submarket — average credit score on applications, eviction rate, late-payment / NSF rate, and stable-employment percentage? A property-management company in the area should have these aggregated.
- How much new for-sale + rental construction is in the pipeline within 1–3 miles? Heavy new supply typically softens prices + rents 12–24 months out; constrained supply supports both.
Investment metrics
- 1% rule
- 0.88% ✗
- Cap rate
- 6.33%
- Cash-on-cash
- 0.14%
- DSCR
- 1.01
- GRM
- 9.5
CMA / ARV
- ARV (on-the-fly)
- $350,898
- Comps found
- 12
Show comp detail 12 sales within ~0.75 mi
| Address | Dist | Beds/Ba | Sqft | Sold | Price | $/sf | Match |
|---|---|---|---|---|---|---|---|
| 9688 SW Libertas Way | 0.11mi | 3/2.0 | 1,503 (-0%) | 11mo | $349,990 | $233 | 83 |
| 9401 SW Libertas Way | 0.42mi | 3/2.0 | 1,503 (-0%) | 1mo | $342,000 | $228 | 77 |
| 12816 SW Orvieto Way | 0.21mi | 3/2.0 | 1,501 (-0%) | 13mo | $378,990 | $252 | 77 |
| 9557 SW Libertas Way | 0.25mi | 3/2.0 | 1,503 (-0%) | 17mo | $329,990 | $220 | 72 |
| 9597 SW Royal Poinciana Dr | 0.44mi | 3/2.0 | 1,610 (+7%) | 2mo | $375,000 | $233 | 64 |
| 12241 SW Rimini Way | 0.43mi | 3/2.0 | 1,614 (+7%) | 6mo | $395,000 | $245 | 61 |
| 9584 SW Royal Poinciana Dr | 0.39mi | 2/2.5 (-1) | 1,610 (+7%) | 6mo | $290,000 | $180 | 60 |
| 13321 SW Mazzano St | 0.63mi | 2/2.0 (-1) | 1,610 (+7%) | 2mo | $375,868 | $233 | 50 |
| 12236 SW Rimini Way | 0.46mi | 3/2.0 | 1,614 (+7%) | 19mo | $384,500 | $238 | 49 |
| 10026 SW Arezzo Rd | 0.70mi | 2/2.0 (-1) | 1,610 (+7%) | 2mo | $360,000 | $224 | 48 |
| 9940 SW Santini Rd | 0.58mi | 2/2.0 (-1) | 1,610 (+7%) | 10mo | $408,299 | $254 | 46 |
| 11748 SW Mountain Ash Cir | 0.58mi | 3/2.0 | 1,722 (+14%) | 16mo | $340,000 | $197 | 34 |
Match score weights: distance 35% · size 25% · config 20% · recency 20%. Top-matched comps best support the ARV.
Projected returns pro-forma
-3.0% appreciation · 2.77% rent growth · sell at horizon
- IRR
- -16.3%
- Equity multiple
- 0.42×
- Total profit
- $-53,497
- Equity at exit
- $49,262
- IRR
- -8.4%
- Equity multiple
- 0.48×
- Total profit
- $-48,285
- Equity at exit
- $28,566
Cash invested: $92,509 (down + closing). Projections, not guarantees.
Landlord ↔ Tenant lean methodology
- Overall (STATE)
- 87 Strongly Landlord-Friendly
- State Florida
- 87 Strongly Landlord-Friendly · R+3
- County
- — inherits STATE
- City
- — inherits STATE
ZIP-level market 34987
- Home prices YoY
- -21.6%
- Rents YoY
- 2.8%
- Active inventory
- 1149
- Price-to-rent
- 9.5×
Monthly cashflow live
- Estimated rent
- $2,903 high interval (Pro) →
- Mortgage (P&I)
- −$1,733
- Tax est. 1.5%
- −$413 /mo · $4,956/yr
- Insurance
- −$138
- HOA
- −$0
- Vacancy / Maint / Mgmt
- −$610
- Net cashflow
- $10
Break-even live
Sensitivity live
| Price | -10% $239 | -5% $125 | +0% $10 | +5% $-104 | +10% $-218 |
|---|---|---|---|---|---|
| Rent | -10% $-219 | -5% $-104 | +0% $10 | +5% $125 | +10% $240 |
| Rate | -1.0pp $177 | -0.5pp $95 | base $10 | +0.5pp $-75 | +1.0pp $-162 |
UW: 25.0% down · 7.5% · 30yr · 1.5% tax · 5.0% vac · 8.0% maint · 8.0% mgmt
Financing live
Cash to close
- Down payment
- $82,598
- Closing costs
- $9,912
- Reserves months
- —
- Total cash needed
- —
Loan-product check · same deal, 3 products live
Conventional
25% down · 7.5% · 30yr
- Down + closing
- —
- Monthly P&I
- —
- Monthly cashflow
- —
- DSCR
- —
- Eligible?
- —
Personal DTI + credit; lowest rate.
DSCR
20% down · 8.5% · 30yr
- Down + closing
- —
- Monthly P&I
- —
- Monthly cashflow
- —
- DSCR
- —
- Eligible?
- —
No personal income docs; deal must DSCR.
Hard money
10% down · 12.0% · 12mo
- Down + closing
- —
- Monthly P&I
- —
- Monthly cashflow
- —
- DSCR
- —
- Eligible?
- —
Short-term bridge; refi at stabilization.
Rent comps 39 comps
| Address | Beds | Baths | Sqft | Rent | $/sqft | DOM | Units | Dist |
|---|---|---|---|---|---|---|---|---|
| 9670 SW Libertas Way Port Saint Lucie, FL | 3.0 | 2.0 | 1503 | $2,700 | $1.80 | 16d | 1 | 0.10mi |
| 13138 SW Valletta Way Port Saint Lucie, FL | 3.0–4.0 | 2.5 | 1727 | $2,685 | $1.55 | 16d | 25 | 0.15mi |
| 12845 SW Forli Way Port Saint Lucie, FL | 3.0 | 2.5 | 1758 | $2,800 | $1.59 | 16d | 1 | 0.15mi |
| 12865 SW Forli Way Port Saint Lucie, FL | 3.0 | 2.5 | 1673 | $2,700 | $1.61 | 23d | 1 | 0.15mi |
| 9509 SW Libertas Way Port Saint Lucie, FL | 3.0 | 2.0 | 1503 | $2,800 | $1.86 | 25d | 1 | 0.28mi |
| 12271 SW Rimini Way Port Saint Lucie, FL | 3.0 | 2.0 | 1504 | $2,400 | $1.60 | 25d | 1 | 0.39mi |
| 12134 SW Rimini Way Port Saint Lucie, FL | 3.0 | 2.0 | 1504 | $2,500 | $1.66 | 25d | 1 | 0.45mi |
| 9796 SW Santini Rd Port Saint Lucie, FL | 2.0 | 2.0 | 1929 | $3,500 | $1.81 | 16d | 1 | 0.46mi |
| 12500 Roma Way Port Saint Lucie, FL | 1.0–3.0 | 1.0–2.0 | 969 | $2,657 | $2.74 | 16d | 7 | 0.55mi |
| 11590 SW Roma Cir Port St. Lucie, FL | 1.0–3.0 | 1.0–2.5 | 1179 | $3,071 | $2.60 | 16d | 36 | 0.69mi |
| 9231 SW Pepoli Way Port Saint Lucie, FL | 3.0 | 2.0 | 1646 | $2,750 | $1.67 | 23d | 1 | 0.70mi |
| 9231 SW Pepoli Way Port Saint Lucie, FL | 3.0 | 2.0 | 1646 | $2,750 | $1.67 | 25d | 1 | 0.70mi |
| 11590 Roma Way Unit 9-303 Port St. Lucie, FL | 2.0 | 2.0 | 1121 | $2,410 | $2.15 | 16d | 1 | 0.73mi |
| 11590 Roma Way Unit 7-105 Port St. Lucie, FL | 3.0 | 2.0 | 1265 | $2,660 | $2.10 | 16d | 1 | 0.73mi |
| 9184 SW Esule Way Port Saint Lucie, FL | 3.0 | 2.0 | 1787 | $2,750 | $1.54 | 16d | 1 | 0.89mi |
| 9084 SW Arco Way Port Saint Lucie, FL | 3.0 | 3.0 | 2129 | $4,500 | $2.11 | 25d | 1 | 0.91mi |
| 12813 SW Ambra St Port Saint Lucie, FL | 3.0 | 2.5 | 1828 | $3,200 | $1.75 | 16d | 1 | 0.92mi |
| 11344 SW Pietra Way Port Saint Lucie, FL | 3.0 | 3.0 | 2129 | $3,700 | $1.74 | 16d | 1 | 0.97mi |
| 9630 SW Flowermound Cir Port Saint Lucie, FL | 3.0 | 2.0 | 1761 | $2,495 | $1.42 | 16d | 1 | 1.01mi |
| 11267 SW Pietra Way Port Saint Lucie, FL | 2.0 | 2.0 | 1667 | $3,200 | $1.92 | 25d | 1 | 1.05mi |
| 10936 SW Vasari Way Port Saint Lucie, FL | 4.0 | 2.5 | 2100 | $3,450 | $1.64 | 16d | 1 | 1.05mi |
| 10231 SW Latium Way Port Saint Lucie, FL | 3.0 | 3.0 | 2129 | $4,900 | $2.30 | 25d | 1 | 1.07mi |
| 11477 SW Patterson St Port Saint Lucie, FL | 3.0 | 2.0 | 1649 | $2,600 | $1.58 | 25d | 1 | 1.09mi |
| 11160 SW Lunata Way Port Saint Lucie, FL | 3.0 | 2.0 | 1968 | $3,850 | $1.96 | 25d | 1 | 1.09mi |
| 10057 SW Newberry Ave Port Saint Lucie, FL | 3.0 | 2.0 | 1649 | $2,500 | $1.52 | 23d | 1 | 1.14mi |
| 14058 SW Surina St Port Saint Lucie, FL | 4.0 | 2.0 | 1894 | $2,990 | $1.58 | 16d | 1 | 1.19mi |
| 9728 SW Eastbrook Cir Port Saint Lucie, FL | 2.0 | 2.0 | 1332 | $2,300 | $1.73 | 16d | 1 | 1.20mi |
| 10736 SW Prato Way Port Saint Lucie, FL | 4.0 | 2.0 | 1955 | $2,700 | $1.38 | 25d | 1 | 1.23mi |
| 9282 SW Miracoli Way Port Saint Lucie, FL | 3.0 | 2.0 | 1932 | $4,900 | $2.54 | 25d | 1 | 1.25mi |
| 10695 SW Prato Way Port Saint Lucie, FL | 4.0 | 2.0 | 1916 | $2,850 | $1.49 | 16d | 1 | 1.31mi |
| 14143 SW Safi Ter Port Saint Lucie, FL | 3.0 | 2.0 | 1651 | $2,900 | $1.76 | 16d | 1 | 1.32mi |
| 12401 SW Arabella Dr Port Saint Lucie, FL | 4.0 | 2.0 | 1916 | $2,650 | $1.38 | 25d | 1 | 1.33mi |
| 14075 SW Thorens Dr Port Saint Lucie, FL | 3.0 | 2.5 | 1916 | $2,800 | $1.46 | 25d | 1 | 1.35mi |
| 10495 SW Orana Dr Port Saint Lucie, FL | 3.0 | 2.0 | 1657 | $3,000 | $1.81 | 25d | 1 | 1.39mi |
| 14122 SW Thorens Dr Port Saint Lucie, FL | 3.0 | 2.5 | 1674 | $2,700 | $1.61 | 16d | 1 | 1.39mi |
| 14162 SW Thorens Dr Port Saint Lucie, FL | 3.0 | 2.5 | 1754 | $2,650 | $1.51 | 25d | 1 | 1.40mi |
| 10241 SW Newberry Ave Port St. Lucie, FL | 2.0–3.0 | 2.5 | 1448 | $2,905 | $2.01 | 16d | 29 | 1.41mi |
| 10574 SW Cambria Ln Port Saint Lucie, FL | 4.0 | 2.0 | 1916 | $3,000 | $1.57 | 25d | 1 | 1.42mi |
| 10597 SW Vasari Way Port Saint Lucie, FL | 3.0 | 2.0 | 1549 | $2,700 | $1.74 | 16d | 1 | 1.44mi |
Listing history 8 events
-
2026-06-21days on market $330,390 Active 11 DOM
-
2026-06-18days on market $330,390 Active 8 DOM
-
2026-06-17days on market $330,390 Active 7 DOM
-
2026-06-16days on market $330,390 Active 6 DOM
-
2026-06-15days on market $330,390 Active 5 DOM
-
2026-06-14days on market $330,390 Active 3 DOM
-
2026-06-13remarks 231-char remark
-
2026-06-13$330,390 Active 2 DOM
ⓘ Source: listings_history table (triggers on properties + properties_extension) + one-shot
backfill from property_details.listing_events for pre-trigger history.
Climate risk First Street
- Flood 6/10 Major FEMA zone X (unshaded) · 97% chance over 30 yrs
- Wildfire 5/10 Major
- Heat 9/10 Extreme 6 d/yr ≥107°F today · 20 d/yr by 30 yrs out
- Wind 10/10 Extreme 99% chance of damaging wind over 30 yrs
- Air quality 1/10 Low 0 unhealthy d/yr today · 0 by 30 yrs out
Nearby sold comps map
Loading sold comps map…
Walkable amenities ~0.75 mi
Loading nearby amenities…
Taxation est. · year 1
- Rental income
- $34,841
- − Mortgage interest
- −$18,507
- − Property taxes
- −$4,956
- − Insurance
- −$1,652
- − Repairs & maintenance
- −$2,787
- − Management
- −$2,787
- − Depreciation
- −$9,611
- Taxable loss
- −$5,459
- Est. tax savings @ 24.0%
- +$1,310
- After-tax cash flow
- $1,436/yr
For passive investors: Depreciation is non-cash, so a rental often shows a tax loss while cash-flowing — sheltering income. Rental losses are passive: they offset passive income freely, and up to $25,000/yr can offset ordinary (W-2) income if you actively participate and your MAGI is under $100k (phasing out to $0 by $150k); unused losses carry forward. On sale, claimed depreciation is recaptured at up to 25%, and gains may owe capital-gains tax (a 1031 exchange can defer both). Figures are a year-1 estimate at your 24.0% rate — not tax advice; consult a CPA.
Schools (NCES district)
- District
- St. Lucie
- NCES district ID
- 1201770
- Math proficiency
- 40% ▼ -11.00%
- Reading proficiency
- 48% ▼ -4.00%
- Median HH income
- $44,737
- Composite
- 37.28/100
- National rank
- #4449
- State rank
- #51 of 73 in FL
Livability — Port St. Lucie
No livability data for this city. (Only ~50 U.S. cities are tracked.)
Census & demographics
- Census place
- Port St. Lucie, FL
- County
- Saint Lucie County · 337,150 people
- City population
- 221,051
- Metro
- Port St. Lucie, FL
- Population (ZIP)
- 21,727
- Household income
- $90,201
- Rent vs Own
- Severe rent burden
- 597.0
Population outlook (St. Lucie County) Hauer SSP2
- Today (2025)
- 338,016 people
- By 2030
- 355,687 · +5.2%
- By 2040
- 385,521 · +14.1%
- By 2050
- 406,106 · +20.1%
- By 2075
- 441,054 · +30.5%
- By 2100
- 436,885 · +29.2%
Race, ethnicity, and origin ACS 2023
- Neighborhood character
- Predominantly White (70%)
- Race & ethnicity
- White 70% Hispanic / Latino 15% Black 12% Two or more races 11%
- Hispanic origin (detail)
- Mexican 1% Puerto Rican 7% Cuban 1%
- Common ancestry
- Romanian 4% Italian 3% Scotch-Irish 2%
- Foreign-born
- 15% · Canada, Dominican Republic, Jamaica
- Languages at home
- 83% English-only · Spanish 13% Arabic 1% Other Indo-European 1%
Political lean MEDSL · St. Lucie
- 2024 margin
- Lean R (+9.1) · D 45.1% · R 54.2%
- 2008→2024 swing
- -21.2pp toward R · 2008: 12.1pp · 2024: -9.1pp
- All cycles
- 2024: R+9.1 2020: R+1.6 2016: R+2.5 2012: D+7.9 2008: D+12.1
Not yet ingested
- Civics
- —
Market trends
- HPI YoY
- ▼ -74.23%
- Current HPI
- 269.222
- Rent YoY
- ▲ 2.77%
- Metro
- Port St. Lucie, FL
- State GDP YoY
- ▲ 3.28%
- F500 in state
- 36
Industry mix (Fortune 500 HQ in FL)
| Industry | F500 HQs | Revenue |
|---|---|---|
| Industrial Technology | 2 | $29B |
|
||
| Insurance | 2 | $17B |
|
||
| Retail | 1 | $60B |
|
||
| Technology Distribution | 1 | $58B |
|
||
| Homebuilding | 1 | $35B |
|
||
| Technology Manufacturing | 1 | $35B |
|
||
Cash-flow waterfall
monthlySold comps — $/sqft
last 12 mo · ≤1 miLoading sold comps…