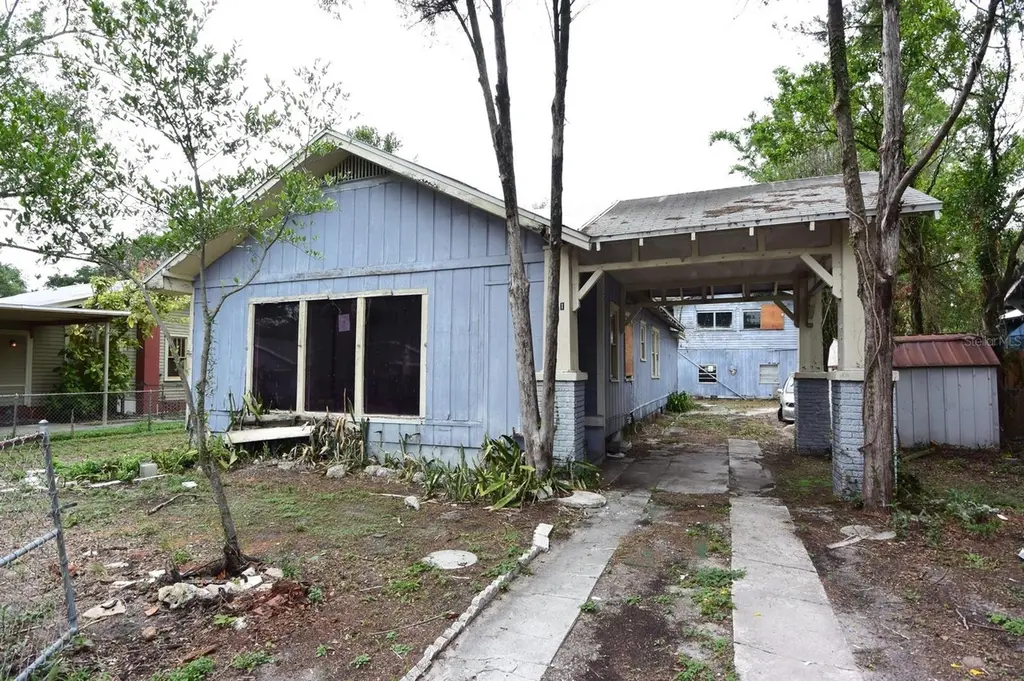
111 W Powhatan Ave · Tampa, FL
Flood risk 1/10 · Minimal
- FEMA flood zone
- X (unshaded)
- Chance of flooding over 30 yrs
- 0.0%
- Est. flood insurance / yr
- $507 – $1,088
Fire risk 1/10 · Minimal
- Est. fire insurance / yr
- $947 – $1,759
Heat risk 10/10 · Severe
- Hot days now (above 108°F)
- 6 days/yr
- Hot days in 30 yrs
- 20 days/yr
Wind risk 9/10 · Severe
- Chance of severe wind over 30 yrs
- 99.0%
Air-quality risk 3/10 · Minor
- Unhealthy air days now
- 3 days/yr
- Unhealthy air days in 30 yrs
- 3 days/yr
Risk factors via First Street. Map © Google.
Why this score? — see what drove the C+ grade
The composite is a weighted blend of 9 inputs, each scored 0–100. Each bar is that input's sub-score; the figure is the points it added to the 100-point composite (weight × sub-score).
- Cash flow +25.6/30.0
- DSCR +8.5/10.0
- ARV discount +7.5/15.0
- 1% rule +5.9/10.0
- Schools +4.2/10.0
- Livability +4.0/5.0
- Rent growth +2.6/5.0
- Condition / age +2.5/5.0
- Appreciation +0.0/10.0
$203,000
🖨 Deal sheet (PDF) 📄 Offer letter ✓ Due diligence
Listing remarks
Opportunity knocks in the heart of Seminole Heights! Located in the desirable West Suwanee Heights area, this historic Craftsman bungalow is ready for a complete transformation. The home features spacious bedrooms, a wood-burning fireplace, attached carport, and loads of original character waiting to be restored. The detached ADU is currently in poor condition and may be best suited for redevelopment or replacement. Situated on a generous 62' x 134' lot with rear alley access, this property presents a unique opportunity for investors, builders, or ambitious renovators. The SH-RS zoning district permits Accessory Dwelling Units (ADUs), offering exciting possibilities for future income potent
Key facts
- Detached adu
- 62 x 134 lot
- Rear alley access
Tags
Property features AI
Finance
- Other: Zoning: SH-RS
- HOA & community: No association indicated; Pets allowed
Exterior
- Parking: Has carport (1 space)
- Utilities: Public water; Public sewer; Cable available; Electricity available; Sewer connected; Water connected
- Home design: Single-family residence; One story; Faces south
- Construction: Wood siding construction; Shingle roof; Crawlspace foundation; Built area approximately 1,619 sq ft (living area 1,328 sq ft)
- Exterior features: Level lot; No patio or porch listed; Bamboo vegetation; Asphalt road frontage
Interior
- Kitchen: No appliances included
- Bedrooms: 2 bedrooms
- Flooring: Ceramic tile; Wood
- Bathrooms: 2 full bathrooms
- Heating & cooling: Central heating (electric); Central air conditioning
- Interior features: Eat-in kitchen; Living room fireplace
- Laundry & utility: Electric dryer hookup
Neighborhood map
What this means for you Summary
Snapshot
- This is a 2-bed/1.0-bath single-family listed at $203k.
Deal economics
- At list price, monthly cash flow is $477 ($6k/yr) — positive.
- The deal already cash-flows at list — no discount required.
- Meets the 1% rule at list price ($2k rent vs $203k).
- Recommended offer: $200k (1.5% below list) — sets the bar for market timing.
Location & tenants
- Location reads 79/100 on livability (#142 in FL, #2,135 nationally) — a middle-class / working-renter tenant base. Strengths: commute A+, housing A+, health & safety A+; Watch: crime D+.
- Hillsborough (suburban): math 47% / reading 50% proficiency, ranked #41 of 73 in FL (top 56%) — families likely to look elsewhere, expect single-tenant / working-renter base with shorter leases.
- Zoned schools: Hillsborough High School (math 30% / reading 48%, grade F, #312 of 667 statewide, top 48%, 1,891 students, 56% FRL) — zoned schools at 56% FRL track the district average.
- Market conditions: Rents flat; 371 active listings in the ZIP; 40 comparable units currently listed for rent nearby; rentals at typical pace (median 23d on market — plan ~3-4 weeks tenant-placement turnaround); 9,053 units permitted in Hillsborough County in 2024 (4,555 in 5+ unit buildings).
- This rent runs 45% of the median local income ($59k/yr) — at the standard rent-burdened threshold; future hikes will face affordability resistance.
Forward outlook
- Local home prices are declining (-3.0%/yr); year-one equity from $1k of loan paydown is wiped out by about $6k of value loss. Plan a longer hold.
- Hillsborough County population projected at +37% by 2050 — long-run rental-demand tailwind backs the buy-and-hold thesis.
Negotiation context
- It's been on market 22 days — a 2% lower offer ($200k) is reasonable based on typical stale-listing flexibility.
- Current owner paid $77k; list at $203k implies a 164% gain — meaningful room to come down on a strong offer.
Risks & watch-outs
- Watch-outs: built in 1926 — expect roof / HVAC / electrical / plumbing capex.
- Climate carrying-cost: severe wind risk, 99% chance of damaging wind over 30y; extreme-heat days projected 6→20/yr by 2055 (HVAC capex compounding) — expect insurance premiums to compound above CPI over the hold.
Questions for the listing agent
- Built in 1926 — when were the roof, HVAC, electrical panel, plumbing, and water heater last replaced?
- Is there a deadline driving the sale (1031 exchange, divorce, estate, relocation)? That informs how much negotiation room exists.
- Crime grade is D in this area — have there been break-ins, vandalism, or insurance claims at this property in the last 3 years? What carrier currently insures it and at what premium?
- What's the average days-on-market for RENTAL listings here right now (not sales)? A rising rental-DOM trend means longer vacancies and softer asking-rent achievability than the comps imply.
- What's the recent tenant-quality profile in this submarket — average credit score on applications, eviction rate, late-payment / NSF rate, and stable-employment percentage? A property-management company in the area should have these aggregated.
- How much new for-sale + rental construction is in the pipeline within 1–3 miles? Heavy new supply typically softens prices + rents 12–24 months out; constrained supply supports both.
Investment metrics
- 1% rule
- 1.09% ✓
- Cap rate
- 9.11%
- Cash-on-cash
- 10.07%
- DSCR
- 1.45
- GRM
- 7.7
CMA / ARV
No comps found within radius.
Projected returns pro-forma
-3.0% appreciation · 0.52% rent growth · sell at horizon
- IRR
- -3.8%
- Equity multiple
- 0.86×
- Total profit
- $-7,930
- Equity at exit
- $30,268
- IRR
- 3.0%
- Equity multiple
- 1.19×
- Total profit
- $11,055
- Equity at exit
- $17,552
Cash invested: $56,840 (down + closing). Projections, not guarantees.
Landlord ↔ Tenant lean methodology
- Overall (STATE)
- 87 Strongly Landlord-Friendly
- State Florida
- 87 Strongly Landlord-Friendly · R+3
- County
- — inherits STATE
- City
- — inherits STATE
ZIP-level market 33604
- Home prices YoY
- -31.3%
- Rents YoY
- 0.5%
- Active inventory
- 371
- Price-to-rent
- 7.7×
Monthly cashflow live
- Estimated rent
- $2,203 high interval (Pro) →
- Mortgage (P&I)
- −$1,065
- Tax from tax record
- −$114 /mo · $1,373/yr
- Insurance
- −$85
- HOA
- −$0
- Vacancy / Maint / Mgmt
- −$463
- Net cashflow
- $477
Break-even live
Sensitivity live
| Price | -10% $592 | -5% $534 | +0% $477 | +5% $420 | +10% $362 |
|---|---|---|---|---|---|
| Rent | -10% $303 | -5% $390 | +0% $477 | +5% $564 | +10% $651 |
| Rate | -1.0pp $579 | -0.5pp $529 | base $477 | +0.5pp $424 | +1.0pp $371 |
UW: 25.0% down · 7.5% · 30yr · 1.5% tax · 5.0% vac · 8.0% maint · 8.0% mgmt
Financing live
Cash to close
- Down payment
- $50,750
- Closing costs
- $6,090
- Reserves months
- —
- Total cash needed
- —
Loan-product check · same deal, 3 products live
Conventional
25% down · 7.5% · 30yr
- Down + closing
- —
- Monthly P&I
- —
- Monthly cashflow
- —
- DSCR
- —
- Eligible?
- —
Personal DTI + credit; lowest rate.
DSCR
20% down · 8.5% · 30yr
- Down + closing
- —
- Monthly P&I
- —
- Monthly cashflow
- —
- DSCR
- —
- Eligible?
- —
No personal income docs; deal must DSCR.
Hard money
10% down · 12.0% · 12mo
- Down + closing
- —
- Monthly P&I
- —
- Monthly cashflow
- —
- DSCR
- —
- Eligible?
- —
Short-term bridge; refi at stabilization.
Rent comps 40 comps
| Address | Beds | Baths | Sqft | Rent | $/sqft | DOM | Units | Dist |
|---|---|---|---|---|---|---|---|---|
| 5706 N Suwanee Ave Unit 1271940P Tampa, FL | 2.0 | 1.0 | 914 | $2,739 | $3.00 | 0d | 1 | 0.15mi |
| 103 E Mohawk Ave Unit B Tampa, FL | 1.0 | 1.0 | 980 | $1,300 | $1.33 | 4d | 1 | 0.19mi |
| 503 W Idlewild Ave Tampa, FL | 2.0 | 2.0 | 968 | $2,200 | $2.27 | 17d | 1 | 0.31mi |
| 303 E Paris St Tampa, FL | 2.0 | 2.0 | 1442 | $2,200 | $1.53 | 25d | 1 | 0.33mi |
| 203 W Crest Ave Tampa, FL | 2.0 | 1.0 | 900 | $2,100 | $2.33 | 25d | 1 | 0.34mi |
| 203 W Haya St Tampa, FL | 2.0 | 1.0 | 990 | $1,950 | $1.97 | 6d | 1 | 0.40mi |
| 5305 N Boulevard Tampa, FL | 1.0–2.0 | 1.0–2.5 | 970 | $2,100 | $2.16 | 4d | 4 | 0.41mi |
| 5205 N Boulevard Tampa, FL | 1.0–3.0 | 1.0–2.0 | 1175 | $1,854 | $1.58 | 4d | 17 | 0.47mi |
| 325 W Jean St Tampa, FL | 3.0 | 2.0 | 1200 | $2,500 | $2.08 | 25d | 1 | 0.52mi |
| 6506 N Wellington Ave Unit B Tampa, FL | 1.0 | 1.0 | 900 | $1,200 | $1.33 | 25d | 1 | 0.60mi |
| 113 W Knollwood St Tampa, FL | 3.0 | 2.0 | 1556 | $1,850 | $1.19 | 23d | 1 | 0.63mi |
| 309 W Osborne Ave Tampa, FL | 3.0 | 1.5 | 1462 | $3,300 | $2.26 | 25d | 1 | 0.70mi |
| 113 W Elm St Tampa, FL | 3.0 | 2.0 | 1473 | $3,400 | $2.31 | 19d | 1 | 0.77mi |
| 809 W Hiawatha St Tampa, FL | 3.0 | 2.0 | 1345 | $2,600 | $1.93 | 21d | 1 | 0.80mi |
| 5611 N McKay Ave Tampa, FL | 2.0 | 1.0 | 912 | $1,795 | $1.97 | 23d | 1 | 0.82mi |
| 5611 N McKay Ave Tampa, FL | 2.0 | 1.0 | 912 | $1,795 | $1.97 | 25d | 1 | 0.82mi |
| 1209 E Comanche Ave Tampa, FL | 2.0 | 2.0 | 1659 | $2,500 | $1.51 | 6d | 1 | 0.85mi |
| 4513 N Florida Ave Tampa, FL | 2.0 | 1.0 | 887 | $2,299 | $2.59 | 2d | 6 | 0.85mi |
| 6905 N Duncan Ave Unit A Tampa, FL | 2.0 | 2.0 | 1214 | $1,850 | $1.52 | 25d | 1 | 0.85mi |
| 6906 N Lynn Ave Tampa, FL | 3.0 | 2.0 | 1772 | $2,695 | $1.52 | 25d | 1 | 0.85mi |
| 1212 E Mohawk Ave Tampa, FL | 3.0 | 1.0 | 1266 | $1,995 | $1.58 | 21d | 1 | 0.88mi |
| 6416 N Orleans Ave Tampa, FL | 2.0 | 1.0 | 1008 | $2,300 | $2.28 | 16d | 1 | 0.89mi |
| 203 W Emma St Tampa, FL | 3.0 | 2.0 | 1279 | $2,700 | $2.11 | 25d | 1 | 0.89mi |
| 203 W Emma St Tampa, FL | 3.0 | 2.0 | 1279 | $2,500 | $1.95 | 12d | 1 | 0.89mi |
| 7006 N Duncan Ave Unit A Tampa, FL | 2.0 | 2.0 | 1000 | $2,300 | $2.30 | 0d | 1 | 0.90mi |
| 914 W Cimmeron Dr Tampa, FL | 2.0 | 2.0 | 1763 | $4,250 | $2.41 | 25d | 1 | 0.95mi |
| 6915 N Central Ave Tampa, FL | 3.0 | 2.0 | 1854 | $3,295 | $1.78 | 4d | 1 | 0.96mi |
| 7201 N Highland Ave Tampa, FL | 2.0 | 1.0 | 1400 | $2,350 | $1.68 | 25d | 1 | 0.96mi |
| 411 W Flora St Tampa, FL | 2.0 | 1.0 | 1400 | $2,750 | $1.96 | 23d | 1 | 0.97mi |
| 902 E Curtis St Unit 1 Tampa, FL | 2.0 | 2.0 | 1325 | $3,200 | $2.42 | 19d | 1 | 0.98mi |
| 4412 N Clearfield Ave Tampa, FL | 3.0 | 2.0 | 1336 | $2,250 | $1.68 | 25d | 1 | 0.98mi |
| 1202 E Caracas St Tampa, FL | 3.0 | 3.0 | 1224 | $2,595 | $2.12 | 25d | 1 | 0.99mi |
| 5500 N Rome Ave Unit 29 Tampa, FL | 1.0 | 1.0 | 1864 | $1,500 | $0.80 | 25d | 1 | 0.99mi |
| 4901 W Bartlett Dr Tampa, FL | 3.0 | 2.0 | 1800 | $3,200 | $1.78 | 25d | 1 | 1.01mi |
| 900 E Sligh Ave Tampa, FL | 2.0 | 1.0–2.0 | 888 | $2,630 | $2.96 | 0d | 35 | 1.05mi |
| 7218 N Highland Ave Tampa, FL | 3.0 | 2.0 | 1448 | $2,950 | $2.04 | 6d | 1 | 1.05mi |
| 406 W Alva St Tampa, FL | 2.0 | 1.0 | 936 | $2,500 | $2.67 | 25d | 1 | 1.07mi |
| 314 W Alva St Tampa, FL | 3.0 | 2.0 | 1170 | $3,000 | $2.56 | 25d | 1 | 1.07mi |
| 212 W North Bay St Tampa, FL | 3.0 | 1.0 | 1065 | $2,600 | $2.44 | 4d | 1 | 1.12mi |
| 7309 N Dartmouth Ave Tampa, FL | 3.0 | 2.0 | 1248 | $2,041 | $1.64 | 0d | 1 | 1.12mi |
Listing history 16 events
-
2026-06-21days on market $203,000 Active 22 DOM
-
2026-06-18days on market $203,000 Active 19 DOM
-
2026-06-17days on market $203,000 Active 18 DOM
-
2026-06-16days on market $203,000 Active 17 DOM
-
2026-06-15days on market $203,000 Active 16 DOM
-
2026-06-13days on market $203,000 Active 14 DOM
-
2026-06-13days on market $203,000 Active 13 DOM
-
2026-06-09days on market $203,000 Active 10 DOM
-
2026-06-08days on market $203,000 Active 9 DOM
-
2026-06-07days on market $203,000 Active 8 DOM
-
2026-06-04days on market $203,000 Active 5 DOM
-
2026-06-03days on market $203,000 Active 4 DOM
-
2026-06-02days on market $203,000 Active 3 DOM
-
2026-06-01days on market $203,000 Active 2 DOM
-
2026-05-31remarks 699-char remark
-
2026-05-31$203,000 Active 1 DOM
ⓘ Source: listings_history table (triggers on properties + properties_extension) + one-shot
backfill from property_details.listing_events for pre-trigger history.
Tax reassessment forecast FL · Resets to sale price
- Current annual tax
- $1,373 · $114/mo
- Projected year-2 tax
- $1,685 · $140/mo
- Expected delta
- +$312/yr (+$26/mo · 22.7%)
ⓘ Screening estimate from a state-policy table — verify with the county assessor before closing.
Climate risk First Street
- Flood 1/10 Low FEMA zone X (unshaded) · 0% chance over 30 yrs
- Wildfire 1/10 Low
- Heat 10/10 Extreme 6 d/yr ≥108°F today · 20 d/yr by 30 yrs out
- Wind 9/10 Extreme 99% chance of damaging wind over 30 yrs
- Air quality 3/10 Moderate 3 unhealthy d/yr today · 3 by 30 yrs out
Nearby sold comps map
Loading sold comps map…
Walkable amenities ~0.75 mi
Loading nearby amenities…
Taxation est. · year 1
- Rental income
- $26,439
- − Mortgage interest
- −$11,371
- − Property taxes
- −$1,373
- − Insurance
- −$1,015
- − Repairs & maintenance
- −$2,115
- − Management
- −$2,115
- − Depreciation
- −$5,905
- Taxable income
- $2,544
- Est. tax owed @ 24.0%
- −$611
- After-tax cash flow
- $5,114/yr
For passive investors: Depreciation is non-cash, so a rental often shows a tax loss while cash-flowing — sheltering income. Rental losses are passive: they offset passive income freely, and up to $25,000/yr can offset ordinary (W-2) income if you actively participate and your MAGI is under $100k (phasing out to $0 by $150k); unused losses carry forward. On sale, claimed depreciation is recaptured at up to 25%, and gains may owe capital-gains tax (a 1031 exchange can defer both). Figures are a year-1 estimate at your 24.0% rate — not tax advice; consult a CPA.
Schools (NCES district)
- District
- Hillsborough
- NCES district ID
- 1200870
- Math proficiency
- 47% ▼ -8.00%
- Reading proficiency
- 50% ▼ -4.00%
- Median HH income
- $50,622
- Composite
- 41.6/100
- National rank
- #3435
- State rank
- #41 of 73 in FL
Livability — Tampa
- Score
- 79/100
- State rank
- #142
- US rank
- #2135
Category grades
Schools grade is shown separately in the Schools card above.
Census & demographics
- Census place
- Tampa, FL
- County
- Hillsborough County · 1,540,968 people
- City population
- 523,346
- Metro
- Tampa-St. Petersburg-Clearwater, FL
- Population (ZIP)
- 40,055
- Household income
- $58,766
- Rent vs Own
- Severe rent burden
- 2581.0
Population outlook (Hillsborough County) Hauer SSP2
- Today (2025)
- 1,607,022 people
- By 2030
- 1,733,968 · +7.9%
- By 2040
- 1,979,565 · +23.2%
- By 2050
- 2,203,427 · +37.1%
- By 2075
- 2,667,893 · +66.0%
- By 2100
- 2,891,558 · +79.9%
Race, ethnicity, and origin ACS 2023
- Neighborhood character
- Diverse neighborhood (Simpson 0.69)
- Race & ethnicity
- Hispanic / Latino 38% White 35% Two or more races 22% Black 21% Asian 2%
- Hispanic origin (detail)
- Mexican 3% Puerto Rican 11% Cuban 13% Dominican 2%
- Common ancestry
- Romanian 3% Lithuanian 2% Slovak 1%
- Foreign-born
- 18% · Canada, Vietnam, Jamaica
- Languages at home
- 66% English-only · Spanish 30% Vietnamese 1% French/Haitian/Cajun 1%
Political lean MEDSL · Hillsborough
- 2024 margin
- Toss-up / Even · D 47.8% · R 50.9% · Other 1.3%
- 2008→2024 swing
- -10.2pp toward R · 2008: 7.1pp · 2024: -3.1pp
- All cycles
- 2024: R+3.1 2020: D+6.9 2016: D+6.8 2012: D+6.7 2008: D+7.1
Not yet ingested
- Civics
- —
Market trends
- HPI YoY
- ▼ -200.24%
- Current HPI
- 439.7084
- Rent YoY
- ▲ 0.52%
- Metro
- Tampa-St. Petersburg-Clearwater, FL
- State GDP YoY
- ▲ 3.28%
- F500 in state
- 36
Industry mix (Fortune 500 HQ in FL)
| Industry | F500 HQs | Revenue |
|---|---|---|
| Industrial Technology | 2 | $29B |
|
||
| Insurance | 2 | $17B |
|
||
| Retail | 1 | $60B |
|
||
| Technology Distribution | 1 | $58B |
|
||
| Homebuilding | 1 | $35B |
|
||
| Technology Manufacturing | 1 | $35B |
|
||
Price history
+222.2% since first listed3 events — show timeline
- 2026-05-30 Listed $203,000 Stellar MLS as Distributed by MLS Grid
- 1995-11-14 Sold (Public Records) $77,000 Public Records
- 1988-10-01 Sold (Public Records) $63,000 Public Records
Property tax history
+4.5%/yrLatest (2025): $1,373 · +8.2% YoY. Source: county tax records.
Cash-flow waterfall
monthlySold comps — $/sqft
last 12 mo · ≤1 miLoading sold comps…