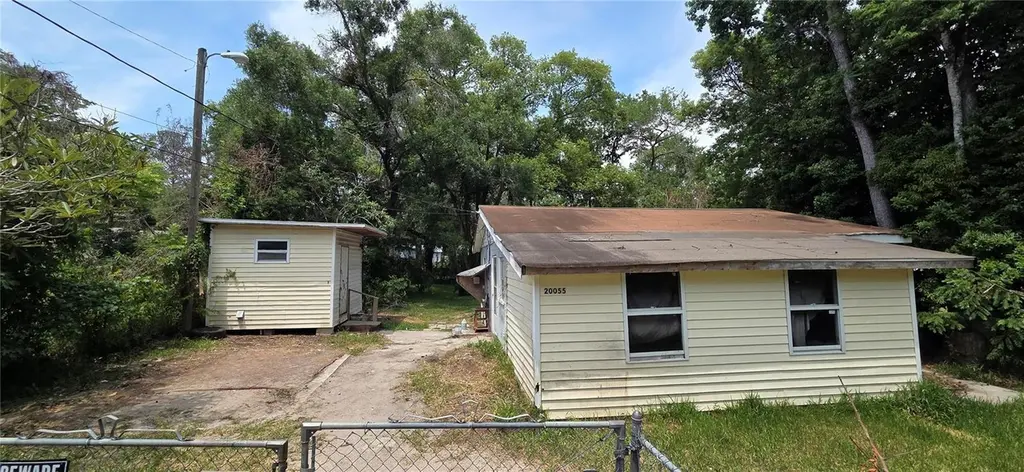
20055 Ruth St · North Brooksville, FL
Flood risk 1/10 · Minimal
- FEMA flood zone
- X (unshaded)
- Chance of flooding over 30 yrs
- 0.0%
- Est. flood insurance / yr
- $507 – $1,088
Fire risk 4/10 · Minor
- Est. fire insurance / yr
- $947 – $1,759
Heat risk 9/10 · Severe
- Hot days now (above 109°F)
- 7 days/yr
- Hot days in 30 yrs
- 25 days/yr
Wind risk 9/10 · Severe
- Chance of severe wind over 30 yrs
- 99.0%
Air-quality risk 2/10 · Minimal
- Unhealthy air days now
- 1 days/yr
- Unhealthy air days in 30 yrs
- 1 days/yr
Risk factors via First Street. Map © Google.
Why this score? — see what drove the B+ grade
The composite is a weighted blend of 9 inputs, each scored 0–100. Each bar is that input's sub-score; the figure is the points it added to the 100-point composite (weight × sub-score).
- Cash flow +30.0/30.0
- ARV discount +15.0/15.0
- DSCR +10.0/10.0
- 1% rule +8.9/10.0
- Schools +4.2/10.0
- Livability +3.2/5.0
- Rent growth +2.5/5.0
- Condition / age +2.5/5.0
- Appreciation +0.0/10.0
$89,900
🖨 Deal sheet (PDF) 📄 Offer letter ✓ Due diligence
Listing remarks
Under contract-accepting backup offers. Investor Special in Brooksville! This 2-bedroom, 1-bath home presents an excellent opportunity for an owner-occupant or investor looking to add value. Offered as-is.
Key facts
- 8,554 sq ft lot
- Built 1960
- Listed 4 days
Property features AI
Finance
- Other: Property type: Residential, Single Family Residence; Zoning: R1C; Lot size approximately 0.2 acres (0 to less than 1/4 acre)
- Financial info: Tax information available (not included per instructions)
- HOA & community: No HOA association indicated
Exterior
- Parking: Parking details not provided
- Security: No specific security features listed
- Utilities: Public water; Septic tank sewer; Other utilities
- Home design: Single Family Residence; One story; Faces west
- Construction: Block and other construction materials; Other roof; Other foundation details; Built on one level
- Exterior features: Other exterior features
Interior
- Kitchen: Other appliances
- Bedrooms: 2 bedrooms
- Flooring: Other flooring
- Bathrooms: 1 full bathroom
- Heating & cooling: Other heating; Other cooling
- Interior features: Other interior features
- Laundry & utility: No laundry facilities (None)
Neighborhood map
What this means for you Summary
Snapshot
- This is a 2-bed/1.0-bath single-family listed at $90k.
Deal economics
- At list price, monthly cash flow is $379 ($5k/yr) — positive.
- The deal already cash-flows at list — no discount required.
- Meets the 1% rule at list price ($1k rent vs $90k).
- Cap rate 11.4% vs local median 2.6% in North Brooksville — top-decile yield for the area; either an underpriced asset or a hidden risk that comps aren't pricing in. Stress-test before assuming the spread holds.
Location & tenants
- Location reads 65/100 on livability (#661 in FL) — a middle-class / working-renter tenant base. Strengths: crime A+, cost of living A+, housing A+; Watch: health & safety C-, employment D, amenities F.
- Hernando (suburban): math 50% / reading 50% proficiency, ranked #38 of 73 in FL (top 52%) — acceptable for families but not a draw, mixed tenant base, ~2y average lease.
- Zoned schools: Brooksville Elementary School (math 43% / reading 42%, grade F, #1,383 of 2,144 statewide, top 65%, 652 students, 68% FRL); D. S. Parrott Middle School (math 40% / reading 40%, grade F, #368 of 571 statewide, top 65%, 835 students, 67% FRL).
- Market conditions: Rents flat; 498 active listings in the ZIP; 5 comparable units currently listed for rent nearby; rentals at typical pace (median 26d on market — plan ~3-4 weeks tenant-placement turnaround); 2,505 units permitted in Hernando County in 2024 (318 in 5+ unit buildings).
Forward outlook
- Local home prices are declining (-3.0%/yr); year-one equity from $622 of loan paydown is wiped out by about $3k of value loss. Plan a longer hold.
- Hernando County population projected at +11% by 2050 — modest demand growth; plan on rents tracking national, not racing it.
- At projected returns (-3.0% appreciation + 0.2% rent growth), your $25k cash investment doubles in ~9 years — after that, you're playing with house money.
Negotiation context
- Only 4 days on market — expect competitive offers; lowballing is unlikely to land.
- 2 sale attempts with the ask held roughly flat each time — persistent listings suggest the price (not the market) is what's stuck; bring a comps-based counter.
- Current owner paid $16k; list at $90k implies a 448% gain — meaningful room to come down on a strong offer.
Risks & watch-outs
- Climate carrying-cost: severe wind risk, 99% chance of damaging wind over 30y; extreme-heat days projected 7→25/yr by 2055 (HVAC capex compounding) — expect insurance premiums to compound above CPI over the hold.
Questions for the listing agent
- Built in 1960 — when were the roof, HVAC, electrical panel, plumbing, and water heater last replaced?
- Is there a deadline driving the sale (1031 exchange, divorce, estate, relocation)? That informs how much negotiation room exists.
- Schools are F-rated, which usually means shorter tenancies and higher turnover. Who's the typical renter profile here, and what's been the actual vacancy rate?
- What's the average days-on-market for RENTAL listings here right now (not sales)? A rising rental-DOM trend means longer vacancies and softer asking-rent achievability than the comps imply.
- What's the recent tenant-quality profile in this submarket — average credit score on applications, eviction rate, late-payment / NSF rate, and stable-employment percentage? A property-management company in the area should have these aggregated.
- How much new for-sale + rental construction is in the pipeline within 1–3 miles? Heavy new supply typically softens prices + rents 12–24 months out; constrained supply supports both.
Investment metrics
- 1% rule
- 1.39% ✓
- Cap rate
- 11.35%
- Cash-on-cash
- 18.07%
- DSCR
- 1.80
- GRM
- 6.0
CMA / ARV
- ARV (on-the-fly)
- $153,888
- Comps found
- 7
Show comp detail 7 sales within ~0.75 mi
| Address | Dist | Beds/Ba | Sqft | Sold | Price | $/sf | Match |
|---|---|---|---|---|---|---|---|
| 20099 Oakdale Ave | 0.10mi | 3/1.0 (+1) | 768 (+14%) | 8mo | $176,000 | $229 | 60 |
| 327 Palm Ln | 0.40mi | 2/1.0 | 708 (+5%) | 16mo | $213,800 | $302 | 59 |
| 9229 West St | 0.37mi | 2/1.0 | 644 (-4%) | 23mo | $65,000 | $101 | 57 |
| 9157 West St | 0.35mi | 2/1.0 | 720 (+7%) | 18mo | $165,000 | $229 | 57 |
| 20098 Wildwood Dr | 0.17mi | 2/1.0 | 768 (+14%) | 18mo | $136,000 | $177 | 53 |
| 19455 Fort Dade Ave | 0.31mi | 2/1.0 | 768 (+14%) | 12mo | $212,000 | $276 | 52 |
| 9025 Gronde Ave | 0.48mi | 2/2.0 | 720 (+7%) | 13mo | $165,000 | $229 | 51 |
Match score weights: distance 35% · size 25% · config 20% · recency 20%. Top-matched comps best support the ARV.
Projected returns pro-forma
-3.0% appreciation · 0.19% rent growth · sell at horizon
- IRR
- 6.5%
- Equity multiple
- 1.24×
- Total profit
- $6,133
- Equity at exit
- $13,404
- IRR
- 13.2%
- Equity multiple
- 1.92×
- Total profit
- $23,096
- Equity at exit
- $7,773
Cash invested: $25,172 (down + closing). Projections, not guarantees.
Landlord ↔ Tenant lean methodology
- Overall (STATE)
- 87 Strongly Landlord-Friendly
- State Florida
- 87 Strongly Landlord-Friendly · R+3
- County
- — inherits STATE
- City
- — inherits STATE
ZIP-level market 34601
- Home prices YoY
- -29.7%
- Rents YoY
- 0.2%
- Active inventory
- 498
- Price-to-rent
- 6.0×
Monthly cashflow live
- Estimated rent
- $1,254 high interval (Pro) →
- Mortgage (P&I)
- −$471
- Tax from tax record
- −$103 /mo · $1,234/yr
- Insurance
- −$37
- HOA
- −$0
- Vacancy / Maint / Mgmt
- −$263
- Net cashflow
- $379
Break-even live
Sensitivity live
| Price | -10% $430 | -5% $404 | +0% $379 | +5% $354 | +10% $328 |
|---|---|---|---|---|---|
| Rent | -10% $280 | -5% $329 | +0% $379 | +5% $429 | +10% $478 |
| Rate | -1.0pp $424 | -0.5pp $402 | base $379 | +0.5pp $356 | +1.0pp $332 |
UW: 25.0% down · 7.5% · 30yr · 1.5% tax · 5.0% vac · 8.0% maint · 8.0% mgmt
Financing live
Cash to close
- Down payment
- $22,475
- Closing costs
- $2,697
- Reserves months
- —
- Total cash needed
- —
Loan-product check · same deal, 3 products live
Conventional
25% down · 7.5% · 30yr
- Down + closing
- —
- Monthly P&I
- —
- Monthly cashflow
- —
- DSCR
- —
- Eligible?
- —
Personal DTI + credit; lowest rate.
DSCR
20% down · 8.5% · 30yr
- Down + closing
- —
- Monthly P&I
- —
- Monthly cashflow
- —
- DSCR
- —
- Eligible?
- —
No personal income docs; deal must DSCR.
Hard money
10% down · 12.0% · 12mo
- Down + closing
- —
- Monthly P&I
- —
- Monthly cashflow
- —
- DSCR
- —
- Eligible?
- —
Short-term bridge; refi at stabilization.
Rent comps 5 comps
| Address | Beds | Baths | Sqft | Rent | $/sqft | DOM | Units | Dist |
|---|---|---|---|---|---|---|---|---|
| 925 Ponce de Leon Blvd Brooksville, FL | 1.0–3.0 | 1.0–2.0 | 700 | $1,136 | $1.62 | 26d | 5 | 0.48mi |
| 460 Hale Ave Brooksville, FL | 1.0–2.0 | 1.0 | 767 | $1,225 | $1.60 | 7d | 2 | 0.96mi |
| 965 Candlelight Blvd Brooksville, FL | 1.0–2.0 | 1.0–2.0 | 720 | $1,330 | $1.85 | 1d | 10 | 1.10mi |
| 217 Oakland Ave Unit 217 Brooksville, FL | 1.0 | 1.0 | 506 | $1,250 | $2.47 | 26d | 1 | 1.13mi |
| 203 D St Brooksville, FL | 3.0 | 1.0 | 748 | $1,600 | $2.14 | 26d | 1 | 1.48mi |
Listing history 6 events
-
2026-05-11status Pending
-
2026-05-07$89,900 Active
-
2026-05-05$89,900 Active
-
2026-05-05historical
-
1995-04-11soldstatus $16,400
-
1991-04-01soldstatus $23,500
ⓘ Source: listings_history table (triggers on properties + properties_extension) + one-shot
backfill from property_details.listing_events for pre-trigger history.
Tax reassessment forecast FL · Resets to sale price
- Current annual tax
- $1,234 · $103/mo
- Projected year-2 tax
- $1,234 · $103/mo
- Expected delta
- $0/yr ($0/mo · 0.0%)
ⓘ Screening estimate from a state-policy table — verify with the county assessor before closing.
Climate risk First Street
- Flood 1/10 Low FEMA zone X (unshaded) · 0% chance over 30 yrs
- Wildfire 4/10 Moderate
- Heat 9/10 Extreme 7 d/yr ≥109°F today · 25 d/yr by 30 yrs out
- Wind 9/10 Extreme 99% chance of damaging wind over 30 yrs
- Air quality 2/10 Low 1 unhealthy d/yr today · 1 by 30 yrs out
Nearby sold comps map
Loading sold comps map…
Walkable amenities ~0.75 mi
Loading nearby amenities…
Taxation est. · year 1
- Rental income
- $15,048
- − Mortgage interest
- −$5,036
- − Property taxes
- −$1,234
- − Insurance
- −$450
- − Repairs & maintenance
- −$1,204
- − Management
- −$1,204
- − Depreciation
- −$2,615
- Taxable income
- $3,306
- Est. tax owed @ 24.0%
- −$794
- After-tax cash flow
- $3,754/yr
For passive investors: Depreciation is non-cash, so a rental often shows a tax loss while cash-flowing — sheltering income. Rental losses are passive: they offset passive income freely, and up to $25,000/yr can offset ordinary (W-2) income if you actively participate and your MAGI is under $100k (phasing out to $0 by $150k); unused losses carry forward. On sale, claimed depreciation is recaptured at up to 25%, and gains may owe capital-gains tax (a 1031 exchange can defer both). Figures are a year-1 estimate at your 24.0% rate — not tax advice; consult a CPA.
Schools (NCES district)
- District
- Hernando
- NCES district ID
- 1200810
- Math proficiency
- 50% ▼ -8.00%
- Reading proficiency
- 50% ▼ -4.00%
- Median HH income
- $41,985
- Composite
- 42.03/100
- National rank
- #3329
- State rank
- #38 of 73 in FL
Livability — North Brooksville
- Score
- 65/100
- State rank
- #661
- US rank
- #13315
Category grades
Schools grade is shown separately in the Schools card above.
Census & demographics
- Census place
- North Brooksville, FL
- County
- Hernando County · 169,677 people
- City population
- 23,648
- Metro
- Tampa-St. Petersburg-Clearwater, FL
- Population (ZIP)
- 24,115
- Household income
- $60,440
- Rent vs Own
- Severe rent burden
- 664.0
Population outlook (Hernando County) Hauer SSP2
- Today (2025)
- 189,218 people
- By 2030
- 194,367 · +2.7%
- By 2040
- 203,398 · +7.5%
- By 2050
- 209,589 · +10.8%
- By 2075
- 218,452 · +15.4%
- By 2100
- 205,923 · +8.8%
Race, ethnicity, and origin ACS 2023
- Neighborhood character
- Predominantly White (77%)
- Race & ethnicity
- White 77% Hispanic / Latino 11% Black 8% Two or more races 5%
- Hispanic origin (detail)
- Puerto Rican 4% Cuban 2% Dominican 1%
- Common ancestry
- Slovak 4% Romanian 2% Iranian 2%
- Foreign-born
- 4% · Canada, Jamaica
- Languages at home
- 93% English-only · Spanish 6%
Political lean MEDSL · Hernando
- 2024 margin
- Solid R (+37.0) · D 31.1% · R 68.2%
- 2008→2024 swing
- -33.5pp toward R · 2008: -3.6pp · 2024: -37.0pp
- All cycles
- 2024: R+37.0 2020: R+30.2 2016: R+29.0 2012: R+8.5 2008: R+3.6
Not yet ingested
- Civics
- —
Market trends
- HPI YoY
- ▼ -132.68%
- Current HPI
- 313.4695
- Rent YoY
- ▲ 0.19%
- Metro
- Tampa-St. Petersburg-Clearwater, FL
- State GDP YoY
- ▲ 3.28%
- F500 in state
- 36
Industry mix (Fortune 500 HQ in FL)
| Industry | F500 HQs | Revenue |
|---|---|---|
| Industrial Technology | 2 | $29B |
|
||
| Insurance | 2 | $17B |
|
||
| Retail | 1 | $60B |
|
||
| Technology Distribution | 1 | $58B |
|
||
| Homebuilding | 1 | $35B |
|
||
| Technology Manufacturing | 1 | $35B |
|
||
Price history
+282.6% since first listed6 events — show timeline
- 2026-05-11 Pending — Stellar MLS as Distributed by MLS Grid
- 2026-05-07 Listed $89,900 Stellar MLS as Distributed by MLS Grid
- 2026-05-05 Listing Removed — HCAR
- 2026-05-05 Listed $89,900 HCAR
- 1995-04-11 Sold (Public Records) $16,400 Public Records
- 1991-04-01 Sold (Public Records) $23,500 Public Records
Property tax history
+7.6%/yrLatest (2025): $1,234 · +2.2% YoY. Source: county tax records.
Cash-flow waterfall
monthlySold comps — $/sqft
last 12 mo · ≤1 miLoading sold comps…