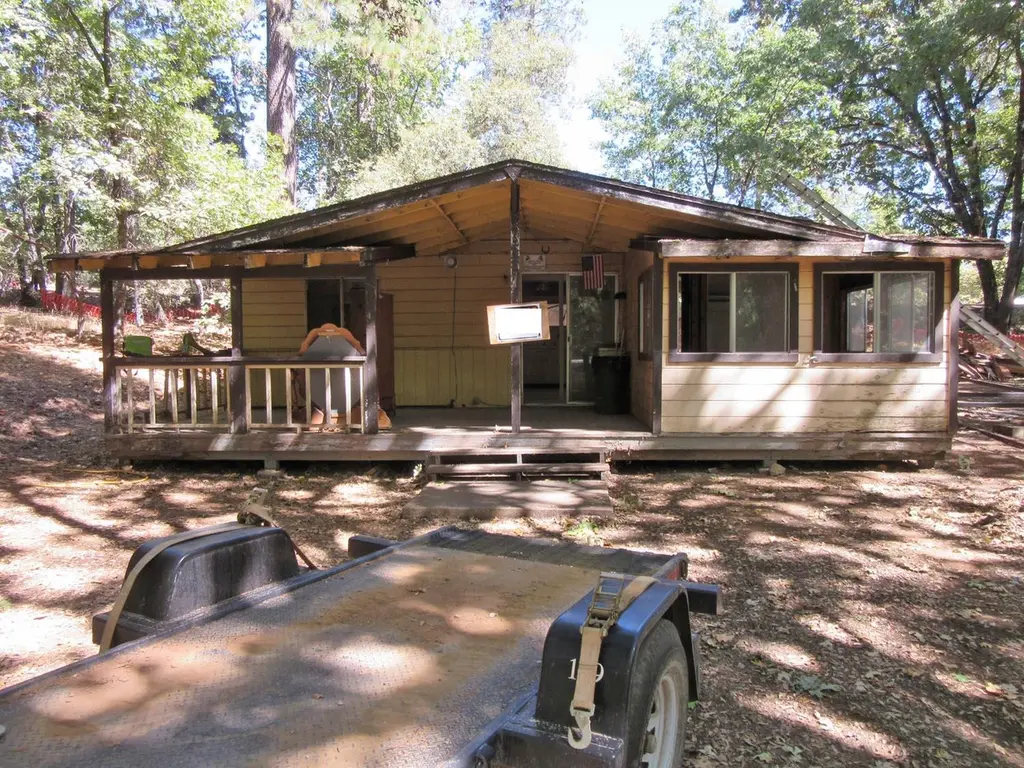
23555 Highway 26 · West Point, CA
Flood risk 1/10 · Minimal
- FEMA flood zone
- X (unshaded)
- Chance of flooding over 30 yrs
- 0.0%
- Est. flood insurance / yr
- $507 – $1,088
Fire risk 7/10 · Major
- Est. fire insurance / yr
- $659 – $1,223
Heat risk 5/10 · Moderate
- Hot days now (above 98°F)
- 6 days/yr
- Hot days in 30 yrs
- 14 days/yr
Wind risk 1/10 · Minimal
- Chance of severe wind over 30 yrs
- —
Air-quality risk 10/10 · Severe
- Unhealthy air days now
- 24 days/yr
- Unhealthy air days in 30 yrs
- 29 days/yr
Risk factors via First Street. Map © Google.
Why this score? — see what drove the D+ grade
The composite is a weighted blend of 9 inputs, each scored 0–100. Each bar is that input's sub-score; the figure is the points it added to the 100-point composite (weight × sub-score).
- ARV discount +15.0/15.0
- Cash flow +12.2/30.0
- Appreciation +5.5/10.0
- 1% rule +3.9/10.0
- DSCR +3.6/10.0
- Rent growth +2.5/5.0
- Condition / age +2.5/5.0
- Livability +2.1/5.0
- Schools +2.0/10.0
$131,100
🖨 Deal sheet (PDF) 📄 Offer letter ✓ Due diligence
Listing remarks
1.42 acre residential lot adjacent to Hwy 26. Small two bedroom cottage and detached garage/storage building have minimal value. Sloped lot, electric and communications to property. Plenty of room for new home and vehicle parking. Motivated Seller!!
Key facts
- Adjacent to hwy 26
- Residential lot
- Sloped lot
Tags
Neighborhood map
What this means for you Summary
Snapshot
- This is a 1-bed/1.0-bath single-family listed at $131k.
Deal economics
- At list price, monthly cash flow is $-27 ($-318/yr) — negative.
- To cash-flow at today's rent, offer at most $126k (3.6% below list).
- To meet the 1% rule (rent ≥ 1% of price), the offer needs to be $117k (10.7% below list).
- Recommended offer: $115k (12.0% below list) — sets the bar for market timing.
Location & tenants
- Location reads 41/100 on livability (#1,375 in CA) — a working-class tenant base; expect higher turnover. Strengths: crime A, cost of living B; Watch: amenities F, commute F, employment F.
- Calaveras Unified (rural): math 16% / reading 28% proficiency, ranked #436 of 517 in CA (top 84%) — low school quality limits family demand, transient renter base, plan for 1-2y turnover.
- Zoned schools: West Point Elementary (math 24% / reading 34%, grade F, #856 of 1,571 statewide, top 57%, 121 students, 69% FRL); Toyon Middle (math 14% / reading 29%, grade F, #400 of 498 statewide, top 82%, 531 students, 46% FRL); Calaveras High (math 27% / reading 52%, grade F, #532 of 1,170 statewide, top 48%, 746 students, 36% FRL) — zoned schools at 50% FRL track the district average.
- Market conditions: 37 active listings in the ZIP; 77 units permitted in Calaveras County in 2024 (0 in 5+ unit buildings).
Forward outlook
- In year one you build about $2k of equity ($906 loan paydown + $1k appreciation (1.1% local appreciation)).
- Calaveras County population projected at -18% by 2050 — secular population decline; favor cash flow + early exit over multi-decade hold.
- At projected returns (1.1% appreciation + 3.0% rent growth), your $37k cash investment doubles in ~10 years — after that, you're playing with house money.
Negotiation context
- It's been on market 235 days — a 12% lower offer ($115k) is reasonable based on typical stale-listing flexibility.
Risks & watch-outs
- Climate carrying-cost: major wildfire risk; extreme-heat days projected 6→14/yr by 2055 (HVAC capex compounding) — expect insurance premiums to compound above CPI over the hold.
Questions for the listing agent
- What do current leases actually rent for vs. the listed asking? Can we see a recent rent roll and the last 12 months of T-12 income?
- It's been on market 235 days. Have you received any prior offers? Is the seller open to a 12% concession, seller financing, or rate buy-down credit?
- Built in 1967 — when were the roof, HVAC, electrical panel, plumbing, and water heater last replaced?
- Why hasn't it sold? Are there any deal-killer items the seller is aware of (foundation, flood, title, zoning, code violations)?
- Is there a deadline driving the sale (1031 exchange, divorce, estate, relocation)? That informs how much negotiation room exists.
- Schools are F-rated, which usually means shorter tenancies and higher turnover. Who's the typical renter profile here, and what's been the actual vacancy rate?
- The area grade is low — what's the realistic commute time and amenity access for the typical tenant pool here? Any planned neighborhood developments (good or bad) we should know about?
- What's the average days-on-market for RENTAL listings here right now (not sales)? A rising rental-DOM trend means longer vacancies and softer asking-rent achievability than the comps imply.
- What's the recent tenant-quality profile in this submarket — average credit score on applications, eviction rate, late-payment / NSF rate, and stable-employment percentage? A property-management company in the area should have these aggregated.
- How much new for-sale + rental construction is in the pipeline within 1–3 miles? Heavy new supply typically softens prices + rents 12–24 months out; constrained supply supports both.
Investment metrics
- 1% rule
- 0.89% ✗
- Cap rate
- 6.05%
- Cash-on-cash
- -0.87%
- DSCR
- 0.96
- GRM
- 9.3
CMA / ARV
- ARV (median comp)
- $165,000
- List price
- $131,100
- Delta
- -20.55%
- Verdict
- UNDERPRICED
- Comps
- 3 within 1.0 mi
Projected returns pro-forma
1.07% appreciation · 3.0% rent growth · sell at horizon
- IRR
- 0.7%
- Equity multiple
- 1.03×
- Total profit
- $1,242
- Equity at exit
- $45,216
- IRR
- 5.4%
- Equity multiple
- 1.66×
- Total profit
- $24,245
- Equity at exit
- $60,446
Cash invested: $36,708 (down + closing). Projections, not guarantees.
Landlord ↔ Tenant lean methodology
- Overall (STATE)
- 18 Strongly Tenant-Friendly
- State California
- 18 Strongly Tenant-Friendly · D+13
- County
- — inherits STATE
- City
- — inherits STATE
ZIP-level market 95255
- Home prices YoY
- 0.5%
- Active inventory
- 37
- Price-to-rent
- 9.3×
Monthly cashflow live
- Estimated rent
- $1,170 medium interval (Pro) →
- Mortgage (P&I)
- −$688
- Tax from tax record
- −$209 /mo · $2,507/yr
- Insurance
- −$55
- HOA
- −$0
- Vacancy / Maint / Mgmt
- −$246
- Net cashflow
- $-27
Break-even live
Sensitivity live
| Price | -10% $48 | -5% $11 | +0% $-27 | +5% $-64 | +10% $-101 |
|---|---|---|---|---|---|
| Rent | -10% $-119 | -5% $-73 | +0% $-27 | +5% $20 | +10% $66 |
| Rate | -1.0pp $40 | -0.5pp $7 | base $-27 | +0.5pp $-60 | +1.0pp $-95 |
UW: 25.0% down · 7.5% · 30yr · 1.5% tax · 5.0% vac · 8.0% maint · 8.0% mgmt
Financing live
Cash to close
- Down payment
- $32,775
- Closing costs
- $3,933
- Reserves months
- —
- Total cash needed
- —
Loan-product check · same deal, 3 products live
Conventional
25% down · 7.5% · 30yr
- Down + closing
- —
- Monthly P&I
- —
- Monthly cashflow
- —
- DSCR
- —
- Eligible?
- —
Personal DTI + credit; lowest rate.
DSCR
20% down · 8.5% · 30yr
- Down + closing
- —
- Monthly P&I
- —
- Monthly cashflow
- —
- DSCR
- —
- Eligible?
- —
No personal income docs; deal must DSCR.
Hard money
10% down · 12.0% · 12mo
- Down + closing
- —
- Monthly P&I
- —
- Monthly cashflow
- —
- DSCR
- —
- Eligible?
- —
Short-term bridge; refi at stabilization.
Listing history 8 events
-
2026-06-21days on market $131,100 Active 235 DOM
-
2026-06-19days on market $131,100 Active 233 DOM
-
2026-06-18days on market $131,100 Active 232 DOM
-
2026-06-17days on market $131,100 Active 231 DOM
-
2026-06-17price $131,100 Active 230 DOM
-
2026-06-16days on market $138,000 Active 230 DOM
-
2026-06-15pricestatus $138,000 Active 229 DOM
-
2006-10-06soldstatus $180,000
ⓘ Source: listings_history table (triggers on properties + properties_extension) + one-shot
backfill from property_details.listing_events for pre-trigger history.
Tax reassessment forecast CA · Resets to sale price
- Current annual tax
- $2,507 · $209/mo
- Projected year-2 tax
- $2,507 · $209/mo
- Expected delta
- $0/yr ($0/mo · 0.0%)
ⓘ Screening estimate from a state-policy table — verify with the county assessor before closing.
Climate risk First Street
- Flood 1/10 Low FEMA zone X (unshaded) · 0% chance over 30 yrs
- Wildfire 7/10 Severe
- Heat 5/10 Major 6 d/yr ≥98°F today · 14 d/yr by 30 yrs out
- Wind 1/10 Low
- Air quality 10/10 Extreme 24 unhealthy d/yr today · 29 by 30 yrs out
Nearby sold comps map
Loading sold comps map…
Walkable amenities ~0.75 mi
Loading nearby amenities…
Taxation est. · year 1
- Rental income
- $14,043
- − Mortgage interest
- −$7,344
- − Property taxes
- −$2,507
- − Insurance
- −$656
- − Repairs & maintenance
- −$1,123
- − Management
- −$1,123
- − Depreciation
- −$3,814
- Taxable loss
- −$2,523
- Est. tax savings @ 24.0%
- +$606
- After-tax cash flow
- $288/yr
For passive investors: Depreciation is non-cash, so a rental often shows a tax loss while cash-flowing — sheltering income. Rental losses are passive: they offset passive income freely, and up to $25,000/yr can offset ordinary (W-2) income if you actively participate and your MAGI is under $100k (phasing out to $0 by $150k); unused losses carry forward. On sale, claimed depreciation is recaptured at up to 25%, and gains may owe capital-gains tax (a 1031 exchange can defer both). Figures are a year-1 estimate at your 24.0% rate — not tax advice; consult a CPA.
Schools (NCES district)
- District
- Calaveras Unified
- NCES district ID
- 0606870
- Math proficiency
- 16% ▼ -10.00%
- Reading proficiency
- 28% ▼ -8.00%
- Median HH income
- $55,559
- Composite
- 20.06/100
- National rank
- #8654
- State rank
- #436 of 517 in CA
Livability — West Point
- Score
- 41/100
- State rank
- #1375
- US rank
- #27138
Category grades
Schools grade is shown separately in the Schools card above.
Census & demographics
- Census place
- West Point, CA
- Population (ZIP)
- 1,755
Population outlook (Calaveras County) Hauer SSP2
- Today (2025)
- 43,163 people
- By 2030
- 41,703 · -3.4%
- By 2040
- 38,202 · -11.5%
- By 2050
- 35,385 · -18.0%
- By 2075
- 30,807 · -28.6%
- By 2100
- 25,755 · -40.3%
Race, ethnicity, and origin ACS 2023
- Neighborhood character
- Diverse neighborhood (Simpson 0.61)
- Race & ethnicity
- White 57% Two or more races 30% Hispanic / Latino 24% Native American 7%
- Hispanic origin (detail)
- Mexican 8% Puerto Rican 2%
- Common ancestry
- Lithuanian 6% Serbian 2% Greek 1%
- Languages at home
- 96% English-only · Spanish 1%
Political lean MEDSL · Calaveras
- 2024 margin
- Strong R (+28.1) · D 34.7% · R 62.8% · Other 2.5%
- 2008→2024 swing
- -15.2pp toward R · 2008: -13.0pp · 2024: -28.1pp
- All cycles
- 2024: R+28.1 2020: R+23.8 2016: R+23.9 2012: R+17.0 2008: R+13.0
Not yet ingested
- Civics
- —
Market trends
- HPI YoY
- ▲ 1.07%
- Current HPI
- 210.0766
- Rent YoY
- —
- Metro
- —
- State GDP YoY
- ▲ 3.21%
- F500 in state
- 116
Industry mix (Fortune 500 HQ in CA)
| Industry | F500 HQs | Revenue |
|---|---|---|
| Technology | 27 | $1,492B |
|
||
| Financial Services | 3 | $174B |
|
||
| Retail | 3 | $44B |
|
||
| Insurance | 3 | $26B |
|
||
| Media / Entertainment | 2 | $115B |
|
||
| Pharmaceuticals / Biotech | 2 | $62B |
|
||
Price history
1 event — show timeline
- 2006-10-06 Sold (Public Records) $180,000 Public Records
Property tax history
+9.0%/yrLatest (2025): $2,507 · -1.4% YoY. Source: county tax records.
Cash-flow waterfall
monthlySold comps — $/sqft
last 12 mo · ≤1 miLoading sold comps…