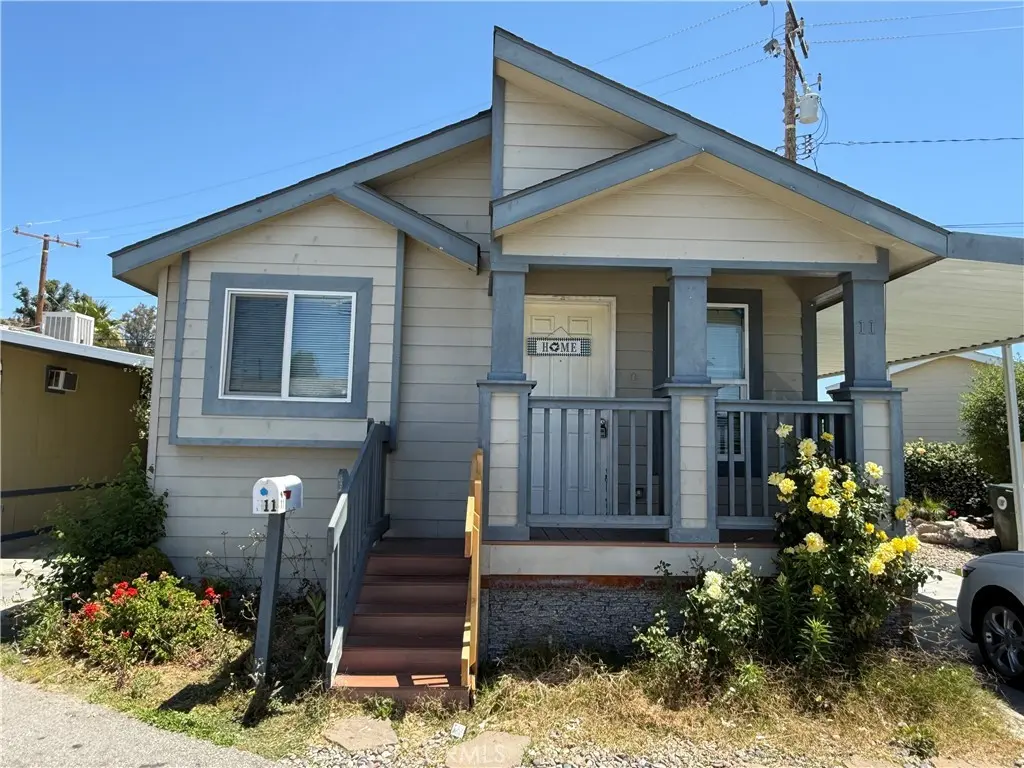
18035 Soledad Canyon Rd #11 · Santa Clarita, CA
Flood risk 1/10 · Minimal
- FEMA flood zone
- X (unshaded)
- Chance of flooding over 30 yrs
- 0.0%
- Est. flood insurance / yr
- $507 – $1,088
Fire risk 8/10 · Major
- Est. fire insurance / yr
- $659 – $1,223
Heat risk 7/10 · Major
- Hot days now (above 98°F)
- 7 days/yr
- Hot days in 30 yrs
- 20 days/yr
Wind risk 1/10 · Minimal
- Chance of severe wind over 30 yrs
- —
Air-quality risk 8/10 · Major
- Unhealthy air days now
- 18 days/yr
- Unhealthy air days in 30 yrs
- 21 days/yr
Risk factors via First Street. Map © Google.
Why this score? — see what drove the B- grade
The composite is a weighted blend of 9 inputs, each scored 0–100. Each bar is that input's sub-score; the figure is the points it added to the 100-point composite (weight × sub-score).
- Cash flow +30.0/30.0
- 1% rule +10.0/10.0
- DSCR +10.0/10.0
- Schools +5.9/10.0
- Rent growth +3.5/5.0
- Livability +3.5/5.0
- ARV discount +3.1/15.0
- Condition / age +2.8/5.0
- Appreciation +0.0/10.0
$164,900
🖨 Deal sheet (PDF) 📄 Offer letter ✓ Due diligence
Listing remarks
Discover this cozy 2013 home. 2 bedrooms, 2 bathrooms. Approximately 880 living sq/ft. Kitchen equips with stove, dishwasher and hood vent. Carpet in 2 bedrooms. Recess lights in kitchen. Ceiling fans in living room and master bedroom. Big windows to welcome in natural lights. Shed and central AC included. Low monthly space rent of $1,400.
Key facts
- Community pool
- Built 2013
- Listed 29 days
Tags
Property features AI
Finance
- Other: Located on Soledad Canyon Rd between Solamint Rd and Galeton Rd
- HOA & community: Land lease of $1,400 per month (park)
Exterior
- Parking: Located in Caravilla park
- Utilities: Public sewer; District/Public water
- Home design: Mobile home remains on lot; Zero lot line
- Construction: Mobile home dimensions approximately 20' x 44'; Year built source: Builder; Double body type
- Exterior features: Community pool; Sidewalks
Interior
- Kitchen: Gas range; Dishwasher; Laminate countertops
- Bedrooms: All bedrooms on main floor; Main floor bedroom
- Flooring: Carpet
- Bathrooms: 2 full bathrooms; Shower in tub; Separate shower; Exhaust fan(s); Laminate counters in bathrooms
- Interior features: Ceiling fan; Front door entry
- Laundry & utility: Washer hookup; Gas dryer hookup
Neighborhood map
What this means for you Summary
Snapshot
- This is a 2-bed/2.0-bath manufactured listed at $165k. Condition is rated average.
Deal economics
- At list price, monthly cash flow is $1k ($13k/yr) — positive.
- The deal already cash-flows at list — no discount required.
- Meets the 1% rule at list price ($3k rent vs $165k).
- Recommended offer: $162k (1.5% below list) — sets the bar for market timing.
- Cap rate 14.2% vs local median 2.8% in Santa Clarita — top-decile yield for the area; either an underpriced asset or a hidden risk that comps aren't pricing in. Stress-test before assuming the spread holds.
Location & tenants
- Location reads 70/100 on livability (#229 in CA) — a middle-class / working-renter tenant base. Strengths: employment A+, housing A, crime A-; Watch: amenities D+, cost of living F, health & safety F.
- William S. Hart Union High (suburban): math 52% / reading 72% proficiency, ranked #155 of 1,400 in CA (top 11%) — acceptable for families but not a draw, mixed tenant base, ~2y average lease; only 18% free/reduced lunch — higher-income household profile.
- Market conditions: Rents rising (+3.8%/yr); 154 active listings in the ZIP; 27 comparable units currently listed for rent nearby; rentals leasing fast (median 0d on market — plan ~1-2 weeks tenant-placement turnaround); high-income renter base; 19,697 units permitted in Los Angeles County in 2024 (9,426 in 5+ unit buildings).
Forward outlook
- Local home prices are declining (-3.0%/yr); year-one equity from $1k of loan paydown is wiped out by about $5k of value loss. Plan a longer hold.
- Los Angeles County population projected at +9% by 2050 — modest demand growth; plan on rents tracking national, not racing it.
- At projected returns (-3.0% appreciation + 3.8% rent growth), your $46k cash investment doubles in ~5 years — after that, you're playing with house money.
Negotiation context
- It's been on market 29 days — a 2% lower offer ($162k) is reasonable based on typical stale-listing flexibility.
Risks & watch-outs
- Climate carrying-cost: severe wildfire risk; extreme-heat days projected 7→20/yr by 2055 (HVAC capex compounding) — expect insurance premiums to compound above CPI over the hold.
Questions for the listing agent
- Is there a deadline driving the sale (1031 exchange, divorce, estate, relocation)? That informs how much negotiation room exists.
- Schools are B-rated — typically a magnet for longer-tenancy family renters. What's the average tenant stay here, and is there a school-zone premium baked into asking?
- What's the average days-on-market for RENTAL listings here right now (not sales)? A rising rental-DOM trend means longer vacancies and softer asking-rent achievability than the comps imply.
- What's the recent tenant-quality profile in this submarket — average credit score on applications, eviction rate, late-payment / NSF rate, and stable-employment percentage? A property-management company in the area should have these aggregated.
- How much new for-sale + rental construction is in the pipeline within 1–3 miles? Heavy new supply typically softens prices + rents 12–24 months out; constrained supply supports both.
Investment metrics
- 1% rule
- 1.63% ✓
- Cap rate
- 14.24%
- Cash-on-cash
- 28.39%
- DSCR
- 2.26
- GRM
- 5.1
CMA / ARV
- ARV (on-the-fly)
- $150,360
- Comps found
- 12
Show comp detail 12 sales within ~0.75 mi
| Address | Dist | Beds/Ba | Sqft | Sold | Price | $/sf | Match |
|---|---|---|---|---|---|---|---|
| 18145 Soledad Canyon Rd #12 | 0.09mi | 2/1.0 | 850 (+1%) | 6mo | $180,000 | $212 | 84 |
| 18035 Soledad Canyon Rd #45 | 0.00mi | 3/1.0 (+1) | 878 (+4%) | 4mo | $134,500 | $153 | 80 |
| 18145 SOLEDAD CANYON Rd #54 | 0.07mi | 2/2.0 | 881 (+5%) | 12mo | $100,000 | $114 | 79 |
| 18035 Soledad Canyon Rd #81 | 0.00mi | 2/2.0 | 900 (+7%) | 14mo | $203,900 | $227 | 77 |
| 18323 Soledad Canyon Rd #36 | 0.26mi | 2/2.0 | 800 (-5%) | 13mo | $150,000 | $188 | 69 |
| 18145 Soledad Canyon Rd #15 | 0.09mi | 3/2.0 (+1) | 960 (+14%) | 0mo | $250,000 | $260 | 67 |
| 18035 Soledad Canyon Rd #49 | 0.00mi | 3/2.0 (+1) | 720 (-14%) | 12mo | $113,000 | $157 | 61 |
| 18540 Soledad Canyon Rd #10 | 0.63mi | 2/1.5 | 800 (-5%) | 0mo | $147,000 | $184 | 61 |
| 18323 Soledad Canyon Rd #5 | 0.26mi | 2/2.0 | 960 (+14%) | 9mo | $155,000 | $161 | 57 |
| 18204 Soledad Canyon Rd #53 | 0.19mi | 2/1.0 | 720 (-14%) | 22mo | $128,900 | $179 | 45 |
| 18540 Soledad Canyon Rd #69 | 0.63mi | 2/2.0 | 960 (+14%) | 8mo | $145,000 | $151 | 40 |
| 18540 Soledad Canyon Rd Spc 17 | 0.58mi | 3/1.0 (+1) | 720 (-14%) | 11mo | $84,990 | $118 | 31 |
Match score weights: distance 35% · size 25% · config 20% · recency 20%. Top-matched comps best support the ARV.
Projected returns pro-forma
-3.0% appreciation · 3.81% rent growth · sell at horizon
- IRR
- 23.5%
- Equity multiple
- 1.98×
- Total profit
- $45,028
- Equity at exit
- $24,587
- IRR
- 31.9%
- Equity multiple
- 3.99×
- Total profit
- $137,893
- Equity at exit
- $14,258
Cash invested: $46,172 (down + closing). Projections, not guarantees.
Landlord ↔ Tenant lean methodology
- Overall (STATE)
- 18 Strongly Tenant-Friendly
- State California
- 18 Strongly Tenant-Friendly · D+13
- County
- — inherits STATE
- City
- — inherits STATE
ZIP-level market 91387
- Rents YoY
- 3.8%
- Active inventory
- 154
- Price-to-rent
- 5.1×
Monthly cashflow live
- Estimated rent
- $2,687 high interval (Pro) →
- Mortgage (P&I)
- −$865
- Tax from tax record
- −$97 /mo · $1,167/yr
- Insurance
- −$69
- HOA
- −$0
- Vacancy / Maint / Mgmt
- −$564
- Net cashflow
- $1,092
Break-even live
Sensitivity live
| Price | -10% $1,186 | -5% $1,139 | +0% $1,092 | +5% $1,046 | +10% $999 |
|---|---|---|---|---|---|
| Rent | -10% $880 | -5% $986 | +0% $1,092 | +5% $1,198 | +10% $1,305 |
| Rate | -1.0pp $1,175 | -0.5pp $1,134 | base $1,092 | +0.5pp $1,050 | +1.0pp $1,006 |
UW: 25.0% down · 7.5% · 30yr · 1.5% tax · 5.0% vac · 8.0% maint · 8.0% mgmt
Financing live
Cash to close
- Down payment
- $41,225
- Closing costs
- $4,947
- Reserves months
- —
- Total cash needed
- —
Loan-product check · same deal, 3 products live
Conventional
25% down · 7.5% · 30yr
- Down + closing
- —
- Monthly P&I
- —
- Monthly cashflow
- —
- DSCR
- —
- Eligible?
- —
Personal DTI + credit; lowest rate.
DSCR
20% down · 8.5% · 30yr
- Down + closing
- —
- Monthly P&I
- —
- Monthly cashflow
- —
- DSCR
- —
- Eligible?
- —
No personal income docs; deal must DSCR.
Hard money
10% down · 12.0% · 12mo
- Down + closing
- —
- Monthly P&I
- —
- Monthly cashflow
- —
- DSCR
- —
- Eligible?
- —
Short-term bridge; refi at stabilization.
Rent comps 27 comps
| Address | Beds | Baths | Sqft | Rent | $/sqft | DOM | Units | Dist |
|---|---|---|---|---|---|---|---|---|
| 27940 Solamint Rd Canyon Country, CA | 1.0–2.0 | 1.0–2.0 | 859 | $3,974 | $4.62 | 0d | 5 | 0.20mi |
| 18008 Saratoga Way #513 Canyon Country, CA | 1.0 | 1.0 | 934 | $1,050 | $1.12 | 0d | 1 | 0.21mi |
| 18028 Saratoga Way #557 Canyon Country, CA | 2.0 | 2.0 | 843 | $2,900 | $3.44 | 0d | 1 | 0.25mi |
| 27944 Tyler Ln #448 Canyon Country, CA | 2.0 | 2.0 | 848 | $2,295 | $2.71 | 0d | 1 | 0.27mi |
| 28015 Sarabande Ln #1305 Canyon Country, CA | 2.0 | 2.0 | 844 | $1,795 | $2.13 | 0d | 1 | 0.36mi |
| 28015 Sarabande Ln Santa Clarita, CA | 2.0 | 2.0 | 885 | $2,850 | $3.22 | 0d | 1 | 0.36mi |
| 17621 Pauline Ct Canyon Country, CA | 2.0–3.0 | 2.5 | 1200 | $2,569 | $2.14 | 0d | 8 | 0.43mi |
| 18046 Beneda Ln Unit B203 Santa Clarita, CA | 1.0 | 1.0 | 756 | $1,900 | $2.51 | 11d | 1 | 0.46mi |
| 18209 Sierra Hwy #40 Canyon Country, CA | 2.0 | 2.0 | 795 | $2,350 | $2.96 | 0d | 1 | 0.48mi |
| 18209 Sierra Hwy #17 Canyon Country, CA | 2.0 | 2.0 | 795 | $2,500 | $3.14 | 11d | 1 | 0.48mi |
| 27303 Sara St Canyon Country, CA | 1.0–3.0 | 1.0–2.0 | 838 | $2,402 | $2.86 | 0d | 6 | 0.49mi |
| 18005 Annes Cir Canyon Country, CA | 1.0–3.0 | 1.0–2.5 | 979 | $2,954 | $3.02 | 0d | 10 | 0.49mi |
| 27520 Sierra Hwy Canyon Country, CA | 1.0–3.0 | 1.0–2.0 | 965 | $2,502 | $2.59 | 0d | 1 | 0.50mi |
| 17740 Scherzinger Ln Canyon Country, CA | 2.0 | 2.0 | 825 | $2,150 | $2.61 | 0d | 2 | 0.59mi |
| 17350 Humphreys Pkwy Canyon Country, CA | 1.0–3.0 | 1.0–2.0 | 1009 | $3,248 | $3.22 | 0d | 65 | 0.59mi |
| Jakes Way Santa Clarita, CA | 1.0–2.0 | 1.0–2.0 | 830 | $2,640 | $3.18 | 0d | 20 | 0.68mi |
| 18211 Flynn Dr #144 Canyon Country, CA | 2.0 | 2.0 | 1085 | $2,600 | $2.40 | 0d | 1 | 0.84mi |
| 17581 Scherzinger Ln Canyon Country, CA | 2.0 | 1.0 | 800 | $2,380 | $2.98 | 4d | 1 | 0.90mi |
| 18804 Mandan St #807 Canyon Country, CA | 2.0 | 2.0 | 860 | $2,600 | $3.02 | 0d | 1 | 0.93mi |
| 27105 Silver Oak Ln Canyon Country, CA | 1.0–3.0 | 1.0–2.0 | 1021 | $2,962 | $2.90 | 0d | 20 | 0.94mi |
| 27240 Luther Dr #509 Canyon Country, CA | 1.0 | 1.0 | 652 | $1,995 | $3.06 | 0d | 1 | 0.96mi |
| 17947 Lost Canyon Rd Canyon Country, CA | 2.0 | 2.0 | 1022 | $2,795 | $2.73 | 18d | 1 | 1.00mi |
| 18701 Flying Tiger Dr Canyon Country, CA | 2.0 | 1.0 | 656 | $2,105 | $3.21 | 0d | 1 | 1.00mi |
| 27070 Hidaway Ave #4 Canyon Country, CA | 2.0 | 1.5 | 1078 | $3,200 | $2.97 | 3d | 1 | 1.17mi |
| 19028 Drycliff St Unit C Canyon Country, CA | 3.0 | 1.5 | 982 | $3,600 | $3.67 | 3d | 1 | 1.19mi |
| 27077 Hidaway Ave Canyon Country, CA | 2.0 | 1.0 | 960 | $2,400 | $2.50 | 0d | 1 | 1.28mi |
| 27301 Whites Canyon Rd Canyon Country, CA | 2.0 | 2.0 | 900 | $1,995 | $2.22 | 18d | 2 | 1.44mi |
Listing history 16 events
-
2026-06-21status $164,900 Pending Sale 29 DOM
-
2026-06-18days on market $164,900 Active 29 DOM
-
2026-06-17days on market $164,900 Active 28 DOM
-
2026-06-16days on market $164,900 Active 27 DOM
-
2026-06-15days on market $164,900 Active 26 DOM
-
2026-06-13days on market $164,900 Active 24 DOM
-
2026-06-13days on market $164,900 Active 23 DOM
-
2026-06-09days on market $164,900 Active 20 DOM
-
2026-06-08days on market $164,900 Active 19 DOM
-
2026-06-07days on market $164,900 Active 18 DOM
-
2026-06-04days on market $164,900 Active 15 DOM
-
2026-06-03days on market $164,900 Active 14 DOM
-
2026-06-02days on market $164,900 Active 13 DOM
-
2026-06-01days on market $164,900 Active 12 DOM
-
2026-05-31days on market $164,900 Active 11 DOM
-
2026-05-20$164,900 Active
ⓘ Source: listings_history table (triggers on properties + properties_extension) + one-shot
backfill from property_details.listing_events for pre-trigger history.
Tax reassessment forecast CA · Resets to sale price
- Current annual tax
- $1,167 · $97/mo
- Projected year-2 tax
- $1,253 · $104/mo
- Expected delta
- +$86/yr (+$7/mo · 7.4%)
ⓘ Screening estimate from a state-policy table — verify with the county assessor before closing.
Climate risk First Street
- Flood 1/10 Low FEMA zone X (unshaded) · 0% chance over 30 yrs
- Wildfire 8/10 Severe
- Heat 7/10 Severe 7 d/yr ≥98°F today · 20 d/yr by 30 yrs out
- Wind 1/10 Low
- Air quality 8/10 Severe 18 unhealthy d/yr today · 21 by 30 yrs out
Nearby sold comps map
Loading sold comps map…
Walkable amenities ~0.75 mi
Loading nearby amenities…
Taxation est. · year 1
- Rental income
- $32,248
- − Mortgage interest
- −$9,237
- − Property taxes
- −$1,167
- − Insurance
- −$824
- − Repairs & maintenance
- −$2,580
- − Management
- −$2,580
- − Depreciation
- −$4,797
- Taxable income
- $11,063
- Est. tax owed @ 24.0%
- −$2,655
- After-tax cash flow
- $10,452/yr
For passive investors: Depreciation is non-cash, so a rental often shows a tax loss while cash-flowing — sheltering income. Rental losses are passive: they offset passive income freely, and up to $25,000/yr can offset ordinary (W-2) income if you actively participate and your MAGI is under $100k (phasing out to $0 by $150k); unused losses carry forward. On sale, claimed depreciation is recaptured at up to 25%, and gains may owe capital-gains tax (a 1031 exchange can defer both). Figures are a year-1 estimate at your 24.0% rate — not tax advice; consult a CPA.
Condition & rehab AI · 11 photos
This 2013 manufactured home offers a cozy living space with average condition. Minor repairs and updates to the interior and exterior can significantly enhance its value for both resale and rental.
Repairs flagged
- Minor kitchen cabinets — slight wear
- Minor bathroom vanity — slight wear
- Minor interior walls — paint wear
Value-add opportunities
- Both paint interior walls — enhances curb appeal and interior aesthetics
- Both replace carpet in bedrooms — improves comfort and appearance
- Both update kitchen cabinets — modernizes the space and increases value
Renovation cost estimate screening
| Repair item | Severity | Est. cost |
|---|---|---|
| kitchen cabinets · slight wear | Minor | $500–3,000 |
| bathroom vanity · slight wear | Minor | $500–3,000 |
| interior walls · paint wear | Minor | $500–3,000 |
| Total estimated repair cost · 3 items | $1,500–9,000 |
Value-add ROI direction
- Both paint interior walls — enhances curb appeal and interior aesthetics ↑
- Both replace carpet in bedrooms — improves comfort and appearance ↑
- Both update kitchen cabinets — modernizes the space and increases value ↑
ⓘ Cost ranges are severity-bucket heuristics (US national rule-of-thumb). Get contractor quotes + a written scope before underwriting a rehab budget.
Schools (NCES district)
- District
- William S. Hart Union High
- NCES district ID
- 0642510
- Math proficiency
- 52% ▬ 0.00%
- Reading proficiency
- 72% ▲ 1.00%
- Median HH income
- $95,844
- Composite
- 58.6/100
- National rank
- #2030
- State rank
- #155 of 1400 in CA
Livability — Santa Clarita
- Score
- 70/100
- State rank
- #229
- US rank
- #7378
Category grades
Schools grade is shown separately in the Schools card above.
Census & demographics
- Census place
- Santa Clarita, CA
- County
- Los Angeles County · 9,444,647 people
- City population
- 219,066
- Metro
- Los Angeles-Long Beach-Anaheim, CA
- Population (ZIP)
- 46,869
- Household income
- $117,969
- Rent vs Own
- Severe rent burden
- 1332.0
Population outlook (Los Angeles County) Hauer SSP2
- Today (2025)
- 10,940,515 people
- By 2030
- 11,256,481 · +2.9%
- By 2040
- 11,729,929 · +7.2%
- By 2050
- 11,948,407 · +9.2%
- By 2075
- 11,818,114 · +8.0%
- By 2100
- 10,842,928 · -0.9%
Race, ethnicity, and origin ACS 2023
- Neighborhood character
- Diverse neighborhood (Simpson 0.67)
- Race & ethnicity
- Hispanic / Latino 43% White 36% Two or more races 20% Asian 10% Black 6% Native American 1%
- Hispanic origin (detail)
- Mexican 29%
- Common ancestry
- Italian 2% Romanian 1% Lithuanian 1%
- Foreign-born
- 24% · Canada, South Korea, Vietnam
- Languages at home
- 58% English-only · Spanish 30% Tagalog/Filipino 3% Other Indo-European 3%
Political lean MEDSL · Los Angeles
- 2024 margin
- Solid D (+32.9) · D 64.8% · R 31.9% · Other 3.3%
- 2008→2024 swing
- -7.4pp toward R · 2008: 40.4pp · 2024: 32.9pp
- All cycles
- 2024: D+32.9 2020: D+44.2 2016: D+48.0 2012: D+40.0 2008: D+40.4
Not yet ingested
- Civics
- —
Market trends
- HPI YoY
- ▼ -441.37%
- Current HPI
- 322.2238
- Rent YoY
- ▲ 3.81%
- Metro
- Los Angeles-Long Beach-Anaheim, CA
- State GDP YoY
- ▲ 3.21%
- F500 in state
- 116
Industry mix (Fortune 500 HQ in CA)
| Industry | F500 HQs | Revenue |
|---|---|---|
| Technology | 27 | $1,492B |
|
||
| Financial Services | 3 | $174B |
|
||
| Retail | 3 | $44B |
|
||
| Insurance | 3 | $26B |
|
||
| Media / Entertainment | 2 | $115B |
|
||
| Pharmaceuticals / Biotech | 2 | $62B |
|
||
Price history
1 event — show timeline
- 2026-05-20 Listed $164,900 CRMLS
Property tax history
+1.4%/yrLatest (2025): $1,167 · +1.4% YoY. Source: county tax records.
Cash-flow waterfall
monthlySold comps — $/sqft
last 12 mo · ≤1 miLoading sold comps…