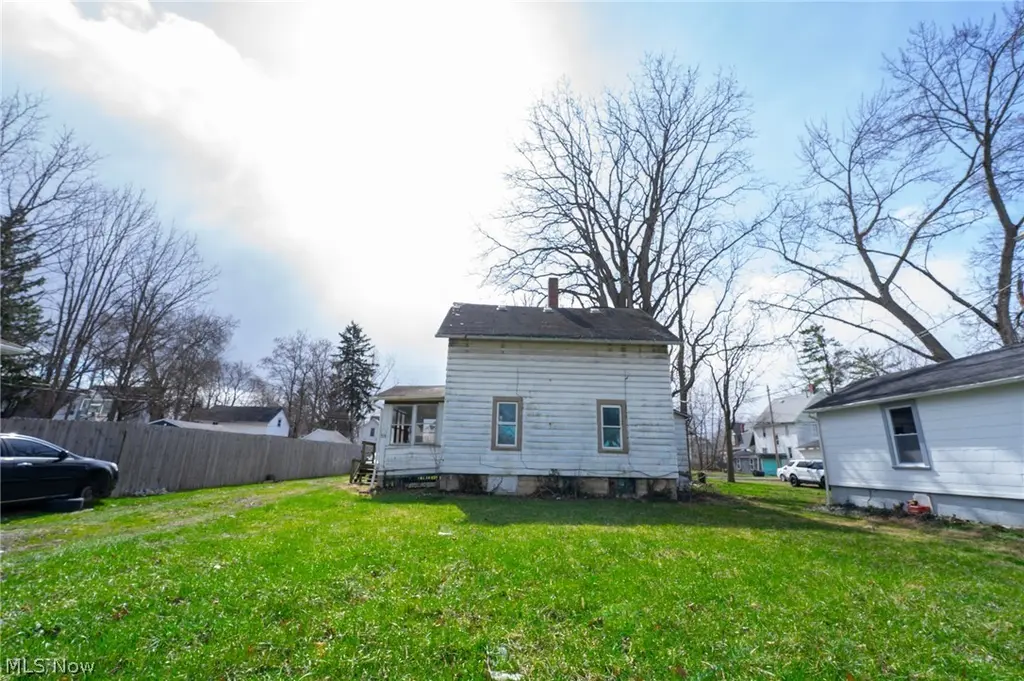
318 11th St · Elyria, OH
Flood risk 1/10 · Minimal
- FEMA flood zone
- X (unshaded)
- Chance of flooding over 30 yrs
- 0.0%
- Est. flood insurance / yr
- $473 – $860
Fire risk 1/10 · Minimal
- Est. fire insurance / yr
- $713 – $1,323
Heat risk 3/10 · Minor
- Hot days now (above 98°F)
- 7 days/yr
- Hot days in 30 yrs
- 16 days/yr
Wind risk 1/10 · Minimal
- Chance of severe wind over 30 yrs
- —
Air-quality risk 3/10 · Minor
- Unhealthy air days now
- 2 days/yr
- Unhealthy air days in 30 yrs
- 4 days/yr
Risk factors via First Street. Map © Google.
Why this score? — see what drove the B grade
The composite is a weighted blend of 9 inputs, each scored 0–100. Each bar is that input's sub-score; the figure is the points it added to the 100-point composite (weight × sub-score).
- Cash flow +30.0/30.0
- 1% rule +10.0/10.0
- DSCR +10.0/10.0
- ARV discount +7.5/15.0
- Rent growth +4.2/5.0
- Livability +3.8/5.0
- Condition / age +2.5/5.0
- Schools +2.4/10.0
- Appreciation +0.0/10.0
$53,000
🖨 Deal sheet (PDF) 📄 Offer letter ✓ Due diligence
Listing remarks
Fix-and-Flip Opportunity! This 3-bedroom, 1-bath home at 318 11th St in Elyria offers 1,164 sq ft and excellent value-add potential. Featuring a traditional layout with a spacious living area, dining space, and three nicely sized bedrooms, this property is ready for updates and improvements. Ideal for investors looking to renovate and build equity. Convenient location with easy access to Cleveland, Lake Erie, shopping, and major roadways. Property sold as-is. Cash or rehab financing recommended
Key facts
- Spacious living area
- Value-add potential
- Dining space
Tags
Property features AI
Exterior
- Parking: Garage with 1 car space; Alley access; Unpaved parking
- Home design: 2-story house; Asphalt/composition/fiberglass roof
- Construction: Built per public records; Aluminum siding construction
- Exterior features: Front porch; Aluminum siding
Interior
- Bathrooms: 1 full bathroom
- Interior features: Full basement; 6 total rooms
Neighborhood map
What this means for you Summary
Snapshot
- This is a 3-bed/1.0-bath single-family listed at $53k.
Deal economics
- At list price, monthly cash flow is $394 ($5k/yr) — positive.
- The deal already cash-flows at list — no discount required.
- Meets the 1% rule at list price ($1k rent vs $53k).
- Recommended offer: $48k (9.0% below list) — sets the bar for market timing.
- Cap rate 15.2% vs local median 4.0% in Elyria — top-decile yield for the area; either an underpriced asset or a hidden risk that comps aren't pricing in. Stress-test before assuming the spread holds.
Location & tenants
- Location reads 75/100 on livability (#243 in OH, #3,869 nationally) — a middle-class / working-renter tenant base. Strengths: cost of living A+, housing A+, health & safety A; Watch: schools C-, employment D, commute F.
- Elyria City Schools (urban): math 21% / reading 37% proficiency, ranked #586 of 656 in OH (top 89%) — low school quality limits family demand, transient renter base, plan for 1-2y turnover.
- Market conditions: Rents rising fast (+6.7%/yr); 360 active listings in the ZIP; 7 comparable units currently listed for rent nearby; rentals at typical pace (median 16d on market — plan ~3-4 weeks tenant-placement turnaround); 1,098 units permitted in Lorain County in 2024 (20 in 5+ unit buildings).
Forward outlook
- Local home prices are declining (-3.0%/yr); year-one equity from $366 of loan paydown is wiped out by about $2k of value loss. Plan a longer hold.
- At projected returns (-3.0% appreciation + 6.7% rent growth), your $15k cash investment doubles in ~4 years — after that, you're playing with house money.
Negotiation context
- It's been on market 94 days — a 9% lower offer ($48k) is reasonable based on typical stale-listing flexibility.
- 5 sale attempts since 31y ago; this cycle's ask has dropped $5k (8%) from the opening price — seller is motivated, your offer sets the floor, not the list.
- Current owner paid $14k; list at $53k implies a 291% gain — meaningful room to come down on a strong offer.
Risks & watch-outs
- Watch-outs: built in 1900 — expect roof / HVAC / electrical / plumbing capex.
Questions for the listing agent
- It's been on market 94 days. Have you received any prior offers? Is the seller open to a 9% concession, seller financing, or rate buy-down credit?
- Built in 1900 — when were the roof, HVAC, electrical panel, plumbing, and water heater last replaced?
- Why hasn't it sold? Are there any deal-killer items the seller is aware of (foundation, flood, title, zoning, code violations)?
- Is there a deadline driving the sale (1031 exchange, divorce, estate, relocation)? That informs how much negotiation room exists.
- What's the average days-on-market for RENTAL listings here right now (not sales)? A rising rental-DOM trend means longer vacancies and softer asking-rent achievability than the comps imply.
- What's the recent tenant-quality profile in this submarket — average credit score on applications, eviction rate, late-payment / NSF rate, and stable-employment percentage? A property-management company in the area should have these aggregated.
- How much new for-sale + rental construction is in the pipeline within 1–3 miles? Heavy new supply typically softens prices + rents 12–24 months out; constrained supply supports both.
Investment metrics
- 1% rule
- 1.90% ✓
- Cap rate
- 15.22%
- Cash-on-cash
- 31.89%
- DSCR
- 2.42
- GRM
- 4.4
CMA / ARV
- ARV (on-the-fly)
- $133,860
- Comps found
- 12
Show comp detail 12 sales within ~0.75 mi
| Address | Dist | Beds/Ba | Sqft | Sold | Price | $/sf | Match |
|---|---|---|---|---|---|---|---|
| 1307 West Ave | 0.20mi | 3/1.5 | 1,192 (+2%) | 7mo | $137,500 | $115 | 78 |
| 426 11th St | 0.18mi | 4/1.5 (+1) | 1,147 (-2%) | 6mo | $152,000 | $133 | 77 |
| 210 E 15th St | 0.27mi | 3/1.5 | 1,117 (-4%) | 2mo | $130,000 | $116 | 77 |
| 334 16th St | 0.29mi | 2/1.0 (-1) | 1,216 (+4%) | 2mo | $89,000 | $73 | 72 |
| 241 8th St | 0.31mi | 2/1.0 (-1) | 1,104 (-5%) | 2mo | $90,000 | $82 | 71 |
| 227 7th St | 0.37mi | 3/1.0 | 1,202 (+3%) | 9mo | $71,500 | $59 | 69 |
| 1101 West Ave | 0.13mi | 3/2.0 | 1,306 (+12%) | 2mo | $168,000 | $129 | 68 |
| 238 George St | 0.13mi | 3/1.0 | 1,311 (+13%) | 7mo | $135,000 | $103 | 67 |
| 480 10th St | 0.32mi | 3/1.0 | 1,087 (-7%) | 9mo | $129,900 | $120 | 66 |
| 508 12th St | 0.25mi | 3/1.5 | 1,291 (+11%) | 3mo | $134,050 | $104 | 66 |
| 325 15th St | 0.20mi | 3/1.0 | 1,012 (-13%) | 7mo | $133,000 | $131 | 63 |
| 614 Mussey Ave | 0.59mi | 2/1.0 (-1) | 1,032 (-11%) | 3mo | $42,500 | $41 | 46 |
Match score weights: distance 35% · size 25% · config 20% · recency 20%. Top-matched comps best support the ARV.
Projected returns pro-forma
-3.0% appreciation · 6.74% rent growth · sell at horizon
- IRR
- 31.3%
- Equity multiple
- 2.38×
- Total profit
- $20,506
- Equity at exit
- $7,902
- IRR
- 40.5%
- Equity multiple
- 5.57×
- Total profit
- $67,798
- Equity at exit
- $4,582
Cash invested: $14,840 (down + closing). Projections, not guarantees.
Landlord ↔ Tenant lean methodology
- Overall (STATE)
- 73 Landlord-Friendly
- State Ohio
- 73 Landlord-Friendly · R+6
- County
- — inherits STATE
- City
- — inherits STATE
ZIP-level market 44035
- Rents YoY
- 6.7%
- Active inventory
- 360
- Price-to-rent
- 4.4×
Monthly cashflow live
- Estimated rent
- $1,008 high interval (Pro) →
- Mortgage (P&I)
- −$278
- Tax from tax record
- −$102 /mo · $1,222/yr
- Insurance
- −$22
- HOA
- −$0
- Vacancy / Maint / Mgmt
- −$212
- Net cashflow
- $394
Break-even live
Sensitivity live
| Price | -10% $424 | -5% $409 | +0% $394 | +5% $379 | +10% $364 |
|---|---|---|---|---|---|
| Rent | -10% $315 | -5% $355 | +0% $394 | +5% $434 | +10% $474 |
| Rate | -1.0pp $421 | -0.5pp $408 | base $394 | +0.5pp $381 | +1.0pp $367 |
UW: 25.0% down · 7.5% · 30yr · 1.5% tax · 5.0% vac · 8.0% maint · 8.0% mgmt
Financing live
Cash to close
- Down payment
- $13,250
- Closing costs
- $1,590
- Reserves months
- —
- Total cash needed
- —
Loan-product check · same deal, 3 products live
Conventional
25% down · 7.5% · 30yr
- Down + closing
- —
- Monthly P&I
- —
- Monthly cashflow
- —
- DSCR
- —
- Eligible?
- —
Personal DTI + credit; lowest rate.
DSCR
20% down · 8.5% · 30yr
- Down + closing
- —
- Monthly P&I
- —
- Monthly cashflow
- —
- DSCR
- —
- Eligible?
- —
No personal income docs; deal must DSCR.
Hard money
10% down · 12.0% · 12mo
- Down + closing
- —
- Monthly P&I
- —
- Monthly cashflow
- —
- DSCR
- —
- Eligible?
- —
Short-term bridge; refi at stabilization.
Rent comps 7 comps
| Address | Beds | Baths | Sqft | Rent | $/sqft | DOM | Units | Dist |
|---|---|---|---|---|---|---|---|---|
| 1309 Middle Ave Elyria, OH | 2.0 | 1.0 | 1000 | $795 | $0.80 | 44d | 1 | 0.17mi |
| 116 Water St Elyria, OH | 2.0 | 1.0 | 888 | $1,100 | $1.24 | 24d | 1 | 0.84mi |
| 334 Washington Ave Unit 102F Elyria, OH | 2.0 | 1.0 | 750 | $895 | $1.19 | 22d | 1 | 1.18mi |
| 10425 Middle Ave Elyria, OH | 3.0–4.0 | 2.0 | 1424 | $1,209 | $0.85 | 2d | 1 | 1.19mi |
| 138 Mendel Ct #1 Elyria, OH | 2.0 | 1.0 | 700 | $750 | $1.07 | 15d | 1 | 1.41mi |
| 780 Oberlin Elyria Rd Apt 4 Elyria, OH | 2.0 | 1.0 | 850 | $975 | $1.15 | 2d | 1 | 1.46mi |
| 129 Park Meadow Ln Elyria, OH | 1.0–2.0 | 1.0 | 729 | $1,179 | $1.62 | 2d | 1 | 1.48mi |
Listing history 27 events
-
2026-06-21days on market $53,000 Active 94 DOM
-
2026-06-18days on market $53,000 Active 91 DOM
-
2026-06-17days on market $53,000 Active 90 DOM
-
2026-06-16days on market $53,000 Active 89 DOM
-
2026-06-15days on market $53,000 Active 88 DOM
-
2026-06-13days on market $53,000 Active 86 DOM
-
2026-06-13days on market $53,000 Active 85 DOM
-
2026-06-09days on market $53,000 Active 82 DOM
-
2026-06-08days on market $53,000 Active 81 DOM
-
2026-06-07days on market $53,000 Active 80 DOM
-
2026-06-03days on market $53,000 Active 76 DOM
-
2026-06-02days on market $53,000 Active 75 DOM
-
2026-06-01days on market $53,000 Active 74 DOM
-
2026-05-31days on market $53,000 Active 73 DOM
-
2026-04-13price $53,000
-
2026-03-18$57,700 Active
-
2026-02-27historical
-
2026-02-17price $58,500
-
2026-01-19price $65,000
-
2026-01-15status Active
-
2025-12-04status Pending
-
2025-10-29$68,500 Active
-
2000-10-25historical
-
2000-04-25$55,000
-
1996-03-03historical
-
1995-10-03$55,000
-
1988-05-11soldstatus $13,550
ⓘ Source: listings_history table (triggers on properties + properties_extension) + one-shot
backfill from property_details.listing_events for pre-trigger history.
Tax reassessment forecast OH · Partial reset (capped growth)
- Current annual tax
- $1,222 · $102/mo
- Projected year-2 tax
- $1,222 · $102/mo
- Expected delta
- $0/yr ($0/mo · 0.0%)
ⓘ Screening estimate from a state-policy table — verify with the county assessor before closing.
Climate risk First Street
- Flood 1/10 Low FEMA zone X (unshaded) · 0% chance over 30 yrs
- Wildfire 1/10 Low
- Heat 3/10 Moderate 7 d/yr ≥98°F today · 16 d/yr by 30 yrs out
- Wind 1/10 Low
- Air quality 3/10 Moderate 2 unhealthy d/yr today · 4 by 30 yrs out
Nearby sold comps map
Loading sold comps map…
Walkable amenities ~0.75 mi
Loading nearby amenities…
Taxation est. · year 1
- Rental income
- $12,096
- − Mortgage interest
- −$2,969
- − Property taxes
- −$1,222
- − Insurance
- −$265
- − Repairs & maintenance
- −$968
- − Management
- −$968
- − Depreciation
- −$1,542
- Taxable income
- $4,163
- Est. tax owed @ 24.0%
- −$999
- After-tax cash flow
- $3,734/yr
For passive investors: Depreciation is non-cash, so a rental often shows a tax loss while cash-flowing — sheltering income. Rental losses are passive: they offset passive income freely, and up to $25,000/yr can offset ordinary (W-2) income if you actively participate and your MAGI is under $100k (phasing out to $0 by $150k); unused losses carry forward. On sale, claimed depreciation is recaptured at up to 25%, and gains may owe capital-gains tax (a 1031 exchange can defer both). Figures are a year-1 estimate at your 24.0% rate — not tax advice; consult a CPA.
Schools (NCES district)
- District
- Elyria City Schools
- NCES district ID
- 3904394
- Math proficiency
- 21% ▼ -25.00%
- Reading proficiency
- 37% ▼ -15.00%
- Median HH income
- $40,992
- Composite
- 24.45/100
- National rank
- #7670
- State rank
- #586 of 656 in OH
Livability — Elyria
- Score
- 75/100
- State rank
- #243
- US rank
- #3869
Category grades
Schools grade is shown separately in the Schools card above.
Census & demographics
- Census place
- Elyria, OH
- County
- Lorain County · 219,437 people
- City population
- 62,179
- Metro
- Cleveland-Elyria, OH
- Population (ZIP)
- 62,179
- Household income
- $56,408
- Rent vs Own
- Severe rent burden
- 2229.0
Population outlook (Lorain County) Hauer SSP2
- Today (2025)
- 314,924 people
- By 2030
- 317,546 · +0.8%
- By 2040
- 317,962 · +1.0%
- By 2050
- 312,872 · -0.7%
- By 2075
- 301,806 · -4.2%
- By 2100
- 278,271 · -11.6%
Race, ethnicity, and origin ACS 2023
- Neighborhood character
- Predominantly White (70%)
- Race & ethnicity
- White 70% Two or more races 12% Black 11% Hispanic / Latino 10% Asian 1%
- Hispanic origin (detail)
- Mexican 2% Puerto Rican 6%
- Common ancestry
- Romanian 5% Slovak 2% Lithuanian 2%
- Foreign-born
- 2% · China, Canada
- Languages at home
- 94% English-only · Spanish 4% Chinese 1%
Political lean MEDSL · Lorain
- 2024 margin
- Lean R (+5.7) · D 46.7% · R 52.4%
- 2008→2024 swing
- -23.6pp toward R · 2008: 17.9pp · 2024: -5.7pp
- All cycles
- 2024: R+5.7 2020: R+2.5 2016: R+0.3 2012: D+14.4 2008: D+17.9
Not yet ingested
- Civics
- —
Market trends
- HPI YoY
- ▼ -139.09%
- Current HPI
- 199.7354
- Rent YoY
- ▲ 6.74%
- Metro
- Cleveland-Elyria, OH
- State GDP YoY
- ▲ 1.98%
- F500 in state
- 48
Industry mix (Fortune 500 HQ in OH)
| Industry | F500 HQs | Revenue |
|---|---|---|
| Insurance | 3 | $145B |
|
||
| Industrial Machinery | 3 | $49B |
|
||
| Financial Services | 3 | $24B |
|
||
| Consumer Goods | 2 | $93B |
|
||
| Aerospace / Defense | 2 | $47B |
|
||
| Utilities | 2 | $33B |
|
||
Price history
+291.1% since first listed13 events — show timeline
- 2026-04-13 Price Changed $53,000 MLSNOW
- 2026-03-18 Listed $57,700 MLSNOW
- 2026-02-27 Listing Removed — MLSNOW
- 2026-02-17 Price Changed $58,500 MLSNOW
- 2026-01-19 Price Changed $65,000 MLSNOW
- 2026-01-15 Relisted — MLSNOW
- 2025-12-04 Pending — MLSNOW
- 2025-10-29 Listed $68,500 MLSNOW
- 2000-10-25 Listing Removed — MLSNOW
- 2000-04-25 Listed $55,000 MLSNOW
- 1996-03-03 Listing Removed — MLSNOW
- 1995-10-03 Listed $55,000 MLSNOW
- 1988-05-11 Sold (Public Records) $13,550 Public Records
Property tax history
+0.1%/yrLatest (2025): $1,222 · +2.0% YoY. Source: county tax records.
Cash-flow waterfall
monthlySold comps — $/sqft
last 12 mo · ≤1 miLoading sold comps…