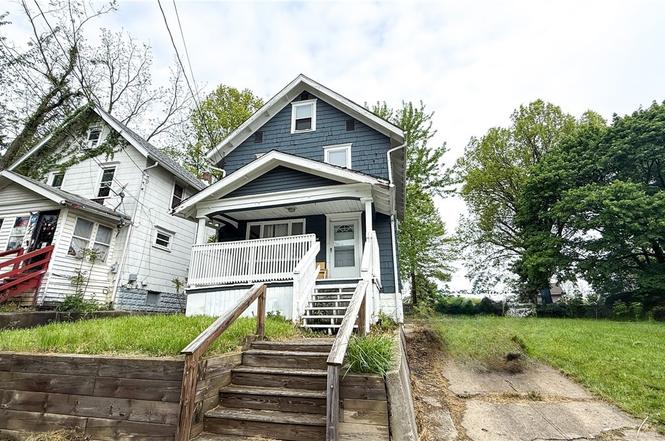
987 Boone St · Akron, OH
Flood risk 1/10 · Minimal
- FEMA flood zone
- X (unshaded)
- Chance of flooding over 30 yrs
- 0.0%
- Est. flood insurance / yr
- $473 – $860
Fire risk 1/10 · Minimal
- Est. fire insurance / yr
- $713 – $1,323
Heat risk 3/10 · Minor
- Hot days now (above 97°F)
- 7 days/yr
- Hot days in 30 yrs
- 16 days/yr
Wind risk 1/10 · Minimal
- Chance of severe wind over 30 yrs
- —
Air-quality risk 3/10 · Minor
- Unhealthy air days now
- 2 days/yr
- Unhealthy air days in 30 yrs
- 4 days/yr
Risk factors via First Street. Map © Google.
Why this score? — see what drove the B- grade
The composite is a weighted blend of 9 inputs, each scored 0–100. Each bar is that input's sub-score; the figure is the points it added to the 100-point composite (weight × sub-score).
- Cash flow +30.0/30.0
- DSCR +10.0/10.0
- 1% rule +8.6/10.0
- ARV discount +6.1/15.0
- Rent growth +4.4/5.0
- Livability +4.0/5.0
- Condition / age +2.5/5.0
- Schools +2.1/10.0
- Appreciation +0.0/10.0
$84,900
🖨 Deal sheet (PDF) 📄 Offer letter ✓ Due diligence
Listing remarks
This colonial home has so much to offer with the right vision. Enjoy the front porch as you overlook the active cul-de-sac, or enjoy the private back deck that overlooks the backyard. The front porch is an inviting welcome to friends and family as they enter the home into the spacious living area and dining area. The recent kitchen (remodeled a few years ago) has newer countertops, nice cupboards, and cabinets offering plenty of room to prepare meals in the kitchen. The owner has provided an oven/range and a refrigerator that will stay. The back door off the kitchen gives easy access to the oversized back deck. The upstairs has a spacious full bath with a new tub surround. The three bedroom
Key facts
- Newer countertops
- Private back deck
- Oversized back deck
Tags
Property features AI
Finance
- Financial info: Annual taxes listed
Exterior
- Parking: Driveway
- Utilities: Public water; Public sewer
- Home design: Shake siding; Asphalt roof
- Construction: Built per public records; Shake siding construction; Asphalt roof
- Exterior features: Deck; Front porch
Interior
- Kitchen: Range; Refrigerator
- Bedrooms: Total of 8 rooms (includes bedrooms and living areas)
- Bathrooms: 1 full bathroom
- Heating & cooling: Forced air heating; Gas heating
- Interior features: Full basement
- Laundry & utility: Laundry located in basement
Neighborhood map
What this means for you Summary
Snapshot
- This is a 3-bed/1.0-bath single-family listed at $85k.
Deal economics
- At list price, monthly cash flow is $338 ($4k/yr) — positive.
- The deal already cash-flows at list — no discount required.
- Meets the 1% rule at list price ($1k rent vs $85k).
- Cap rate 11.1% vs local median 6.6% in Akron — top-decile yield for the area; either an underpriced asset or a hidden risk that comps aren't pricing in. Stress-test before assuming the spread holds.
Location & tenants
- Location reads 81/100 on livability (#104 in OH, #1,591 nationally) — a professional / high-income tenant draw. Strengths: amenities A+, commute A+, cost of living A+; Watch: crime F, employment F.
- Akron City (urban): math 22% / reading 30% proficiency, ranked #602 of 656 in OH (top 92%) — low school quality limits family demand, transient renter base, plan for 1-2y turnover; 66% free/reduced lunch — lower-income household profile, screen leases tightly.
- Zoned schools: Mason Community Learning Center (math 27% / reading 22%, grade F, #1,217 of 1,584 statewide, top 78%, 280 students, 0% FRL); National Inventors Hall of Fame School Center For Stem (math 45% / reading 56%, grade C, #413 of 654 statewide, top 63%, 406 students, 0% FRL); Akron Early College High School (math 62% / reading 98%, grade A, #34 of 781 statewide, top 4%, 377 students, 0% FRL) — zoned schools average 0% FRL vs 66% district-wide (66 pts lower); this property's tenant base skews higher-income than the district average.
- Zoned-school proficiency averages 52% at this address vs 26% district-wide (+26 pts) — the actual schools serving this property are materially stronger than the Akron City average implies; a family-tenant draw the district grade alone would hide.
- Market conditions: Rents rising fast (+7.6%/yr); 71 active listings in the ZIP; 40 comparable units currently listed for rent nearby; rentals at typical pace (median 25d on market — plan ~3-4 weeks tenant-placement turnaround); 45% of comp listings sitting > 30 days — soft ceiling on asking rent; lower-income renter base — watch delinquency; 1,114 units permitted in Summit County in 2024 (397 in 5+ unit buildings).
- This rent runs 33% of the median local income ($42k/yr) — at the standard rent-burdened threshold; future hikes will face affordability resistance.
Forward outlook
- Local home prices are declining (-3.0%/yr); year-one equity from $587 of loan paydown is wiped out by about $3k of value loss. Plan a longer hold.
- Summit County population projected to shrink 6% by 2050 — rents likely to lag national; underwrite the cash flow, not the appreciation.
- At projected returns (-3.0% appreciation + 7.6% rent growth), your $24k cash investment doubles in ~6 years — after that, you're playing with house money.
Negotiation context
- Only 3 days on market — expect competitive offers; lowballing is unlikely to land.
- 12 sale attempts since 33y ago with the ask held roughly flat each time — persistent listings suggest the price (not the market) is what's stuck; bring a comps-based counter.
- Current owner paid $8k; list at $85k implies a 899% gain — meaningful room to come down on a strong offer.
Risks & watch-outs
- Watch-outs: built in 1917 — expect roof / HVAC / electrical / plumbing capex.
Questions for the listing agent
- Built in 1917 — when were the roof, HVAC, electrical panel, plumbing, and water heater last replaced?
- Is there a deadline driving the sale (1031 exchange, divorce, estate, relocation)? That informs how much negotiation room exists.
- Crime grade is F in this area — have there been break-ins, vandalism, or insurance claims at this property in the last 3 years? What carrier currently insures it and at what premium?
- What's the average days-on-market for RENTAL listings here right now (not sales)? A rising rental-DOM trend means longer vacancies and softer asking-rent achievability than the comps imply.
- What's the recent tenant-quality profile in this submarket — average credit score on applications, eviction rate, late-payment / NSF rate, and stable-employment percentage? A property-management company in the area should have these aggregated.
- How much new for-sale + rental construction is in the pipeline within 1–3 miles? Heavy new supply typically softens prices + rents 12–24 months out; constrained supply supports both.
Investment metrics
- 1% rule
- 1.36% ✓
- Cap rate
- 11.08%
- Cash-on-cash
- 17.08%
- DSCR
- 1.76
- GRM
- 6.1
CMA / ARV
- ARV (on-the-fly)
- $82,368
- Comps found
- 12
Show comp detail 12 sales within ~0.75 mi
| Address | Dist | Beds/Ba | Sqft | Sold | Price | $/sf | Match |
|---|---|---|---|---|---|---|---|
| 495 Elbon Ave | 0.52mi | 3/1.0 | 1,267 (+2%) | 4mo | $75,000 | $59 | 70 |
| 591 Hedden Ave | 0.71mi | 3/1.0 | 1,224 (-2%) | 2mo | $63,500 | $52 | 62 |
| 863 Bank St | 0.72mi | 3/1.0 | 1,226 (-2%) | 6mo | $82,000 | $67 | 59 |
| 70 Wise St | 0.66mi | 3/1.0 | 1,197 (-4%) | 5mo | $80,000 | $67 | 58 |
| 906 E Buchtel Ave | 0.62mi | 3/1.0 | 1,372 (+10%) | 2mo | $22,000 | $16 | 53 |
| 1214 Laird St | 0.72mi | 4/1.0 (+1) | 1,284 (+3%) | 6mo | $85,000 | $66 | 52 |
| 522 Winans Ave | 0.65mi | 3/1.0 | 1,373 (+10%) | 5mo | $95,000 | $69 | 49 |
| 508 Crouse St | 0.57mi | 4/2.0 (+1) | 1,370 (+10%) | 2mo | $62,500 | $46 | 47 |
| 990 Baird St | 0.74mi | 3/1.0 | 1,140 (-9%) | 6mo | $88,000 | $77 | 46 |
| 109 Kent Ct | 0.49mi | 2/1.0 (-1) | 1,075 (-14%) | 8mo | $37,500 | $35 | 43 |
| 642 Gridley Ave | 0.67mi | 4/2.0 (+1) | 1,399 (+12%) | 5mo | $45,000 | $32 | 36 |
| 1172 5th Ave | 0.61mi | 4/2.5 (+1) | 1,428 (+14%) | 1mo | $233,000 | $163 | 35 |
Match score weights: distance 35% · size 25% · config 20% · recency 20%. Top-matched comps best support the ARV.
Projected returns pro-forma
-3.0% appreciation · 7.63% rent growth · sell at horizon
- IRR
- 13.4%
- Equity multiple
- 1.56×
- Total profit
- $13,417
- Equity at exit
- $12,659
- IRR
- 25.5%
- Equity multiple
- 3.73×
- Total profit
- $64,812
- Equity at exit
- $7,341
Cash invested: $23,772 (down + closing). Projections, not guarantees.
Landlord ↔ Tenant lean methodology
- Overall (STATE)
- 73 Landlord-Friendly
- State Ohio
- 73 Landlord-Friendly · R+6
- County
- — inherits STATE
- City
- — inherits STATE
ZIP-level market 44306
- Rents YoY
- 7.6%
- Active inventory
- 71
- Price-to-rent
- 6.1×
Monthly cashflow live
- Estimated rent
- $1,151 high interval (Pro) →
- Mortgage (P&I)
- −$445
- Tax from tax record
- −$90 /mo · $1,082/yr
- Insurance
- −$35
- HOA
- −$0
- Vacancy / Maint / Mgmt
- −$242
- Net cashflow
- $338
Break-even live
Sensitivity live
| Price | -10% $386 | -5% $362 | +0% $338 | +5% $314 | +10% $290 |
|---|---|---|---|---|---|
| Rent | -10% $248 | -5% $293 | +0% $338 | +5% $384 | +10% $429 |
| Rate | -1.0pp $381 | -0.5pp $360 | base $338 | +0.5pp $316 | +1.0pp $294 |
UW: 25.0% down · 7.5% · 30yr · 1.5% tax · 5.0% vac · 8.0% maint · 8.0% mgmt
Financing live
Cash to close
- Down payment
- $21,225
- Closing costs
- $2,547
- Reserves months
- —
- Total cash needed
- —
Loan-product check · same deal, 3 products live
Conventional
25% down · 7.5% · 30yr
- Down + closing
- —
- Monthly P&I
- —
- Monthly cashflow
- —
- DSCR
- —
- Eligible?
- —
Personal DTI + credit; lowest rate.
DSCR
20% down · 8.5% · 30yr
- Down + closing
- —
- Monthly P&I
- —
- Monthly cashflow
- —
- DSCR
- —
- Eligible?
- —
No personal income docs; deal must DSCR.
Hard money
10% down · 12.0% · 12mo
- Down + closing
- —
- Monthly P&I
- —
- Monthly cashflow
- —
- DSCR
- —
- Eligible?
- —
Short-term bridge; refi at stabilization.
Rent comps 40 comps
| Address | Beds | Baths | Sqft | Rent | $/sqft | DOM | Units | Dist |
|---|---|---|---|---|---|---|---|---|
| 987 Boone St Akron, OH | 3.0 | 1.0 | 1248 | $1,100 | $0.88 | 25d | 1 | 0.04mi |
| 801 E Exchange St Akron, OH | 2.0 | 1.0 | 850 | $925 | $1.09 | 25d | 1 | 0.16mi |
| 783 E Exchange St Unit 2nd Akron, OH | 2.0 | 1.0 | 951 | $875 | $0.92 | 25d | 1 | 0.18mi |
| 1071 Ackley St Akron, OH | 4.0 | 2.0 | 1164 | $1,175 | $1.01 | 45d | 1 | 0.21mi |
| 878 Clark St Akron, OH | 3.0 | 2.0 | 1029 | $1,440 | $1.40 | 45d | 1 | 0.32mi |
| 166 Chittenden St Akron, OH | 3.0 | 1.0 | 1020 | $985 | $0.97 | 45d | 1 | 0.34mi |
| 167 Chittenden St Apt 2 Akron, OH | 2.0 | 1.0 | 900 | $825 | $0.92 | 45d | 1 | 0.36mi |
| 167 Chittenden St #1 Akron, OH | 2.0 | 1.0 | 900 | $850 | $0.94 | 45d | 1 | 0.37mi |
| 344 Lease St Akron, OH | 3.0 | 1.0 | 1000 | $1,199 | $1.20 | 45d | 1 | 0.38mi |
| 797 E Market St Apt 220 Akron, OH | 2.0 | 1.5 | 1100 | $1,500 | $1.36 | 25d | 1 | 0.39mi |
| 1125 2nd Ave Akron, OH | 3.0 | 1.0 | 1373 | $1,100 | $0.80 | 25d | 1 | 0.42mi |
| 77 Kent Ct Akron, OH | 4.0 | 1.0 | 1300 | $1,200 | $0.92 | 45d | 1 | 0.44mi |
| 109 Kent Ct Akron, OH | 2.0 | 1.0 | 1032 | $1,142 | $1.11 | 25d | 1 | 0.45mi |
| 377 Talbot Ave Akron, OH | 2.0 | 1.0 | 1070 | $1,050 | $0.98 | 45d | 1 | 0.50mi |
| 846 Lee Dr Akron, OH | 4.0 | 1.0 | 1433 | $1,325 | $0.92 | 15d | 1 | 0.51mi |
| 846 Lee Dr Akron, OH | 4.0 | 1.5 | 1433 | $1,325 | $0.92 | 25d | 1 | 0.51mi |
| 134 N Arlington St Akron, OH | 2.0 | 1.0 | 964 | $900 | $0.93 | 25d | 1 | 0.51mi |
| 484 Hammel St Akron, OH | 2.0 | 1.0 | 792 | $1,100 | $1.39 | 45d | 1 | 0.55mi |
| 605 E Buchtel Ave Unit 1 Akron, OH | 2.0 | 1.0 | 1000 | $695 | $0.69 | 15d | 1 | 0.62mi |
| 1182 5th Ave Akron, OH | 3.0 | 1.0 | 1248 | $1,250 | $1.00 | 15d | 1 | 0.63mi |
| 545 E Buchtel Ave Unit 1 Akron, OH | 2.0 | 1.0 | 900 | $1,300 | $1.44 | 45d | 1 | 0.68mi |
| 490 Gage St Akron, OH | 4.0 | 1.0 | 1326 | $1,053 | $0.79 | 45d | 1 | 0.68mi |
| 467 Spicer St Akron, OH | 2.0 | 1.0 | 800 | $915 | $1.14 | 25d | 1 | 0.70mi |
| 461 Spicer St Akron, OH | 3.0 | 2.0 | 1000 | $995 | $0.99 | 45d | 1 | 0.71mi |
| 488 Alexander St Akron, OH | 4.0 | 2.0 | 1311 | $1,350 | $1.03 | 25d | 1 | 0.72mi |
| 621 Hudson Ave Akron, OH | 3.0 | 1.0 | 780 | $1,100 | $1.41 | 15d | 1 | 0.73mi |
| 990 Baird St Akron, OH | 3.0 | 1.0 | 1140 | $1,250 | $1.10 | 45d | 1 | 0.78mi |
| 420 Power St Akron, OH | 3.0 | 1.0 | 900 | $800 | $0.89 | 25d | 1 | 0.78mi |
| 418 Power St Akron, OH | 3.0 | 1.0 | 1000 | $999 | $1.00 | 25d | 1 | 0.78mi |
| 548 Spicer St Akron, OH | 4.0 | 2.0 | 1487 | $1,100 | $0.74 | 25d | 1 | 0.79mi |
| 208 Barder Ave Akron, OH | 3.0 | 1.0 | 924 | $1,050 | $1.14 | 45d | 1 | 0.81mi |
| 208 Denver St Akron, OH | 3.0 | 1.0 | 1248 | $895 | $0.72 | 45d | 1 | 0.89mi |
| 356 Rankin St Akron, OH | 4.0 | 1.5 | 1186 | $1,197 | $1.01 | 25d | 1 | 0.90mi |
| 1113 Smithfarm Ave Akron, OH | 3.0 | 2.0 | 1296 | $1,600 | $1.23 | 25d | 1 | 0.92mi |
| 393 Cross St Unit 393 Akron, OH | 2.0 | 1.0 | 864 | $775 | $0.90 | 45d | 1 | 0.94mi |
| 288 Kryder Ave Akron, OH | 4.0 | 1.0 | 1400 | $1,450 | $1.04 | 45d | 1 | 0.96mi |
| 1297 Pondview Ave Akron, OH | 4.0 | 1.0 | 1373 | $1,450 | $1.06 | 25d | 1 | 0.96mi |
| 287 Wheeler St Akron, OH | 3.0 | 1.0 | 1100 | $1,350 | $1.23 | 25d | 1 | 0.96mi |
| 237 Kryder Ave Unit 237 Akron, OH | 2.0 | 1.0 | 860 | $850 | $0.99 | 46d | 1 | 0.97mi |
| 689 Kling St Akron, OH | 3.0 | 1.0 | 780 | $1,075 | $1.38 | 22d | 1 | 0.98mi |
Listing history 3 events
-
2026-06-21days on market $84,900 Active 3 DOM
-
2026-06-19remarks 699-char remark
-
2026-06-19$84,900 Active 1 DOM
ⓘ Source: listings_history table (triggers on properties + properties_extension) + one-shot
backfill from property_details.listing_events for pre-trigger history.
Tax reassessment forecast OH · Partial reset (capped growth)
- Current annual tax
- $1,082 · $90/mo
- Projected year-2 tax
- $1,203 · $100/mo
- Expected delta
- +$121/yr (+$10/mo · 11.2%)
ⓘ Screening estimate from a state-policy table — verify with the county assessor before closing.
Climate risk First Street
- Flood 1/10 Low FEMA zone X (unshaded) · 0% chance over 30 yrs
- Wildfire 1/10 Low
- Heat 3/10 Moderate 7 d/yr ≥97°F today · 16 d/yr by 30 yrs out
- Wind 1/10 Low
- Air quality 3/10 Moderate 2 unhealthy d/yr today · 4 by 30 yrs out
Nearby sold comps map
Loading sold comps map…
Walkable amenities ~0.75 mi
Loading nearby amenities…
Taxation est. · year 1
- Rental income
- $13,811
- − Mortgage interest
- −$4,756
- − Property taxes
- −$1,082
- − Insurance
- −$424
- − Repairs & maintenance
- −$1,105
- − Management
- −$1,105
- − Depreciation
- −$2,470
- Taxable income
- $2,869
- Est. tax owed @ 24.0%
- −$689
- After-tax cash flow
- $3,373/yr
For passive investors: Depreciation is non-cash, so a rental often shows a tax loss while cash-flowing — sheltering income. Rental losses are passive: they offset passive income freely, and up to $25,000/yr can offset ordinary (W-2) income if you actively participate and your MAGI is under $100k (phasing out to $0 by $150k); unused losses carry forward. On sale, claimed depreciation is recaptured at up to 25%, and gains may owe capital-gains tax (a 1031 exchange can defer both). Figures are a year-1 estimate at your 24.0% rate — not tax advice; consult a CPA.
Schools (NCES district)
- District
- Akron City
- NCES district ID
- 3904348
- Math proficiency
- 22% ▼ -17.00%
- Reading proficiency
- 30% ▼ -12.00%
- Median HH income
- $33,811
- Composite
- 21.31/100
- National rank
- #8383
- State rank
- #602 of 656 in OH
Livability — Akron
- Score
- 81/100
- State rank
- #104
- US rank
- #1591
Category grades
Schools grade is shown separately in the Schools card above.
Census & demographics
- Census place
- Akron, OH
- County
- Summit County · 440,783 people
- City population
- 174,375
- Metro
- Akron, OH
- Population (ZIP)
- 20,905
- Household income
- $41,688
- Rent vs Own
- Severe rent burden
- 1251.0
Population outlook (Summit County) Hauer SSP2
- Today (2025)
- 546,583 people
- By 2030
- 544,028 · -0.5%
- By 2040
- 531,363 · -2.8%
- By 2050
- 514,923 · -5.8%
- By 2075
- 481,765 · -11.9%
- By 2100
- 432,265 · -20.9%
Race, ethnicity, and origin ACS 2023
- Neighborhood character
- Diverse neighborhood (Simpson 0.62)
- Race & ethnicity
- White 48% Black 38% Two or more races 8% Hispanic / Latino 3% Asian 2%
- Common ancestry
- Lithuanian 2% Iranian 1% Scotch-Irish 1%
- Foreign-born
- 4% · Vietnam, Canada, Philippines
- Languages at home
- 94% English-only · Spanish 2% Other Asian/Pacific 1% Vietnamese 1%
Political lean MEDSL · Summit
- 2024 margin
- Lean D (+7.0) · D 53.0% · R 46.0%
- 2008→2024 swing
- -9.6pp toward R · 2008: 16.6pp · 2024: 7.0pp
- All cycles
- 2024: D+7.0 2020: D+9.6 2016: D+8.2 2012: D+14.8 2008: D+16.6
Not yet ingested
- Civics
- —
Market trends
- HPI YoY
- ▼ -101.46%
- Current HPI
- 132.768
- Rent YoY
- ▲ 7.63%
- Metro
- Akron, OH
- State GDP YoY
- ▲ 1.98%
- F500 in state
- 48
Industry mix (Fortune 500 HQ in OH)
| Industry | F500 HQs | Revenue |
|---|---|---|
| Insurance | 3 | $145B |
|
||
| Industrial Machinery | 3 | $49B |
|
||
| Financial Services | 3 | $24B |
|
||
| Consumer Goods | 2 | $93B |
|
||
| Aerospace / Defense | 2 | $47B |
|
||
| Utilities | 2 | $33B |
|
||
Price history
+126.4% since first listed33 events — show timeline
- 2026-06-17 Listed $84,900 MLSNOW
- 2026-05-13 Listed for Rent $1,100 YESMLS
- 2025-09-30 Listing Removed — MLSNOW
- 2025-08-01 Listing Removed — MLSNOW
- 2025-05-30 Listed $101,000 MLSNOW
- 2025-05-30 Listed $85,500 MLSNOW
- 2023-06-12 Rental Removed — YESMLS
- 2017-11-03 Sold (Public Records) $8,500 Public Records
- 2017-11-03 Sold (MLS) $8,500 MLSNOW
- 2017-10-17 Pending — MLSNOW
- 2017-10-16 Listing Removed — MLSNOW
- 2017-09-13 Price Changed $9,900 MLSNOW
- 2017-07-26 Price Changed $14,900 MLSNOW
- 2017-05-17 Price Changed $19,900 MLSNOW
- 2017-05-09 Listed $24,900 MLSNOW
- 2016-06-06 Sold (Public Records) $23,700 Public Records
- 2016-03-22 Listing Removed — MLSNOW
- 2015-12-30 Price Changed $24,499 MLSNOW
- 2015-12-30 Price Changed $17,900 MLSNOW
- 2015-11-25 Listed $24,900 MLSNOW
- 2014-07-15 Sold (MLS) $9,200 MLSNOW
- 2014-06-24 Listing Removed — MLSNOW
- 2014-05-13 Listed $11,500 MLSNOW
- 2001-10-04 Listing Removed — MLSNOW
- 2001-05-04 Listed $49,900 MLSNOW
- 1999-12-03 Listing Removed — MLSNOW
- 1999-08-03 Listed $54,000 MLSNOW
- 1994-05-31 Sold (Public Records) $36,500 Public Records
- 1994-04-18 Listed $37,500 MLSNOW
- 1994-04-06 Listing Removed — MLSNOW
- 1993-10-08 Listed $37,500 MLSNOW
- 1993-09-04 Listing Removed — MLSNOW
- 1993-03-05 Listed $37,500 MLSNOW
Property tax history
-2.3%/yrLatest (2025): $1,082 · -31.6% YoY. Source: county tax records.
Cash-flow waterfall
monthlySold comps — $/sqft
last 12 mo · ≤1 miLoading sold comps…