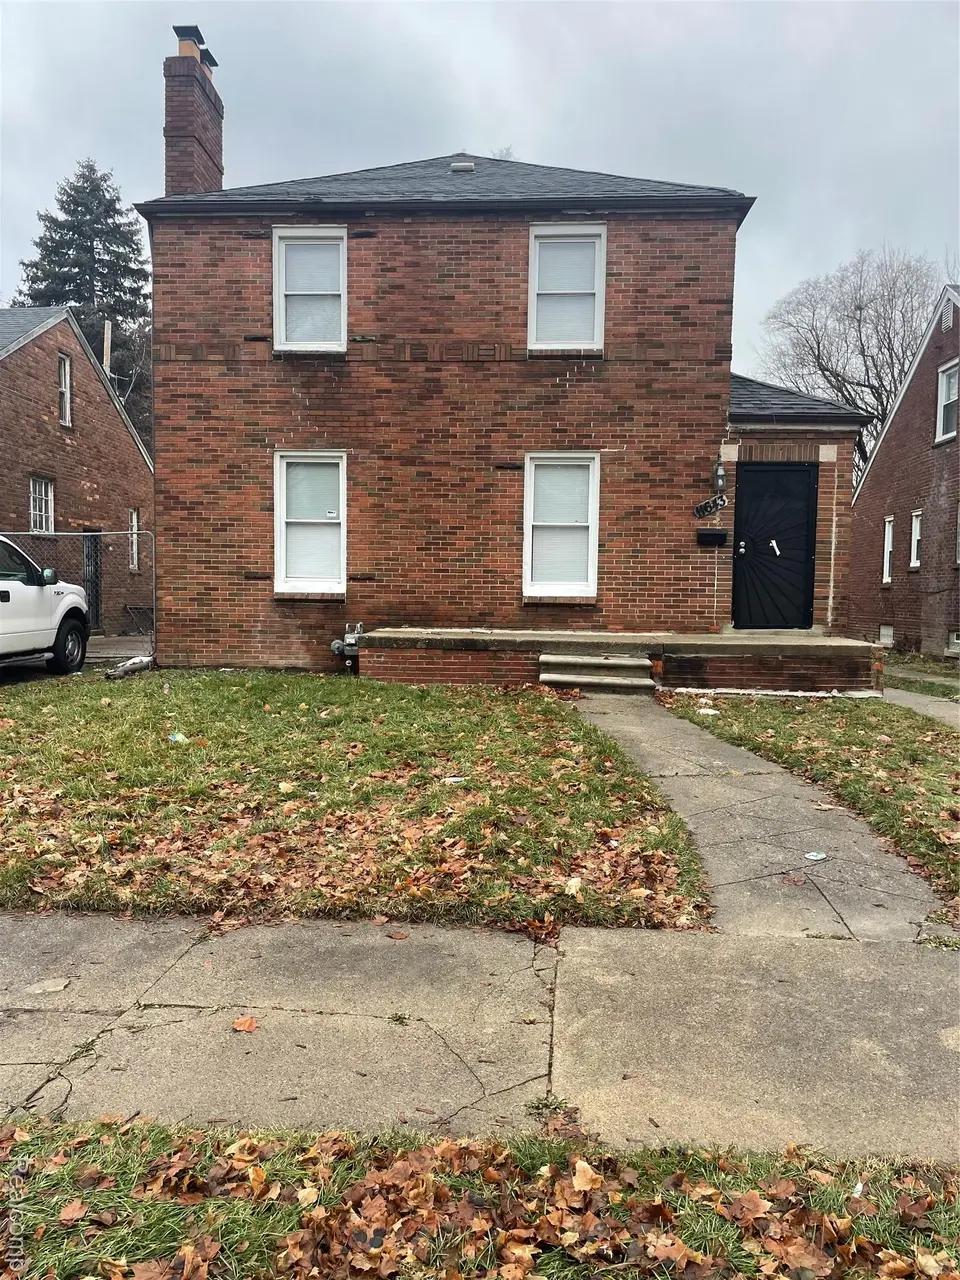
11643 Sussex St · Detroit, MI
Flood risk 1/10 · Minimal
- FEMA flood zone
- X (unshaded)
- Chance of flooding over 30 yrs
- 0.0%
- Est. flood insurance / yr
- $473 – $860
Fire risk 1/10 · Minimal
- Est. fire insurance / yr
- $784 – $1,456
Heat risk 3/10 · Minor
- Hot days now (above 98°F)
- 7 days/yr
- Hot days in 30 yrs
- 15 days/yr
Wind risk 2/10 · Minimal
- Chance of severe wind over 30 yrs
- —
Air-quality risk 3/10 · Minor
- Unhealthy air days now
- 2 days/yr
- Unhealthy air days in 30 yrs
- 5 days/yr
Risk factors via First Street. Map © Google.
Why this score? — see what drove the D+ grade
The composite is a weighted blend of 9 inputs, each scored 0–100. Each bar is that input's sub-score; the figure is the points it added to the 100-point composite (weight × sub-score).
- Cash flow +18.5/30.0
- ARV discount +7.5/15.0
- 1% rule +6.6/10.0
- DSCR +5.8/10.0
- Rent growth +3.9/5.0
- Livability +3.7/5.0
- Condition / age +2.5/5.0
- Schools +1.3/10.0
- Appreciation +0.0/10.0
$120,000
🖨 Deal sheet (PDF) 📄 Offer letter ✓ Due diligence
Listing remarks MLS
Located in Detroit’s Plymouth Hubbell district, 11643 Sussex is a solid brick 3 bedroom, 1 bathroom home currently generating $1,200 per month in rental income. This property presents a strong opportunity for DSCR buyers looking for cash flow, or an owner occupant wanting an affordable place to call home. Reach out to Andre Wadley Jr. for tours and questions.
Key facts
- 4,356 sq ft lot
- Built 1937
- Listed 112 days
Neighborhood map
What this means for you Summary
Snapshot
- This is a 3-bed/1.5-bath single-family listed at $120k.
Deal economics
- At list price, monthly cash flow is $114 ($1k/yr) — positive.
- The deal already cash-flows at list — no discount required.
- Meets the 1% rule at list price ($1k rent vs $120k).
- Recommended offer: $109k (9.0% below list) — sets the bar for market timing.
- Cap rate 7.4% vs local median 10.0% in Detroit — below-typical yield; the buyer is paying a premium for something (appreciation thesis, condition, location) that the cap rate doesn't capture.
Location & tenants
- Location reads 73/100 on livability (#218 in MI) — a middle-class / working-renter tenant base. Strengths: amenities A+, commute A+, cost of living A+; Watch: schools F, crime F, employment F.
- Detroit Public Schools Community District (urban): math 10% / reading 24% proficiency, ranked #499 of 540 in MI (top 92%) — low school quality limits family demand, transient renter base, plan for 1-2y turnover; 90% free/reduced lunch — lower-income household profile, screen leases tightly.
- Market conditions: Rents rising fast (+5.6%/yr); 392 active listings in the ZIP; 21 comparable units currently listed for rent nearby; rentals at typical pace (median 26d on market — plan ~3-4 weeks tenant-placement turnaround); 48% of comp listings sitting > 30 days — soft ceiling on asking rent; lower-income renter base — watch delinquency; 2,639 units permitted in Wayne County in 2024 (1,216 in 5+ unit buildings).
- At $1,392/mo this rent would consume 46% of the median local household income ($37k/yr) (locally 2371% of renters already pay >50% of income on rent) — very limited rent-growth headroom before tenants either downsize or default.
Forward outlook
- Local home prices are declining (-3.0%/yr); year-one equity from $830 of loan paydown is wiped out by about $4k of value loss. Plan a longer hold.
- Wayne County population projected at -17% by 2050 — secular population decline; favor cash flow + early exit over multi-decade hold.
Negotiation context
- It's been on market 112 days — a 9% lower offer ($109k) is reasonable based on typical stale-listing flexibility.
- 30 sale attempts since 13y ago with the ask held roughly flat each time — persistent listings suggest the price (not the market) is what's stuck; bring a comps-based counter.
- Current owner paid $65k; list at $120k implies a 85% gain — meaningful room to come down on a strong offer.
Risks & watch-outs
- Watch-outs: property tax is 3.1% of price; built in 1937 — expect roof / HVAC / electrical / plumbing capex.
Questions for the listing agent
- It's been on market 112 days. Have you received any prior offers? Is the seller open to a 9% concession, seller financing, or rate buy-down credit?
- Built in 1937 — when were the roof, HVAC, electrical panel, plumbing, and water heater last replaced?
- Property tax is high relative to price — has the assessment been appealed recently, and will the sale trigger a re-assessment?
- Why hasn't it sold? Are there any deal-killer items the seller is aware of (foundation, flood, title, zoning, code violations)?
- Is there a deadline driving the sale (1031 exchange, divorce, estate, relocation)? That informs how much negotiation room exists.
- Schools are F-rated, which usually means shorter tenancies and higher turnover. Who's the typical renter profile here, and what's been the actual vacancy rate?
- Crime grade is F in this area — have there been break-ins, vandalism, or insurance claims at this property in the last 3 years? What carrier currently insures it and at what premium?
- The area grade is low — what's the realistic commute time and amenity access for the typical tenant pool here? Any planned neighborhood developments (good or bad) we should know about?
- What's the average days-on-market for RENTAL listings here right now (not sales)? A rising rental-DOM trend means longer vacancies and softer asking-rent achievability than the comps imply.
- What's the recent tenant-quality profile in this submarket — average credit score on applications, eviction rate, late-payment / NSF rate, and stable-employment percentage? A property-management company in the area should have these aggregated.
- How much new for-sale + rental construction is in the pipeline within 1–3 miles? Heavy new supply typically softens prices + rents 12–24 months out; constrained supply supports both.
Investment metrics
- 1% rule
- 1.16% ✓
- Cap rate
- 7.43%
- Cash-on-cash
- 4.08%
- DSCR
- 1.18
- GRM
- 7.2
CMA / ARV
- ARV (median comp)
- $77,756
- List price
- $120,000
- Delta
- 54.33%
- Verdict
- OVERPRICED
- Comps
- 20 within 1.0 mi
Show comp detail 12 sales within ~0.75 mi
| Address | Dist | Beds/Ba | Sqft | Sold | Price | $/sf | Match |
|---|---|---|---|---|---|---|---|
| 11669 Whitcomb St | 0.06mi | 3/1.0 | 1,520 (-3%) | 10mo | $142,000 | $93 | 82 |
| 9585 Terry St | 0.49mi | 3/1.0 | 1,534 (-2%) | 11mo | $75,000 | $49 | 63 |
| 9606 Whitcomb St | 0.44mi | 2/1.0 (-1) | 1,400 (-10%) | 2mo | $64,000 | $46 | 53 |
| 13217 Whitcomb St | 0.75mi | 3/1.5 | 1,538 (-2%) | 12mo | $75,000 | $49 | 52 |
| 9535 Terry St | 0.53mi | 3/1.5 | 1,387 (-11%) | 6mo | $110,000 | $79 | 52 |
| 9222 Prest St | 0.71mi | 2/1.5 (-1) | 1,641 (+5%) | 9mo | $80,000 | $49 | 46 |
| 10039 Mark Twain St | 0.51mi | 3/1.0 | 1,334 (-14%) | 7mo | $73,000 | $55 | 44 |
| 12883 Robson St | 0.71mi | 3/1.0 | 1,418 (-9%) | 10mo | $54,000 | $38 | 41 |
| 12880 Sussex St | 0.70mi | 2/1.0 (-1) | 1,700 (+9%) | 10mo | $37,500 | $22 | 38 |
| 11394 Asbury Park | 0.64mi | 4/1.0 (+1) | 1,782 (+14%) | 6mo | $149,000 | $84 | 34 |
| 13731 Wadsworth St | 0.73mi | 3/1.0 | 1,345 (-14%) | 9mo | $45,000 | $33 | 34 |
| 12795 Hubbell St | 0.72mi | 3/1.0 | 1,326 (-15%) | 11mo | $30,000 | $23 | 30 |
Match score weights: distance 35% · size 25% · config 20% · recency 20%. Top-matched comps best support the ARV.
Projected returns pro-forma
-3.0% appreciation · 5.59% rent growth · sell at horizon
- IRR
- -6.5%
- Equity multiple
- 0.75×
- Total profit
- $-8,339
- Equity at exit
- $17,892
- IRR
- 6.5%
- Equity multiple
- 1.56×
- Total profit
- $18,671
- Equity at exit
- $10,375
Cash invested: $33,600 (down + closing). Projections, not guarantees.
Landlord ↔ Tenant lean methodology
- Overall (STATE)
- 62 Landlord-Friendly
- State Michigan
- 62 Landlord-Friendly · EVEN
- County
- — inherits STATE
- City
- — inherits STATE
ZIP-level market 48227
- Rents YoY
- 5.6%
- Active inventory
- 392
- Price-to-rent
- 7.2×
Monthly cashflow live
- Estimated rent
- $1,392 high interval (Pro) →
- Mortgage (P&I)
- −$629
- Tax from tax record
- −$306 /mo · $3,671/yr
- Insurance
- −$50
- HOA
- −$0
- Vacancy / Maint / Mgmt
- −$292
- Net cashflow
- $114
Break-even live
Sensitivity live
| Price | -10% $182 | -5% $148 | +0% $114 | +5% $80 | +10% $46 |
|---|---|---|---|---|---|
| Rent | -10% $4 | -5% $59 | +0% $114 | +5% $169 | +10% $224 |
| Rate | -1.0pp $175 | -0.5pp $145 | base $114 | +0.5pp $83 | +1.0pp $51 |
UW: 25.0% down · 7.5% · 30yr · 1.5% tax · 5.0% vac · 8.0% maint · 8.0% mgmt
Financing live
Cash to close
- Down payment
- $30,000
- Closing costs
- $3,600
- Reserves months
- —
- Total cash needed
- —
Loan-product check · same deal, 3 products live
Conventional
25% down · 7.5% · 30yr
- Down + closing
- —
- Monthly P&I
- —
- Monthly cashflow
- —
- DSCR
- —
- Eligible?
- —
Personal DTI + credit; lowest rate.
DSCR
20% down · 8.5% · 30yr
- Down + closing
- —
- Monthly P&I
- —
- Monthly cashflow
- —
- DSCR
- —
- Eligible?
- —
No personal income docs; deal must DSCR.
Hard money
10% down · 12.0% · 12mo
- Down + closing
- —
- Monthly P&I
- —
- Monthly cashflow
- —
- DSCR
- —
- Eligible?
- —
Short-term bridge; refi at stabilization.
Rent comps 21 comps
| Address | Beds | Baths | Sqft | Rent | $/sqft | DOM | Units | Dist |
|---|---|---|---|---|---|---|---|---|
| 11634 Sussex St Detroit, MI | 3.0 | 1.0 | 1091 | $1,326 | $1.22 | 25d | 1 | 0.05mi |
| 11397 Whitcomb St Detroit, MI | 3.0 | 1.0 | 1070 | $1,400 | $1.31 | 18d | 1 | 0.09mi |
| 12014 Terry St Detroit, MI | 2.0 | 1.0 | 1361 | $1,200 | $0.88 | 45d | 1 | 0.26mi |
| 11431 Marlowe St Detroit, MI | 3.0 | 1.0 | 1172 | $1,400 | $1.19 | 18d | 1 | 0.31mi |
| 11641 Mansfield St Unit 2 Detroit, MI | 3.0 | 1.0 | 1449 | $1,300 | $0.90 | 45d | 1 | 0.45mi |
| 9501 Lauder St Detroit, MI | 3.0 | 2.0 | 1152 | $1,350 | $1.17 | 45d | 1 | 0.57mi |
| 9589 Mansfield St Detroit, MI | 4.0 | 1.0 | 1250 | $1,500 | $1.20 | 6d | 1 | 0.62mi |
| 12778 Strathmoor St Detroit, MI | 3.0 | 1.0 | 1597 | $1,150 | $0.72 | 6d | 1 | 0.78mi |
| 9220 Mansfield St Detroit, MI | 3.0 | 1.0 | 1200 | $1,300 | $1.08 | 45d | 1 | 0.82mi |
| 10030 Abington Ave Detroit, MI | 4.0 | 2.0 | 1350 | $1,475 | $1.09 | 12d | 1 | 0.83mi |
| 13279 Coyle St Detroit, MI | 3.0 | 1.0 | 1444 | $1,373 | $0.95 | 45d | 1 | 0.83mi |
| 13331 Strathmoor St Detroit, MI | 3.0 | 1.0 | 1084 | $1,100 | $1.01 | 18d | 1 | 0.97mi |
| 12840 Grandmont Ave Detroit, MI | 3.0 | 1.0 | 1100 | $1,200 | $1.09 | 45d | 1 | 1.02mi |
| 14104 Coyle St Detroit, MI | 3.0 | 1.0 | 1327 | $1,350 | $1.02 | 6d | 1 | 1.15mi |
| 8331 Whitcomb St Detroit, MI | 4.0 | 1.0 | 1342 | $1,350 | $1.01 | 23d | 1 | 1.22mi |
| 9355 Ward St Detroit, MI | 3.0 | 1.0 | 1200 | $1,327 | $1.11 | 45d | 1 | 1.26mi |
| 11741 Penrod St Detroit, MI | 3.0 | 1.0 | 1124 | $1,400 | $1.25 | 18d | 1 | 1.32mi |
| 14375 Terry St Detroit, MI | 3.0 | 2.0 | 1300 | $1,425 | $1.10 | 45d | 1 | 1.42mi |
| 10002 Manor Unit 2 Detroit, MI | 3.0 | 1.0 | 1100 | $1,150 | $1.05 | 45d | 1 | 1.47mi |
| 8047 Robson St Detroit, MI | 3.0 | 2.0 | 1184 | $1,200 | $1.01 | 45d | 1 | 1.48mi |
| 14284 Cruse St Detroit, MI | 3.0 | 1.0 | 1121 | $1,150 | $1.03 | 18d | 1 | 1.48mi |
Listing history 50 events
-
2026-05-31days on market $120,000 Active 112 DOM
-
2026-02-08$120,000 Active 367-char remark
Show marketing remark (361 chars)
Located in Detroit's Plymouth Hubbell district, 11643 Sussex is a solid brick 3 bedroom, 1 bathroom home currently generating $1,200 per month in rental income. This property presents a strong opportunity for DSCR buyers looking for cash flow, or an owner occupant wanting an affordable place to call home. Reach out to Andre Wadley Jr. for tours and questions.
-
2026-02-08$120,000 Active 361-char remark
Show marketing remark (361 chars)
Located in Detroit's Plymouth Hubbell district, 11643 Sussex is a solid brick 3 bedroom, 1 bathroom home currently generating $1,200 per month in rental income. This property presents a strong opportunity for DSCR buyers looking for cash flow, or an owner occupant wanting an affordable place to call home. Reach out to Andre Wadley Jr. for tours and questions.
-
2025-12-30historical $1,200
-
2025-12-06historical
-
2025-12-05price $109,999
-
2025-12-04price $109,999
-
2025-12-04price $109,999
-
2025-11-21$1,200
-
2025-11-21historical $1,200
-
2025-11-20$1,200
-
2025-10-22$110,000 Active
-
2025-10-22$110,000 Active
-
2025-09-11historical
-
2025-08-26$99,000 Active
-
2025-08-26$99,000 Active
-
2025-08-24historical
-
2025-08-23historical
-
2025-06-26price $99,000
-
2025-06-26price $99,000
-
2025-06-26price $99,000
-
2025-05-21price $99,900
-
2025-05-20price $99,900
-
2025-05-20price $99,900
-
2025-05-19historical $970
-
2025-05-17$90,000 Active
-
2025-05-17$90,000 Active
-
2025-04-19price $970
-
2025-04-07$1,070
-
2025-04-03historical $1,350
-
2025-03-25$1,350
-
2025-03-25historical $1,350
-
2025-03-11$1,350
-
2025-03-11historical $1,350
-
2024-12-18$1,350
-
2024-12-18historical $1,350
-
2024-11-01historical
-
2024-11-01historical
-
2024-09-01$1,350
-
2024-08-21price $105,000
-
2024-08-21price $105,000
-
2024-08-21price $105,000
-
2024-08-14$100,000 Active
-
2024-08-14$100,000 Active
-
2024-03-26soldstatus $65,000
-
2024-03-22soldstatus $65,000 Sold
-
2024-03-22soldstatus $65,000 Closed
-
2024-03-05status Pending
-
2024-03-05status Pending
-
2024-02-19historical Accepting Backup Offers
ⓘ Source: listings_history table (triggers on properties + properties_extension) + one-shot
backfill from property_details.listing_events for pre-trigger history.
Tax reassessment forecast MI · Partial reset (capped growth)
- Current annual tax
- $3,671 · $306/mo
- Projected year-2 tax
- $3,671 · $306/mo
- Expected delta
- $0/yr ($0/mo · 0.0%)
ⓘ Screening estimate from a state-policy table — verify with the county assessor before closing.
Climate risk First Street
- Flood 1/10 Low FEMA zone X (unshaded) · 0% chance over 30 yrs
- Wildfire 1/10 Low
- Heat 3/10 Moderate 7 d/yr ≥98°F today · 15 d/yr by 30 yrs out
- Wind 2/10 Low
- Air quality 3/10 Moderate 2 unhealthy d/yr today · 5 by 30 yrs out
Nearby sold comps map
Loading sold comps map…
Walkable amenities ~0.75 mi
Loading nearby amenities…
Taxation est. · year 1
- Rental income
- $16,699
- − Mortgage interest
- −$6,722
- − Property taxes
- −$3,671
- − Insurance
- −$600
- − Repairs & maintenance
- −$1,336
- − Management
- −$1,336
- − Depreciation
- −$3,491
- Taxable loss
- −$457
- Est. tax savings @ 24.0%
- +$110
- After-tax cash flow
- $1,479/yr
For passive investors: Depreciation is non-cash, so a rental often shows a tax loss while cash-flowing — sheltering income. Rental losses are passive: they offset passive income freely, and up to $25,000/yr can offset ordinary (W-2) income if you actively participate and your MAGI is under $100k (phasing out to $0 by $150k); unused losses carry forward. On sale, claimed depreciation is recaptured at up to 25%, and gains may owe capital-gains tax (a 1031 exchange can defer both). Figures are a year-1 estimate at your 24.0% rate — not tax advice; consult a CPA.
Schools (NCES district)
- District
- Detroit Public Schools Community District
- NCES district ID
- 2601103
- Math proficiency
- 10% ▼ -2.00%
- Reading proficiency
- 24% ▲ 6.00%
- Median HH income
- $25,815
- Composite
- 13.06/100
- National rank
- #9564
- State rank
- #499 of 540 in MI
Livability — Detroit
- Score
- 73/100
- State rank
- #218
- US rank
- #5427
Category grades
Schools grade is shown separately in the Schools card above.
Census & demographics
- Census place
- Detroit, MI
- County
- Wayne County · 1,562,939 people
- City population
- 572,865
- Metro
- Detroit-Warren-Dearborn, MI
- Population (ZIP)
- 40,302
- Household income
- $36,527
- Rent vs Own
- Severe rent burden
- 2371.0
Population outlook (Wayne County) Hauer SSP2
- Today (2025)
- 1,675,273 people
- By 2030
- 1,620,300 · -3.3%
- By 2040
- 1,502,341 · -10.3%
- By 2050
- 1,384,039 · -17.4%
- By 2075
- 1,124,592 · -32.9%
- By 2100
- 881,193 · -47.4%
Race, ethnicity, and origin ACS 2023
- Neighborhood character
- Predominantly Black (95%)
- Race & ethnicity
- Black 95% Two or more races 3% White 1%
- Foreign-born
- 1%
- Languages at home
- 98% English-only · Spanish 1% French/Haitian/Cajun 1%
Political lean MEDSL · Wayne
- 2024 margin
- Strong D (+29.0) · D 62.7% · R 33.7% · Other 3.6%
- 2008→2024 swing
- -20.5pp toward R · 2008: 49.5pp · 2024: 29.0pp
- All cycles
- 2024: D+29.0 2020: D+38.1 2016: D+37.3 2012: D+46.9 2008: D+49.5
Not yet ingested
- Civics
- —
Market trends
- HPI YoY
- ▼ -125.00%
- Current HPI
- 186.4158
- Rent YoY
- ▲ 5.59%
- Metro
- Detroit-Warren-Dearborn, MI
- State GDP YoY
- ▲ 1.37%
- F500 in state
- 28
Industry mix (Fortune 500 HQ in MI)
| Industry | F500 HQs | Revenue |
|---|---|---|
| Automotive Parts | 3 | $48B |
|
||
| Automotive | 2 | $372B |
|
||
| Chemicals | 1 | $45B |
|
||
| Automotive Retail | 1 | $29B |
|
||
| Healthcare / Medical Devices | 1 | $23B |
|
||
| Automotive Technology | 1 | $20B |
|
||
Price history
+2900.0% since first listed79 events — show timeline
- 2026-02-08 Listed $120,000 REALCOMP
- 2026-02-08 Listed $120,000 MiRealSource-MiMLS
- 2025-12-30 Rental Removed $1,200 REALSOURCE
- 2025-12-06 Listing Removed — MiRealSource-MiMLS
- 2025-12-05 Price Changed $109,999 MiRealSource-MiMLS
- 2025-12-04 Price Changed $109,999 REALCOMP
- 2025-12-04 Price Changed $109,999 SW Michigan MLS
- 2025-11-21 Listed for Rent $1,200 REALSOURCE
- 2025-11-21 Rental Removed $1,200 SWMMLS
- 2025-11-20 Listed for Rent $1,200 SWMMLS
- 2025-10-22 Listed $110,000 REALCOMP
- 2025-10-22 Listed $110,000 MiRealSource-MiMLS
- 2025-09-11 Listing Removed — MiRealSource-MiMLS
- 2025-08-26 Listed $99,000 REALCOMP
- 2025-08-26 Listed $99,000 MiRealSource-MiMLS
- 2025-08-24 Listing Removed — MiRealSource-MiMLS
- 2025-08-23 Listing Removed — REALCOMP
- 2025-06-26 Price Changed $99,000 MiRealSource-MiMLS
- 2025-06-26 Price Changed $99,000 REALCOMP
- 2025-06-26 Price Changed $99,000 SW Michigan MLS
- 2025-05-21 Price Changed $99,900 MiRealSource-MiMLS
- 2025-05-20 Price Changed $99,900 REALCOMP
- 2025-05-20 Price Changed $99,900 SW Michigan MLS
- 2025-05-19 Rental Removed $970 PROPERTYWARE
- 2025-05-17 Listed $90,000 REALCOMP
- 2025-05-17 Listed $90,000 MiRealSource-MiMLS
- 2025-04-19 Price Changed $970 PROPERTYWARE
- 2025-04-07 Listed for Rent $1,070 PROPERTYWARE
- 2025-04-03 Rental Removed $1,350 REALCOMP
- 2025-03-25 Listed for Rent $1,350 REALCOMP
- 2025-03-25 Rental Removed $1,350 REALSOURCE
- 2025-03-11 Listed for Rent $1,350 REALSOURCE
- 2025-03-11 Rental Removed $1,350 REALCOMP
- 2024-12-18 Listed for Rent $1,350 REALCOMP
- 2024-12-18 Rental Removed $1,350 REALCOMP
- 2024-11-01 Listing Removed — REALCOMP
- 2024-11-01 Listing Removed — MiRealSource-MiMLS
- 2024-09-01 Listed for Rent $1,350 REALCOMP
- 2024-08-21 Price Changed $105,000 MiRealSource-MiMLS
- 2024-08-21 Price Changed $105,000 REALCOMP
- 2024-08-21 Price Changed $105,000 SW Michigan MLS
- 2024-08-14 Listed $100,000 REALCOMP
- 2024-08-14 Listed $100,000 MiRealSource-MiMLS
- 2024-03-26 Sold (Public Records) $65,000 Public Records
- 2024-03-22 Sold (MLS) $65,000 MiRealSource-MiMLS
- 2024-03-22 Sold (MLS) $65,000 REALCOMP
- 2024-03-05 Pending — MiRealSource-MiMLS
- 2024-03-05 Pending — REALCOMP
- 2024-02-19 Contingent — MiRealSource-MiMLS
- 2024-02-19 Contingent — REALCOMP
- 2023-10-27 Listed $75,000 REALCOMP
- 2023-10-26 Listed $75,000 MiRealSource-MiMLS
- 2022-12-09 Sold (MLS) $65,000 MiRealSource-MiMLS
- 2022-12-09 Sold (MLS) $65,000 REALCOMP
- 2022-10-17 Pending — MiRealSource-MiMLS
- 2022-10-17 Pending — REALCOMP
- 2022-09-12 Listed $65,000 MiRealSource-MiMLS
- 2022-09-12 Listed $65,000 REALCOMP
- 2022-09-09 Listing Removed — REALCOMP
- 2022-08-12 Pending — MiRealSource-MiMLS
- 2022-08-12 Pending — REALCOMP
- 2022-08-12 Listing Removed — MiRealSource-MiMLS
- 2022-08-12 Relisted — MiRealSource-MiMLS
- 2022-08-11 Relisted — REALCOMP
- 2022-03-25 Pending — MiRealSource-MiMLS
- 2022-03-25 Pending — REALCOMP
- 2022-03-14 Listed $65,000 MiRealSource-MiMLS
- 2022-03-14 Listed $65,000 REALCOMP
- 2020-08-25 Listing Removed — REALCOMP
- 2020-08-25 Listing Removed — MiRealSource-MiMLS
- 2020-08-07 Relisted — REALCOMP
- 2020-08-05 Listing Removed — REALCOMP
- 2020-07-06 Listed $44,500 MiRealSource-MiMLS
- 2020-07-06 Listed $44,500 REALCOMP
- 2014-04-29 Sold (Public Records) $46,500 Public Records
- 2013-10-21 Sold (MLS) $4,000 MiRealSource-MiMLS
- 2013-10-21 Sold (MLS) $4,000 REALCOMP
- 2013-06-12 Listed $4,000 MiRealSource-MiMLS
- 2013-06-12 Listed $4,000 REALCOMP
Property tax history
+4.8%/yrLatest (2025): $3,671 · +13.2% YoY. Source: county tax records.
Cash-flow waterfall
monthlySold comps — $/sqft
last 12 mo · ≤1 miLoading sold comps…