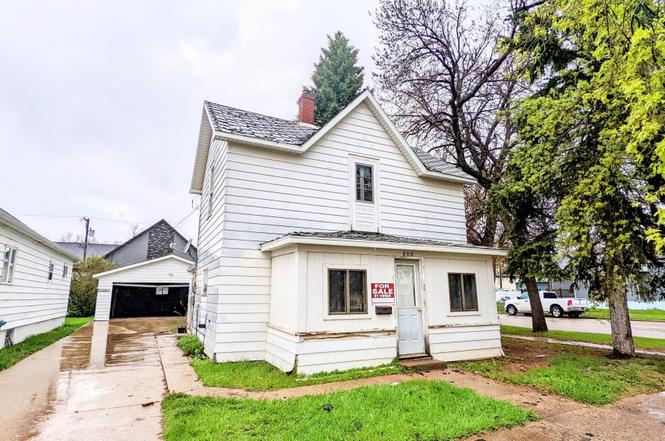
800 Burke Ave · Harvey, ND
Flood risk No data
- FEMA flood zone
- —
- Chance of flooding over 30 yrs
- —
- Est. flood insurance / yr
- —
Fire risk No data
- Est. fire insurance / yr
- —
Heat risk No data
- Hot days now (above threshold)
- —
- Hot days in 30 yrs
- —
Wind risk No data
- Chance of severe wind over 30 yrs
- —
Air-quality risk No data
- Unhealthy air days now
- —
- Unhealthy air days in 30 yrs
- —
Risk factors via First Street. Map © Google.
Why this score? — see what drove the D+ grade
The composite is a weighted blend of 9 inputs, each scored 0–100. Each bar is that input's sub-score; the figure is the points it added to the 100-point composite (weight × sub-score).
- Cash flow +15.0/30.0
- ARV discount +7.5/15.0
- Appreciation +5.7/10.0
- 1% rule +5.0/10.0
- DSCR +5.0/10.0
- Schools +3.6/10.0
- Livability +3.1/5.0
- Rent growth +2.5/5.0
- Condition / age +2.5/5.0
$19,900
🖨 Deal sheet 📄 Offer letter ✓ Due diligence
Key facts
- 8,712 sq ft lot
- 2 garage spots
- Built 1900
Property features AI
Exterior
- Parking: Detached or attached 2-car garage
- Utilities: City water connected; City sewer connected; Propane fuel
- Home design: Residential property; Two levels; Main level and additional living area
- Construction: Built with wood exterior; Foundation area approximately 880
- Exterior features: Wood exterior
Interior
- Bedrooms: 4 bedrooms
- Bathrooms: 1 full bathroom; 1 half bathroom
- Heating & cooling: Boiler heating; No central air
- Interior features: Basement with block construction
Neighborhood map
What this means for you Summary
Snapshot
- This is a 4-bed/2.0-bath other listed at $20k.
Deal economics
- At list price, monthly cash flow is $853 ($10k/yr) — positive.
- The deal already cash-flows at list — no discount required.
- Meets the 1% rule at list price ($1k rent vs $20k).
- Recommended offer: $18k (12.0% below list) — sets the bar for market timing.
Location & tenants
- Location reads 61/100 on livability (#259 in ND) — a middle-class / working-renter tenant base. Strengths: crime A+, cost of living A+, housing A+; Watch: schools D, employment D, amenities F.
- Harvey 38 (rural): math 40% / reading 40% proficiency, ranked #105 of 169 in ND (top 62%) — families likely to look elsewhere, expect single-tenant / working-renter base with shorter leases.
- Market conditions: 5 active listings in the ZIP; 1 units permitted in Wells County in 2024 (0 in 5+ unit buildings).
Forward outlook
- In year one you build about $408 of equity ($138 loan paydown + $270 appreciation (1.4% local appreciation)).
- At projected returns (1.4% appreciation + 3.0% rent growth), your $6k cash investment doubles in ~1 year — after that, you're playing with house money.
Negotiation context
- It's been on market 244 days — a 12% lower offer ($18k) is reasonable based on typical stale-listing flexibility.
- 2 sale attempts; this cycle's ask has dropped $5k (20%) from the opening price — seller is motivated, your offer sets the floor, not the list.
- Current owner paid $6k; list at $20k implies a 224% gain — meaningful room to come down on a strong offer.
Risks & watch-outs
- Watch-outs: property tax is 3.1% of price; built in 1900 — expect roof / HVAC / electrical / plumbing capex.
Questions for the listing agent
- It's been on market 244 days. Have you received any prior offers? Is the seller open to a 12% concession, seller financing, or rate buy-down credit?
- Built in 1900 — when were the roof, HVAC, electrical panel, plumbing, and water heater last replaced?
- Property tax is high relative to price — has the assessment been appealed recently, and will the sale trigger a re-assessment?
- Why hasn't it sold? Are there any deal-killer items the seller is aware of (foundation, flood, title, zoning, code violations)?
- Is there a deadline driving the sale (1031 exchange, divorce, estate, relocation)? That informs how much negotiation room exists.
- Schools are D-rated, which usually means shorter tenancies and higher turnover. Who's the typical renter profile here, and what's been the actual vacancy rate?
- The area grade is low — what's the realistic commute time and amenity access for the typical tenant pool here? Any planned neighborhood developments (good or bad) we should know about?
- What's the average days-on-market for RENTAL listings here right now (not sales)? A rising rental-DOM trend means longer vacancies and softer asking-rent achievability than the comps imply.
- What's the recent tenant-quality profile in this submarket — average credit score on applications, eviction rate, late-payment / NSF rate, and stable-employment percentage? A property-management company in the area should have these aggregated.
- How much new for-sale + rental construction is in the pipeline within 1–3 miles? Heavy new supply typically softens prices + rents 12–24 months out; constrained supply supports both.
Investment metrics
- 1% rule
- 6.47% ✓
- Cap rate
- 57.74%
- Cash-on-cash
- 183.74%
- DSCR
- 9.18
- GRM
- 1.3
CMA / ARV
No comps found within radius.
Projected returns pro-forma
1.36% appreciation · 3.0% rent growth · sell at horizon
- IRR
- —
- Equity multiple
- 10.89×
- Total profit
- $55,097
- Equity at exit
- $7,165
- IRR
- —
- Equity multiple
- 22.94×
- Total profit
- $122,266
- Equity at exit
- $9,815
Cash invested: $5,572 (down + closing). Projections, not guarantees.
Landlord ↔ Tenant lean methodology
- Overall (STATE)
- 82 Strongly Landlord-Friendly
- State North Dakota
- 82 Strongly Landlord-Friendly · R+20
- County
- — inherits STATE
- City
- — inherits STATE
ZIP-level market 58341
- Home prices YoY
- 2.3%
- Active inventory
- 5
- Price-to-rent
- 1.3×
Monthly cashflow live
- Estimated rent
- $1,287 medium interval (Pro) →
- Mortgage (P&I)
- −$104
- Tax from tax record
- −$51 /mo · $611/yr
- Insurance
- −$8
- HOA
- −$0
- Vacancy / Maint / Mgmt
- −$270
- Net cashflow
- $853
Break-even live
UW: 25.0% down · 7.5% · 30yr · 1.5% tax · 5.0% vac · 8.0% maint · 8.0% mgmt
Financing live
Cash to close
- Down payment
- $4,975
- Closing costs
- $597
- Reserves months
- —
- Total cash needed
- —
Loan-product check · same deal, 3 products live
Conventional
25% down · 7.5% · 30yr
- Down + closing
- —
- Monthly P&I
- —
- Monthly cashflow
- —
- DSCR
- —
- Eligible?
- —
Personal DTI + credit; lowest rate.
DSCR
20% down · 8.5% · 30yr
- Down + closing
- —
- Monthly P&I
- —
- Monthly cashflow
- —
- DSCR
- —
- Eligible?
- —
No personal income docs; deal must DSCR.
Hard money
10% down · 12.0% · 12mo
- Down + closing
- —
- Monthly P&I
- —
- Monthly cashflow
- —
- DSCR
- —
- Eligible?
- —
Short-term bridge; refi at stabilization.
Listing history 20 events
-
2026-06-18days on market $19,900 Active 244 DOM
-
2026-06-17days on market $19,900 Active 243 DOM
-
2026-06-16days on market $19,900 Active 242 DOM
-
2026-06-15days on market $19,900 Active 241 DOM
-
2026-06-13days on market $19,900 Active 239 DOM
-
2026-06-12days on market $19,900 Active 238 DOM
-
2026-06-09days on market $19,900 Active 235 DOM
-
2026-06-08days on market $19,900 Active 234 DOM
-
2026-06-07days on market $19,900 Active 233 DOM
-
2026-06-05days on market $19,900 Active 231 DOM
-
2026-06-04days on market $19,900 Active 229 DOM
-
2026-06-02days on market $19,900 Active 228 DOM
-
2026-06-01days on market $19,900 Active 227 DOM
-
2026-05-31days on market $19,900 Active 226 DOM
-
2026-05-31price $19,900 Active 225 DOM
-
2026-04-13price $22,500
-
2026-02-26status Active
-
2026-02-18status Pending
-
2025-10-09$25,000 Active
-
2021-12-02soldstatus $6,149
ⓘ Source: listings_history table (triggers on properties + properties_extension) + one-shot
backfill from property_details.listing_events for pre-trigger history.
Tax reassessment forecast ND · Resets to sale price
- Current annual tax
- $611 · $51/mo
- Projected year-2 tax
- $611 · $51/mo
- Expected delta
- $0/yr ($0/mo · 0.0%)
ⓘ Screening estimate from a state-policy table — verify with the county assessor before closing.
Nearby sold comps map
Loading sold comps map…
Walkable amenities ~0.75 mi
Loading nearby amenities…
Taxation est. · year 1
- Rental income
- $15,444
- − Mortgage interest
- −$1,115
- − Property taxes
- −$611
- − Insurance
- −$100
- − Repairs & maintenance
- −$1,236
- − Management
- −$1,236
- − Depreciation
- −$579
- Taxable income
- $10,569
- Est. tax owed @ 24.0%
- −$2,537
- After-tax cash flow
- $7,702/yr
For passive investors: Depreciation is non-cash, so a rental often shows a tax loss while cash-flowing — sheltering income. Rental losses are passive: they offset passive income freely, and up to $25,000/yr can offset ordinary (W-2) income if you actively participate and your MAGI is under $100k (phasing out to $0 by $150k); unused losses carry forward. On sale, claimed depreciation is recaptured at up to 25%, and gains may owe capital-gains tax (a 1031 exchange can defer both). Figures are a year-1 estimate at your 24.0% rate — not tax advice; consult a CPA.
Schools (NCES district)
- District
- Harvey 38
- NCES district ID
- 3808890
- Math proficiency
- 40% ▲ 5.00%
- Reading proficiency
- 40% ▼ -5.00%
- Median HH income
- $44,518
- Composite
- 36.4/100
- National rank
- #9353
- State rank
- #105 of 169 in ND
Livability — Harvey
- Score
- 61/100
- State rank
- #259
- US rank
- #18422
Category grades
Schools grade is shown separately in the Schools card above.
Census & demographics
- Census place
- Harvey, ND
- Population (ZIP)
- 2,642
Population outlook (Wells County) Hauer SSP2
- Today (2025)
- 4,023 people
- By 2030
- 3,980 · -1.1%
- By 2040
- 4,035 · +0.3%
- By 2050
- 4,088 · +1.6%
- By 2075
- 4,900 · +21.8%
- By 2100
- 4,939 · +22.8%
Race, ethnicity, and origin ACS 2023
- Neighborhood character
- Predominantly White (94%)
- Race & ethnicity
- White 94% Two or more races 3% Hispanic / Latino 2% Native American 1%
- Common ancestry
- Portuguese 21% Scotch-Irish 4% Slovak 2%
- Foreign-born
- 1%
- Languages at home
- 97% English-only · German/W. Germanic 3%
Political lean MEDSL · Wells
- 2024 margin
- Solid R (+62.9) · D 18.1% · R 81.0%
- 2008→2024 swing
- -36.5pp toward R · 2008: -26.4pp · 2024: -62.9pp
- All cycles
- 2024: R+62.9 2020: R+61.1 2016: R+58.4 2012: R+41.3 2008: R+26.4
Not yet ingested
- Civics
- —
Market trends
- HPI YoY
- ▲ 1.36%
- Current HPI
- 61.3651
- Rent YoY
- —
- Metro
- —
- State GDP YoY
- ▲ 2.09%
- F500 in state
- 2
Industry mix (Fortune 500 HQ in ND)
| Industry | F500 HQs | Revenue |
|---|---|---|
| Utilities / Construction | 1 | $6B |
|
||
Price history
+265.9% since first listed5 events — show timeline
- 2026-04-13 Price Changed $22,500 NORTHSTARMLS as Distributed by MLS Grid
- 2026-02-26 Relisted — NORTHSTARMLS as Distributed by MLS Grid
- 2026-02-18 Pending — NORTHSTARMLS as Distributed by MLS Grid
- 2025-10-09 Listed $25,000 NORTHSTARMLS as Distributed by MLS Grid
- 2021-12-02 Sold (Public Records) $6,149 Public Records
Property tax history
-3.0%/yrLatest (2025): $611 · -73.8% YoY. Source: county tax records.
Cash-flow waterfall
monthlySold comps — $/sqft
last 12 mo · ≤1 miLoading sold comps…