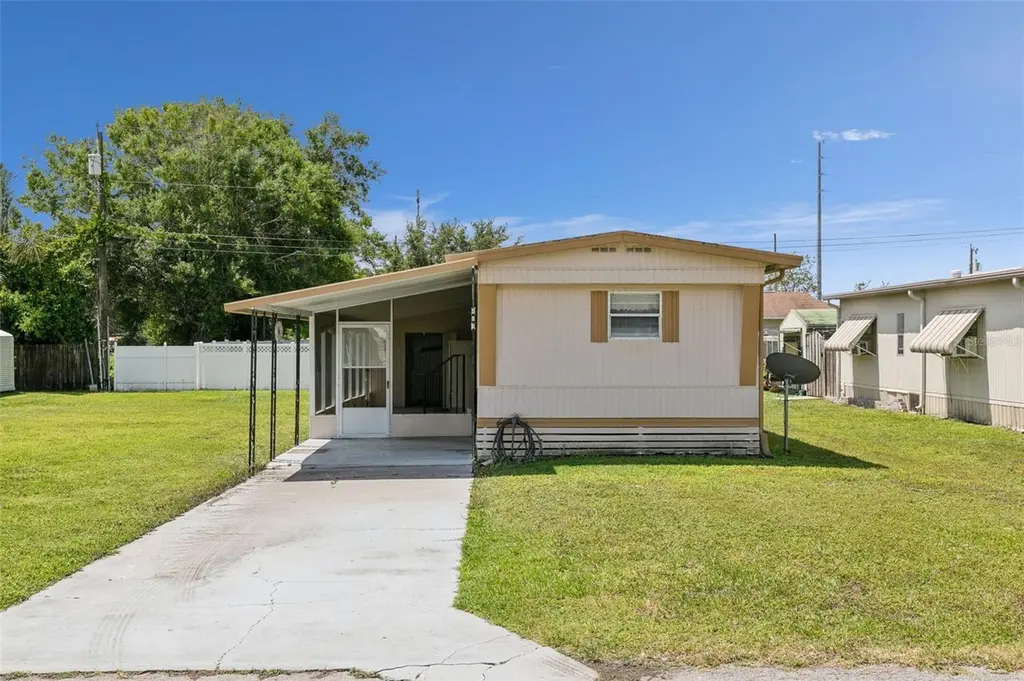
841 Robinson Ct · St. Cloud, FL
Flood risk 1/10 · Minimal
- FEMA flood zone
- X (unshaded)
- Chance of flooding over 30 yrs
- 0.0%
- Est. flood insurance / yr
- $507 – $1,088
Fire risk 2/10 · Minimal
- Est. fire insurance / yr
- $947 – $1,759
Heat risk 8/10 · Major
- Hot days now (above 108°F)
- 7 days/yr
- Hot days in 30 yrs
- 23 days/yr
Wind risk 9/10 · Severe
- Chance of severe wind over 30 yrs
- 99.0%
Air-quality risk 1/10 · Minimal
- Unhealthy air days now
- 0 days/yr
- Unhealthy air days in 30 yrs
- 0 days/yr
Risk factors via First Street. Map © Google.
Why this score? — see what drove the B- grade
The composite is a weighted blend of 9 inputs, each scored 0–100. Each bar is that input's sub-score; the figure is the points it added to the 100-point composite (weight × sub-score).
- Cash flow +30.0/30.0
- DSCR +10.0/10.0
- 1% rule +8.6/10.0
- ARV discount +7.5/15.0
- Schools +3.6/10.0
- Rent growth +2.8/5.0
- Livability +2.5/5.0
- Condition / age +2.5/5.0
- Appreciation +0.0/10.0
$120,000
🖨 Deal sheet 📄 Offer letter ✓ Due diligence
Listing remarks
Under contract-accepting backup offers. Solid investment opportunity for a cash buyer or investor seeking a straightforward project. AC was replaced in 2025. This 2-bedroom, 1-bath single-wide manufactured home (built 1980, ~784 sq ft) sits on a spacious ~8,500 sq ft lot (nearly 0.2 acres). It offers plenty of room for outdoor space, potential expansions, storage, or even a detached garage/workshop—rare for this price point in the area. The home needs TLC (cosmetic updates, repairs, and maintenance) but provides a blank canvas for someone handy or looking to add value through sweat equity. It's a basic, no-frills setup ideal for rental income, flipping, or a starter personal residenc
Key facts
- Blank canvas
- Spacious lot
- Outdoor space
Tags
Property features AI
Finance
- Other: Property type: Residential; Property subtype: Manufactured Home; Zoning: RMH; Total acreage: 0 to less than 1/4 acre; Lot dimensions approximately 70 x 100 feet
- Financial info: No lease restrictions
- HOA & community: No association
Exterior
- Parking: No parking details provided
- Security: Hurricane shutters
- Utilities: Public water; Public sewer; Electricity connected
- Home design: Manufactured home (single wide); One story; Faces north; Entry level: One
- Construction: Metal siding; Metal roof; Crawlspace foundation; Completed condition; Built as single wide manufactured home
- Exterior features: Awning(s); Hurricane shutters; Private mailbox; Shed(s), storage and workshop on property; Cleared, level, oversized lot; Asphalt road access
Interior
- Kitchen: Range; Refrigerator; Electric water heater
- Bedrooms: 2 bedrooms
- Flooring: Laminate; Linoleum
- Bathrooms: 1 full bathroom
- Heating & cooling: Electric heat; Central air conditioning
- Interior features: Eat-in kitchen; Thermostat; Skylight(s)
- Laundry & utility: Washer; Dryer; Laundry closet (inside)
Neighborhood map
What this means for you Summary
Snapshot
- This is a 2-bed/1.0-bath manufactured listed at $120k.
Deal economics
- At list price, monthly cash flow is $474 ($6k/yr) — positive.
- The deal already cash-flows at list — no discount required.
- Meets the 1% rule at list price ($2k rent vs $120k).
- Cap rate 11.0% vs local median 4.0% in St. Cloud — top-decile yield for the area; either an underpriced asset or a hidden risk that comps aren't pricing in. Stress-test before assuming the spread holds.
Location & tenants
- Location reads: area grade B — affects rentability + tenant quality, not the cash-flow math above.
- Osceola (suburban): math 39% / reading 45% proficiency, ranked #60 of 73 in FL (top 82%) — families likely to look elsewhere, expect single-tenant / working-renter base with shorter leases; 60% free/reduced lunch — lower-income household profile, screen leases tightly.
- Market conditions: Rents rising (+1.4%/yr); 258 active listings in the ZIP; 39 comparable units currently listed for rent nearby; rentals at typical pace (median 18d on market — plan ~3-4 weeks tenant-placement turnaround); 8,813 units permitted in Osceola County in 2024 (3,072 in 5+ unit buildings).
Forward outlook
- Local home prices are declining (-3.0%/yr); year-one equity from $830 of loan paydown is wiped out by about $4k of value loss. Plan a longer hold.
- Osceola County population projected at +73% by 2050 — long-run rental-demand tailwind backs the buy-and-hold thesis.
- At projected returns (-3.0% appreciation + 1.4% rent growth), your $34k cash investment doubles in ~9 years — after that, you're playing with house money.
Negotiation context
- Only 8 days on market — expect competitive offers; lowballing is unlikely to land.
- Current owner paid $36k; list at $120k implies a 233% gain — meaningful room to come down on a strong offer.
Risks & watch-outs
- Climate carrying-cost: severe wind risk, 99% chance of damaging wind over 30y; extreme-heat days projected 7→23/yr by 2055 (HVAC capex compounding) — expect insurance premiums to compound above CPI over the hold.
Questions for the listing agent
- Is there a deadline driving the sale (1031 exchange, divorce, estate, relocation)? That informs how much negotiation room exists.
- What's the average days-on-market for RENTAL listings here right now (not sales)? A rising rental-DOM trend means longer vacancies and softer asking-rent achievability than the comps imply.
- What's the recent tenant-quality profile in this submarket — average credit score on applications, eviction rate, late-payment / NSF rate, and stable-employment percentage? A property-management company in the area should have these aggregated.
- How much new for-sale + rental construction is in the pipeline within 1–3 miles? Heavy new supply typically softens prices + rents 12–24 months out; constrained supply supports both.
Investment metrics
- 1% rule
- 1.36% ✓
- Cap rate
- 11.03%
- Cash-on-cash
- 16.91%
- DSCR
- 1.75
- GRM
- 6.1
CMA / ARV
No comps found within radius.
Projected returns pro-forma
-3.0% appreciation · 1.35% rent growth · sell at horizon
- IRR
- 6.3%
- Equity multiple
- 1.24×
- Total profit
- $8,065
- Equity at exit
- $17,892
- IRR
- 14.2%
- Equity multiple
- 2.05×
- Total profit
- $35,342
- Equity at exit
- $10,375
Cash invested: $33,600 (down + closing). Projections, not guarantees.
Landlord ↔ Tenant lean methodology
- Overall (STATE)
- 87 Strongly Landlord-Friendly
- State Florida
- 87 Strongly Landlord-Friendly · R+3
- County
- — inherits STATE
- City
- — inherits STATE
ZIP-level market 34769
- Home prices YoY
- -24.6%
- Rents YoY
- 1.4%
- Active inventory
- 258
- Price-to-rent
- 6.1×
Monthly cashflow live
- Estimated rent
- $1,632 high interval (Pro) →
- Mortgage (P&I)
- −$629
- Tax from tax record
- −$137 /mo · $1,640/yr
- Insurance
- −$50
- HOA
- −$0
- Vacancy / Maint / Mgmt
- −$343
- Net cashflow
- $474
Break-even live
UW: 25.0% down · 7.5% · 30yr · 1.5% tax · 5.0% vac · 8.0% maint · 8.0% mgmt
Financing live
Cash to close
- Down payment
- $30,000
- Closing costs
- $3,600
- Reserves months
- —
- Total cash needed
- —
Loan-product check · same deal, 3 products live
Conventional
25% down · 7.5% · 30yr
- Down + closing
- —
- Monthly P&I
- —
- Monthly cashflow
- —
- DSCR
- —
- Eligible?
- —
Personal DTI + credit; lowest rate.
DSCR
20% down · 8.5% · 30yr
- Down + closing
- —
- Monthly P&I
- —
- Monthly cashflow
- —
- DSCR
- —
- Eligible?
- —
No personal income docs; deal must DSCR.
Hard money
10% down · 12.0% · 12mo
- Down + closing
- —
- Monthly P&I
- —
- Monthly cashflow
- —
- DSCR
- —
- Eligible?
- —
Short-term bridge; refi at stabilization.
Rent comps 39 comps
| Address | Beds | Baths | Sqft | Rent | $/sqft | DOM | Units | Dist |
|---|---|---|---|---|---|---|---|---|
| 1031 Columbia Ave Apt K St Cloud, FL | 1.0 | 1.0 | 650 | $950 | $1.46 | 20d | 1 | 0.16mi |
| 521 Montana Ave Saint Cloud, FL | 2.0 | 2.0 | 1010 | $1,495 | $1.48 | 23d | 1 | 0.27mi |
| 521 Montana Ave Saint Cloud, FL | 2.0 | 2.0 | 1010 | $1,495 | $1.48 | 2d | 1 | 0.27mi |
| 437 Columbia Ave St Cloud, FL | 2.0 | 2.0 | 1103 | $1,800 | $1.63 | 23d | 1 | 0.28mi |
| 1404 Montana Ave Saint Cloud, FL | 2.0 | 1.5 | 1000 | $1,800 | $1.80 | 23d | 1 | 0.39mi |
| 1423 Montana Ave Saint Cloud, FL | 3.0 | 2.0 | 1062 | $1,895 | $1.78 | 12d | 1 | 0.43mi |
| 1423 Montana Ave Unit 1423 St Cloud, FL | 3.0 | 2.0 | 1062 | $1,895 | $1.78 | 14d | 1 | 0.43mi |
| 607 Alabama Ave Saint Cloud, FL | 2.0 | 2.0 | 952 | $2,000 | $2.10 | 14d | 1 | 0.48mi |
| 3528 Bay Ct Saint Cloud, FL | 2.0 | 1.0 | 884 | $1,495 | $1.69 | 23d | 1 | 0.52mi |
| 217 Montana Ave Saint Cloud, FL | 2.0 | 1.0 | 864 | $1,400 | $1.62 | 7d | 1 | 0.55mi |
| 212 Tennessee Ave Saint Cloud, FL | 2.0 | 1.0 | 1009 | $1,700 | $1.68 | 23d | 1 | 0.61mi |
| 2400 16th St Saint Cloud, FL | 3.0 | 2.0 | 1040 | $1,799 | $1.73 | 17d | 1 | 0.62mi |
| 201 Georgia Ave Saint Cloud, FL | 2.0 | 2.0 | 915 | $1,500 | $1.64 | 7d | 1 | 0.63mi |
| 1400 Dakota Ave Saint Cloud, FL | 2.0 | 1.0 | 690 | $1,650 | $2.39 | 23d | 1 | 0.66mi |
| 200 Pine Valley Rd Saint Cloud, FL | 1.0–3.0 | 1.0–2.0 | 1020 | $1,634 | $1.60 | 3d | 10 | 0.70mi |
| 23 Louisiana Ave St Cloud, FL | 2.0 | 1.0 | 906 | $1,500 | $1.66 | 23d | 1 | 0.75mi |
| 23 Louisiana Ave St Cloud, FL | 2.0 | 1.0 | 888 | $1,500 | $1.69 | 17d | 1 | 0.75mi |
| 517 Jersey Ave Saint Cloud, FL | 1.0 | 1.0 | 600 | $1,250 | $2.08 | 7d | 1 | 0.75mi |
| 2401 E Lakeshore Blvd Unit 4 St Cloud, FL | 2.0 | 1.0 | 950 | $1,450 | $1.53 | 7d | 1 | 0.80mi |
| 608 Missouri Ave Saint Cloud, FL | 2.0 | 1.0 | 956 | $1,395 | $1.46 | 3d | 1 | 0.85mi |
| 616 Massachusetts Ave Unit A St Cloud, FL | 2.0 | 1.0 | 900 | $999 | $1.11 | 23d | 1 | 1.11mi |
| 616 Massachusetts Ave Unit A St Cloud, FL | 2.0 | 1.0 | 900 | $999 | $1.11 | 21d | 1 | 1.11mi |
| 1818 Minnesota Ave Unit B St Cloud, FL | 1.0 | 1.5 | 700 | $1,600 | $2.29 | 23d | 1 | 1.14mi |
| 527 Neptune Bay Cir Saint Cloud, FL | 2.0–3.0 | 2.0 | 1115 | $1,597 | $1.43 | 3d | 8 | 1.15mi |
| 1871 Cactus Ct Saint Cloud, FL | 3.0 | 2.0 | 900 | $1,400 | $1.56 | 17d | 1 | 1.17mi |
| 706 New York Ave Saint Cloud, FL | 1.0 | 1.0 | 750 | $1,425 | $1.90 | 23d | 1 | 1.17mi |
| 821 Pennsylvania Ave Saint Cloud, FL | 3.0 | 1.0 | 1048 | $1,695 | $1.62 | 7d | 1 | 1.27mi |
| 201 Saint Cloud Village Ct Kissimmee, FL | 1.0–3.0 | 1.0–2.0 | 880 | $1,412 | $1.60 | 14d | 1 | 1.31mi |
| 2510 King Oak Cir Saint Cloud, FL | 1.0 | 1.0 | 709 | $1,300 | $1.83 | 17d | 1 | 1.35mi |
| 3100 Soldier City Way St Cloud, FL | 3.0 | 2.0 | 1085 | $1,875 | $1.73 | 3d | 6 | 1.35mi |
| 1007 Florida Ave Saint Cloud, FL | 1.0–2.0 | 1.0 | 800 | $1,350 | $1.69 | 16d | 2 | 1.35mi |
| 3010 Camber Dr Saint Cloud, FL | 1.0–2.0 | 1.0–2.0 | 1007 | $1,971 | $1.96 | 2d | 18 | 1.36mi |
| 3065 Soldier City Way Unit 202 St Cloud, FL | 3.0 | 2.0 | 1125 | $1,800 | $1.60 | 20d | 1 | 1.38mi |
| 3075 Soldier City Way Unit 103 St Cloud, FL | 3.0 | 2.0 | 1045 | $1,850 | $1.77 | 23d | 1 | 1.40mi |
| 3075 Soldier City Way Unit 102 St Cloud, FL | 3.0 | 2.0 | 1045 | $1,800 | $1.72 | 23d | 1 | 1.40mi |
| 3075 Soldier City Way Unit 202 St Cloud, FL | 3.0 | 2.0 | 1125 | $1,800 | $1.60 | 20d | 1 | 1.40mi |
| 3075 Soldier City Way Unit 101 St Cloud, FL | 3.0 | 2.0 | 1045 | $1,850 | $1.77 | 4d | 1 | 1.40mi |
| 3085 Soldier City Way Unit 203 St Cloud, FL | 3.0 | 2.0 | 1045 | $1,850 | $1.77 | 23d | 1 | 1.41mi |
| 3085 Soldier City Way Unit 202 St Cloud, FL | 3.0 | 2.0 | 1125 | $1,800 | $1.60 | 23d | 1 | 1.41mi |
Listing history 4 events
-
2026-05-23status Pending
-
2026-05-15$120,000 Active
-
1997-02-04soldstatus $36,000
-
1979-11-01soldstatus $6,500
ⓘ Source: listings_history table (triggers on properties + properties_extension) + one-shot
backfill from property_details.listing_events for pre-trigger history.
Tax reassessment forecast FL · Resets to sale price
- Current annual tax
- $1,640 · $137/mo
- Projected year-2 tax
- $1,640 · $137/mo
- Expected delta
- $0/yr ($0/mo · 0.0%)
ⓘ Screening estimate from a state-policy table — verify with the county assessor before closing.
Climate risk First Street
- Flood 1/10 Low FEMA zone X (unshaded) · 0% chance over 30 yrs
- Wildfire 2/10 Low
- Heat 8/10 Severe 7 d/yr ≥108°F today · 23 d/yr by 30 yrs out
- Wind 9/10 Extreme 99% chance of damaging wind over 30 yrs
- Air quality 1/10 Low 0 unhealthy d/yr today · 0 by 30 yrs out
Nearby sold comps map
Loading sold comps map…
Walkable amenities ~0.75 mi
Loading nearby amenities…
Taxation est. · year 1
- Rental income
- $19,587
- − Mortgage interest
- −$6,722
- − Property taxes
- −$1,640
- − Insurance
- −$600
- − Repairs & maintenance
- −$1,567
- − Management
- −$1,567
- − Depreciation
- −$3,491
- Taxable income
- $4,001
- Est. tax owed @ 24.0%
- −$960
- After-tax cash flow
- $4,722/yr
For passive investors: Depreciation is non-cash, so a rental often shows a tax loss while cash-flowing — sheltering income. Rental losses are passive: they offset passive income freely, and up to $25,000/yr can offset ordinary (W-2) income if you actively participate and your MAGI is under $100k (phasing out to $0 by $150k); unused losses carry forward. On sale, claimed depreciation is recaptured at up to 25%, and gains may owe capital-gains tax (a 1031 exchange can defer both). Figures are a year-1 estimate at your 24.0% rate — not tax advice; consult a CPA.
Schools (NCES district)
- District
- Osceola
- NCES district ID
- 1201470
- Math proficiency
- 39% ▼ -9.00%
- Reading proficiency
- 45% ▼ -4.00%
- Median HH income
- $45,528
- Composite
- 35.7/100
- National rank
- #4865
- State rank
- #60 of 73 in FL
Livability — St. Cloud
No livability data for this city. (Only ~50 U.S. cities are tracked.)
Census & demographics
- Census place
- St. Cloud, FL
- County
- Osceola County · 410,217 people
- City population
- 29,247
- Metro
- Orlando-Kissimmee-Sanford, FL
- Population (ZIP)
- 30,204
- Household income
- $67,148
- Rent vs Own
- Severe rent burden
- 1138.0
Population outlook (Osceola County) Hauer SSP2
- Today (2025)
- 447,624 people
- By 2030
- 511,823 · +14.3%
- By 2040
- 642,986 · +43.6%
- By 2050
- 774,552 · +73.0%
- By 2075
- 1,078,144 · +140.9%
- By 2100
- 1,269,660 · +183.6%
Race, ethnicity, and origin ACS 2023
- Neighborhood character
- Diverse neighborhood (Simpson 0.60)
- Race & ethnicity
- White 50% Hispanic / Latino 38% Two or more races 17% Black 4%
- Hispanic origin (detail)
- Mexican 1% Puerto Rican 21% Dominican 5%
- Common ancestry
- Romanian 3% Lithuanian 3% Russian 2%
- Foreign-born
- 12% · Canada, Jamaica
- Languages at home
- 66% English-only · Spanish 31% French/Haitian/Cajun 2% Other Indo-European 1%
Political lean MEDSL · Osceola
- 2024 margin
- Toss-up / Even · D 48.7% · R 50.2% · Other 1.1%
- 2008→2024 swing
- -21.2pp toward R · 2008: 19.7pp · 2024: -1.4pp
- All cycles
- 2024: R+1.4 2020: D+13.8 2016: D+25.0 2012: D+24.5 2008: D+19.7
Not yet ingested
- Civics
- —
Market trends
- HPI YoY
- ▼ -106.08%
- Current HPI
- 324.6715
- Rent YoY
- ▲ 1.35%
- Metro
- Orlando-Kissimmee-Sanford, FL
- State GDP YoY
- ▲ 3.28%
- F500 in state
- 36
Industry mix (Fortune 500 HQ in FL)
| Industry | F500 HQs | Revenue |
|---|---|---|
| Industrial Technology | 2 | $29B |
|
||
| Insurance | 2 | $17B |
|
||
| Retail | 1 | $60B |
|
||
| Technology Distribution | 1 | $58B |
|
||
| Homebuilding | 1 | $35B |
|
||
| Technology Manufacturing | 1 | $35B |
|
||
Price history
+1746.2% since first listed4 events — show timeline
- 2026-05-23 Pending — Stellar MLS as Distributed by MLS Grid
- 2026-05-15 Listed $120,000 Stellar MLS as Distributed by MLS Grid
- 1997-02-04 Sold (Public Records) $36,000 Public Records
- 1979-11-01 Sold (Public Records) $6,500 Public Records
Property tax history
+6.2%/yrLatest (2025): $1,640 · +6.2% YoY. Source: county tax records.
Cash-flow waterfall
monthlySold comps — $/sqft
last 12 mo · ≤1 miLoading sold comps…