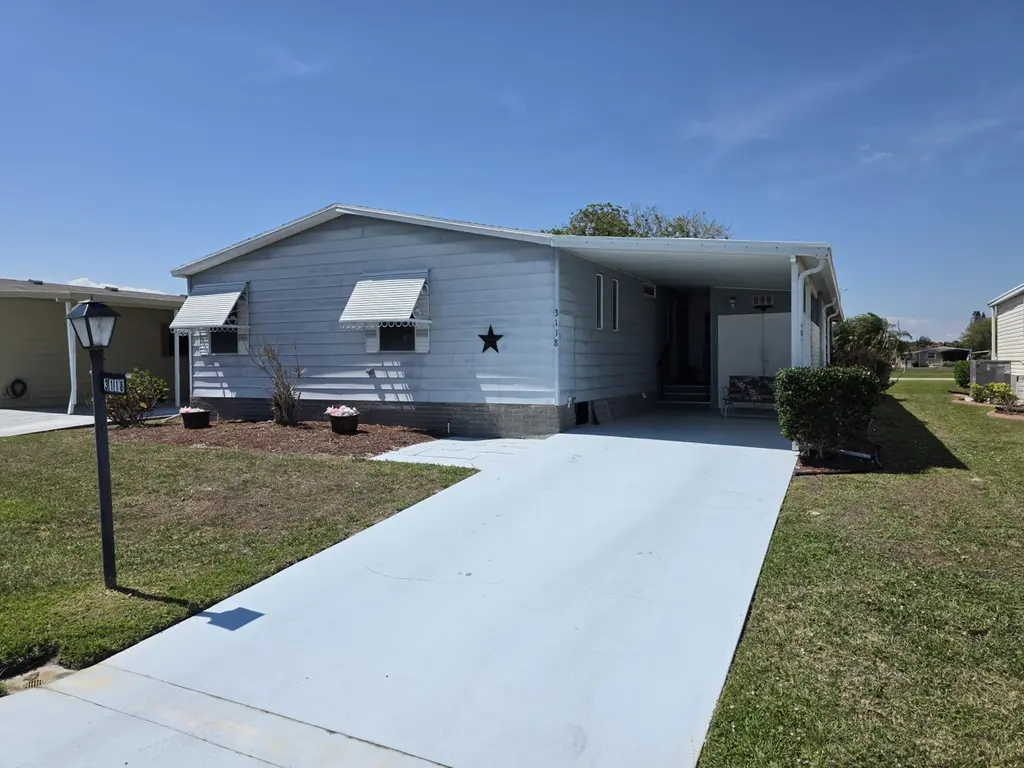
3118 Columbrina Cir · Port St. Lucie, FL
Flood risk 1/10 · Minimal
- FEMA flood zone
- X (unshaded)
- Chance of flooding over 30 yrs
- 0.0%
- Est. flood insurance / yr
- $507 – $1,088
Fire risk 4/10 · Minor
- Est. fire insurance / yr
- $947 – $1,759
Heat risk 10/10 · Severe
- Hot days now (above 106°F)
- 7 days/yr
- Hot days in 30 yrs
- 24 days/yr
Wind risk 10/10 · Severe
- Chance of severe wind over 30 yrs
- 99.0%
Air-quality risk 2/10 · Minimal
- Unhealthy air days now
- 1 days/yr
- Unhealthy air days in 30 yrs
- 1 days/yr
Risk factors via First Street. Map © Google.
Why this score? — see what drove the D grade
The composite is a weighted blend of 9 inputs, each scored 0–100. Each bar is that input's sub-score; the figure is the points it added to the 100-point composite (weight × sub-score).
- Cash flow +13.4/30.0
- 1% rule +6.2/10.0
- ARV discount +6.2/15.0
- DSCR +4.0/10.0
- Schools +3.7/10.0
- Rent growth +3.0/5.0
- Livability +2.5/5.0
- Condition / age +2.5/5.0
- Appreciation +0.0/10.0
$179,900
🖨 Deal sheet (PDF) 📄 Offer letter ✓ Due diligence
Listing remarks
NEW LOW PRICE. LAND OWNED! Large 2-bedroom, 2 bath home with a direct water view. HOME HAS BEEN FRESHLY PAINTED - EXTERIOR. Complete 6/19. Super large master bedroom with an attached bathroom, Dual sinks, separate shower and soaking tub highlight the master bath. L-shaped kitchen with plenty of counter space and cabinets. Ample seating in the dining room for your guests. Breakfast area with a gorgeous view of the water. Spacious living room with glass French doors leading to your lanai. Lanai has windows and screens with a door to the carport and another to the back patio. Concrete patio overlooks the back pond. Roof replaced in 2024 as was vapor barrier. All broken tiedowns replaced in 202
Key facts
- 5,211 sq ft lot
- 3 parking spots
- Community pool
Property features AI
Finance
- Other: Senior community; Pets allowed (dogs OK; pet restrictions possible)
- HOA & community: Part of Savanna Club Home Association; Monthly HOA fee; HOA includes cable TV, internet, security, sewer, trash and common areas; Community amenities include pool, heated pool, spa/hot tub, clubhouse, fitness center, tennis and pickleball courts, basketball court, shuffleboard, bocce ball, putting green, game room, business center, library, cafe/restaurant, cabana, management/manager on site, recreation facilities, sauna, billiard room, heated pool, internet included, security, trash chute
Exterior
- Parking: 3 total parking spaces; Attached carport (1 covered space); Driveway with 2 open spaces
- Security: Smoke detector(s); Community security (association)
- Utilities: Public water; Public sewer; 150 amp electric service with circuit breakers; Cable connected; Electricity connected; Sewer connected; Water connected; Underground utilities
- Home design: Single family residence; One story; Front entry; Faces south; Entry level: 1; Resale property
- Construction: Aluminum siding; Wood frame construction; Shingle/composition roof; Built on a single-level foundation
- Exterior features: Open patio; Screened porch; Glass-enclosed porch; Porch; Shed(s); Landscaped lot; Asphalt/paved road; Private maintained road; Not waterfront
Interior
- Kitchen: Dishwasher; Refrigerator; Electric range; Electric cooktop; Electric water heater
- Bedrooms: 2 bedrooms on the main level
- Flooring: Carpet; Laminate; Tile
- Bathrooms: 2 full bathrooms on the main level
- Heating & cooling: Central heating (electric); Central air conditioning (electric); Ceiling fan(s); Exhaust fan
- Interior features: Entrance foyer; Walk-in closet(s); Stacked bedroom layout; Furnished
- Laundry & utility: Washer hookup on main level; Electric dryer hookup
Neighborhood map
What this means for you Summary
Snapshot
- This is a 2-bed/2.0-bath manufactured listed at $180k.
Deal economics
- At list price, monthly cash flow is $4 ($51/yr) — positive.
- The deal already cash-flows at list — no discount required.
- Meets the 1% rule at list price ($2k rent vs $180k).
- Recommended offer: $169k (6.0% below list) — sets the bar for market timing.
- Cap rate 6.3% vs local median 3.9% in Port St. Lucie — top-decile yield for the area; either an underpriced asset or a hidden risk that comps aren't pricing in. Stress-test before assuming the spread holds.
Location & tenants
- Location reads: area grade D — affects rentability + tenant quality, not the cash-flow math above.
- St. Lucie (urban): math 40% / reading 48% proficiency, ranked #51 of 73 in FL (top 70%) — families likely to look elsewhere, expect single-tenant / working-renter base with shorter leases.
- Zoned schools: Manatee Academy K-8 (math 53% / reading 51%, grade C-, #990 of 2,144 statewide, top 48%, 1,664 students, 65% FRL); Southern Oaks Middle School (math 39% / reading 43%, grade F, #353 of 571 statewide, top 63%, 894 students, 76% FRL); Fort Pierce Central High School (math 15% / reading 45%, grade F, #441 of 667 statewide, top 67%, 3,091 students, 62% FRL).
- Market conditions: Rents rising (+1.9%/yr); 645 active listings in the ZIP; 16 comparable units currently listed for rent nearby; rentals at typical pace (median 16d on market — plan ~3-4 weeks tenant-placement turnaround); 4,868 units permitted in St. Lucie County in 2024 (268 in 5+ unit buildings).
- This rent runs 39% of the median local income ($62k/yr) — at the standard rent-burdened threshold; future hikes will face affordability resistance.
Forward outlook
- Local home prices are declining (-3.0%/yr); year-one equity from $1k of loan paydown is wiped out by about $5k of value loss. Plan a longer hold.
- St. Lucie County population projected at +20% by 2050 — long-run rental-demand tailwind backs the buy-and-hold thesis.
Negotiation context
- It's been on market 85 days — a 6% lower offer ($169k) is reasonable based on typical stale-listing flexibility.
- Current owner paid $80k; list at $180k implies a 125% gain — meaningful room to come down on a strong offer.
Risks & watch-outs
- Climate carrying-cost: severe wind risk, 99% chance of damaging wind over 30y; extreme-heat days projected 7→24/yr by 2055 (HVAC capex compounding) — expect insurance premiums to compound above CPI over the hold.
Questions for the listing agent
- It's been on market 85 days. Have you received any prior offers? Is the seller open to a 6% concession, seller financing, or rate buy-down credit?
- What does the HOA fee cover, when was the last increase, and are there any pending special assessments or reserve-fund shortfalls?
- Why hasn't it sold? Are there any deal-killer items the seller is aware of (foundation, flood, title, zoning, code violations)?
- Is there a deadline driving the sale (1031 exchange, divorce, estate, relocation)? That informs how much negotiation room exists.
- The area grade is low — what's the realistic commute time and amenity access for the typical tenant pool here? Any planned neighborhood developments (good or bad) we should know about?
- What's the average days-on-market for RENTAL listings here right now (not sales)? A rising rental-DOM trend means longer vacancies and softer asking-rent achievability than the comps imply.
- What's the recent tenant-quality profile in this submarket — average credit score on applications, eviction rate, late-payment / NSF rate, and stable-employment percentage? A property-management company in the area should have these aggregated.
- How much new for-sale + rental construction is in the pipeline within 1–3 miles? Heavy new supply typically softens prices + rents 12–24 months out; constrained supply supports both.
Investment metrics
- 1% rule
- 1.12% ✓
- Cap rate
- 6.32%
- Cash-on-cash
- 0.10%
- DSCR
- 1.00
- GRM
- 7.5
CMA / ARV
- ARV (on-the-fly)
- $175,000
- Comps found
- 12
Show comp detail 12 sales within ~0.75 mi
| Address | Dist | Beds/Ba | Sqft | Sold | Price | $/sf | Match |
|---|---|---|---|---|---|---|---|
| 8394 Delphinium Ct | 0.27mi | 3/2.0 (+1) | 1,392 (-1%) | 4mo | $220,000 | $158 | 78 |
| 2948 Fiddlewood Cir | 0.20mi | 2/2.0 | 1,280 (-9%) | 1mo | $122,000 | $95 | 75 |
| 3033 Satinleaf Ln | 0.19mi | 2/2.0 | 1,248 (-11%) | 4mo | $195,000 | $156 | 70 |
| 3817 Sleepy Hollow Ln | 0.56mi | 2/2.0 | 1,390 (-1%) | 4mo | $260,000 | $187 | 69 |
| 3005 Approach Shot Way | 0.50mi | 2/2.0 | 1,333 (-5%) | 3mo | $149,900 | $112 | 66 |
| 10 Padre | 0.42mi | 2/2.0 | 1,280 (-9%) | 4mo | $38,000 | $30 | 63 |
| 8504 Gallberry Cir | 0.51mi | 2/2.0 | 1,264 (-10%) | 4mo | $178,000 | $141 | 56 |
| 7921 Meadowlark Ln | 0.68mi | 2/2.0 | 1,301 (-7%) | 2mo | $115,000 | $88 | 54 |
| 7928 Meadowlark Ln | 0.68mi | 2/3.0 | 1,475 (+5%) | 2mo | $65,000 | $44 | 54 |
| 7953 Horned Lark Cir | 0.71mi | 2/2.0 | 1,286 (-8%) | 1mo | $130,000 | $101 | 52 |
| 3801 Meadowlark Cir | 0.62mi | 2/2.0 | 1,216 (-13%) | 4mo | $152,000 | $125 | 46 |
| 3720 Pebble Bch | 0.48mi | 3/2.0 (+1) | 1,608 (+15%) | 3mo | $225,000 | $140 | 45 |
Match score weights: distance 35% · size 25% · config 20% · recency 20%. Top-matched comps best support the ARV.
Projected returns pro-forma
-3.0% appreciation · 1.92% rent growth · sell at horizon
- IRR
- -17.5%
- Equity multiple
- 0.39×
- Total profit
- $-30,800
- Equity at exit
- $26,824
- IRR
- -12.1%
- Equity multiple
- 0.32×
- Total profit
- $-34,168
- Equity at exit
- $15,554
Cash invested: $50,372 (down + closing). Projections, not guarantees.
Landlord ↔ Tenant lean methodology
- Overall (STATE)
- 87 Strongly Landlord-Friendly
- State Florida
- 87 Strongly Landlord-Friendly · R+3
- County
- — inherits STATE
- City
- — inherits STATE
ZIP-level market 34952
- Home prices YoY
- -29.6%
- Rents YoY
- 1.9%
- Active inventory
- 645
- Price-to-rent
- 7.5×
Monthly cashflow live
- Estimated rent
- $2,007 high interval (Pro) →
- Mortgage (P&I)
- −$943
- Tax est. 1.5%
- −$225 /mo · $2,698/yr
- Insurance
- −$75
- HOA
- −$338
- Vacancy / Maint / Mgmt
- −$421
- Net cashflow
- $4
Break-even live
Sensitivity live
| Price | -10% $129 | -5% $66 | +0% $4 | +5% $-58 | +10% $-120 |
|---|---|---|---|---|---|
| Rent | -10% $-154 | -5% $-75 | +0% $4 | +5% $84 | +10% $163 |
| Rate | -1.0pp $95 | -0.5pp $50 | base $4 | +0.5pp $-42 | +1.0pp $-90 |
UW: 25.0% down · 7.5% · 30yr · 1.5% tax · 5.0% vac · 8.0% maint · 8.0% mgmt
Financing live
Cash to close
- Down payment
- $44,975
- Closing costs
- $5,397
- Reserves months
- —
- Total cash needed
- —
Loan-product check · same deal, 3 products live
Conventional
25% down · 7.5% · 30yr
- Down + closing
- —
- Monthly P&I
- —
- Monthly cashflow
- —
- DSCR
- —
- Eligible?
- —
Personal DTI + credit; lowest rate.
DSCR
20% down · 8.5% · 30yr
- Down + closing
- —
- Monthly P&I
- —
- Monthly cashflow
- —
- DSCR
- —
- Eligible?
- —
No personal income docs; deal must DSCR.
Hard money
10% down · 12.0% · 12mo
- Down + closing
- —
- Monthly P&I
- —
- Monthly cashflow
- —
- DSCR
- —
- Eligible?
- —
Short-term bridge; refi at stabilization.
Rent comps 16 comps
| Address | Beds | Baths | Sqft | Rent | $/sqft | DOM | Units | Dist |
|---|---|---|---|---|---|---|---|---|
| 3784 Sapodilla Ct Port Saint Lucie, FL | 2.0 | 2.0 | 1121 | $2,300 | $2.05 | 25d | 1 | 0.42mi |
| 71 W Caribbean Port St. Lucie, FL | 2.0 | 2.0 | 1417 | $1,700 | $1.20 | 25d | 1 | 0.52mi |
| 1900 Bella Vista Way Port Saint Lucie, FL | 1.0–2.0 | 1.0–2.0 | 995 | $1,764 | $1.77 | 15d | 15 | 0.70mi |
| 1131 SE Parrish Ct Port Saint Lucie, FL | 2.0 | 1.0 | 902 | $2,000 | $2.22 | 25d | 1 | 0.75mi |
| 1811 SE Walton Lakes Dr Port Saint Lucie, FL | 2.0 | 1.0–2.0 | 1117 | $1,926 | $1.72 | 15d | 6 | 0.78mi |
| 2082 SE Wild Meadow Cir Port Saint Lucie, FL | 2.0 | 2.0 | 1524 | $1,850 | $1.21 | 25d | 1 | 0.84mi |
| 2058 SE Wild Meadow Cir #101 Port St Lucie, FL | 2.0 | 2.5 | 1425 | $2,200 | $1.54 | 15d | 1 | 0.84mi |
| 2183 SE Wild Meadow Cir Port Saint Lucie, FL | 2.0 | 2.0 | 1550 | $1,900 | $1.23 | 15d | 1 | 0.85mi |
| 1810 SE Pinewood Trl Port Saint Lucie, FL | 1.0–2.0 | 1.0–2.0 | 1013 | $2,055 | $2.03 | 15d | 7 | 0.88mi |
| 2130 SE Wild Meadow Cir Port Saint Lucie, FL | 2.0 | 2.0 | 1440 | $1,695 | $1.18 | 15d | 1 | 0.88mi |
| 2209 SE East Dunbrooke Cir Port Saint Lucie, FL | 3.0 | 2.0 | 1212 | $2,950 | $2.43 | 15d | 1 | 0.90mi |
| 1455 SE Colchester Cir Port Saint Lucie, FL | 2.0 | 2.0 | 921 | $1,795 | $1.95 | 15d | 1 | 1.30mi |
| 1500 SE Tiffany Club Pl Port Saint Lucie, FL | 1.0–3.0 | 1.0–2.0 | 895 | $1,922 | $2.15 | 15d | 7 | 1.32mi |
| 1516 SE Royal Green Cir #202 Port St Lucie, FL | 3.0 | 2.0 | 921 | $2,100 | $2.28 | 25d | 1 | 1.35mi |
| 1520 SE Royal Green Cir Unit K-203 Port St. Lucie, FL | 2.0 | 2.0 | 886 | $1,800 | $2.03 | 25d | 1 | 1.36mi |
| 1537 SE Royal Green Cir Unit E204 Port St. Lucie, FL | 2.0 | 2.0 | 886 | $1,750 | $1.98 | 15d | 1 | 1.47mi |
HOA detail
- Monthly dues
- $338 · $4,056/yr
- Likely covers
- water
Listing history 21 events
-
2026-06-21days on market $179,900 Active 85 DOM
-
2026-06-19remarks 699-char remark
-
2026-06-18days on market $179,900 Active 82 DOM
-
2026-06-17days on market $179,900 Active 81 DOM
-
2026-06-16days on market $179,900 Active 80 DOM
-
2026-06-15days on market $179,900 Active 79 DOM
-
2026-06-14days on market $179,900 Active 77 DOM
-
2026-06-13days on market $179,900 Active 76 DOM
-
2026-06-10days on market $179,900 Active 74 DOM
-
2026-06-09days on market $179,900 Active 73 DOM
-
2026-06-08days on market $179,900 Active 72 DOM
-
2026-06-07days on market $179,900 Active 71 DOM
-
2026-06-05days on market $179,900 Active 68 DOM
-
2026-06-03days on market $179,900 Active 67 DOM
-
2026-06-02days on market $179,900 Active 66 DOM
-
2026-06-01days on market $179,900 Active 65 DOM
-
2026-05-31days on market $179,900 Active 64 DOM
-
2026-05-30days on market $179,900 Active 63 DOM
-
2026-05-22price $179,900
-
2026-03-28$189,900 Active
-
1989-08-30soldstatus $79,800
ⓘ Source: listings_history table (triggers on properties + properties_extension) + one-shot
backfill from property_details.listing_events for pre-trigger history.
Climate risk First Street
- Flood 1/10 Low FEMA zone X (unshaded) · 0% chance over 30 yrs
- Wildfire 4/10 Moderate
- Heat 10/10 Extreme 7 d/yr ≥106°F today · 24 d/yr by 30 yrs out
- Wind 10/10 Extreme 99% chance of damaging wind over 30 yrs
- Air quality 2/10 Low 1 unhealthy d/yr today · 1 by 30 yrs out
Nearby sold comps map
Loading sold comps map…
Walkable amenities ~0.75 mi
Loading nearby amenities…
Taxation est. · year 1
- Rental income
- $24,084
- − Mortgage interest
- −$10,077
- − Property taxes
- −$2,698
- − Insurance
- −$900
- − Repairs & maintenance
- −$1,927
- − Management
- −$1,927
- − HOA
- −$4,056
- − Depreciation
- −$5,233
- Taxable loss
- −$2,734
- Est. tax savings @ 24.0%
- +$656
- After-tax cash flow
- $707/yr
For passive investors: Depreciation is non-cash, so a rental often shows a tax loss while cash-flowing — sheltering income. Rental losses are passive: they offset passive income freely, and up to $25,000/yr can offset ordinary (W-2) income if you actively participate and your MAGI is under $100k (phasing out to $0 by $150k); unused losses carry forward. On sale, claimed depreciation is recaptured at up to 25%, and gains may owe capital-gains tax (a 1031 exchange can defer both). Figures are a year-1 estimate at your 24.0% rate — not tax advice; consult a CPA.
Schools (NCES district)
- District
- St. Lucie
- NCES district ID
- 1201770
- Math proficiency
- 40% ▼ -11.00%
- Reading proficiency
- 48% ▼ -4.00%
- Median HH income
- $44,737
- Composite
- 37.28/100
- National rank
- #4449
- State rank
- #51 of 73 in FL
Livability — Port St. Lucie
No livability data for this city. (Only ~50 U.S. cities are tracked.)
Census & demographics
- County
- Saint Lucie County · 337,150 people
- City population
- 221,051
- Metro
- Port St. Lucie, FL
- Population (ZIP)
- 42,655
- Household income
- $61,628
- Rent vs Own
- Severe rent burden
- 1759.0
Population outlook (St. Lucie County) Hauer SSP2
- Today (2025)
- 338,016 people
- By 2030
- 355,687 · +5.2%
- By 2040
- 385,521 · +14.1%
- By 2050
- 406,106 · +20.1%
- By 2075
- 441,054 · +30.5%
- By 2100
- 436,885 · +29.2%
Race, ethnicity, and origin ACS 2023
- Neighborhood character
- Diverse neighborhood (Simpson 0.57)
- Race & ethnicity
- White 62% Hispanic / Latino 19% Two or more races 14% Black 10% Asian 3%
- Hispanic origin (detail)
- Mexican 4% Puerto Rican 4% Cuban 2% Dominican 2%
- Common ancestry
- Romanian 3% Lithuanian 2% Hispanic 1%
- Foreign-born
- 18% · Canada, Jamaica, China
- Languages at home
- 76% English-only · Spanish 16% French/Haitian/Cajun 3% Tagalog/Filipino 2%
Political lean MEDSL · St. Lucie
- 2024 margin
- Lean R (+9.1) · D 45.1% · R 54.2%
- 2008→2024 swing
- -21.2pp toward R · 2008: 12.1pp · 2024: -9.1pp
- All cycles
- 2024: R+9.1 2020: R+1.6 2016: R+2.5 2012: D+7.9 2008: D+12.1
Not yet ingested
- Civics
- —
Market trends
- HPI YoY
- ▼ -155.80%
- Current HPI
- 371.0573
- Rent YoY
- ▲ 1.92%
- Metro
- Port St. Lucie, FL
- State GDP YoY
- ▲ 3.28%
- F500 in state
- 36
Industry mix (Fortune 500 HQ in FL)
| Industry | F500 HQs | Revenue |
|---|---|---|
| Industrial Technology | 2 | $29B |
|
||
| Insurance | 2 | $17B |
|
||
| Retail | 1 | $60B |
|
||
| Technology Distribution | 1 | $58B |
|
||
| Homebuilding | 1 | $35B |
|
||
| Technology Manufacturing | 1 | $35B |
|
||
Price history
+125.4% since first listed3 events — show timeline
- 2026-05-22 Price Changed $179,900 Beaches MLS
- 2026-03-28 Listed $189,900 Beaches MLS
- 1989-08-30 Sold (Public Records) $79,800 Public Records
Property tax history
+0.3%/yrLatest (2025): $339 · +4.6% YoY. Source: county tax records.
Cash-flow waterfall
monthlySold comps — $/sqft
last 12 mo · ≤1 miLoading sold comps…