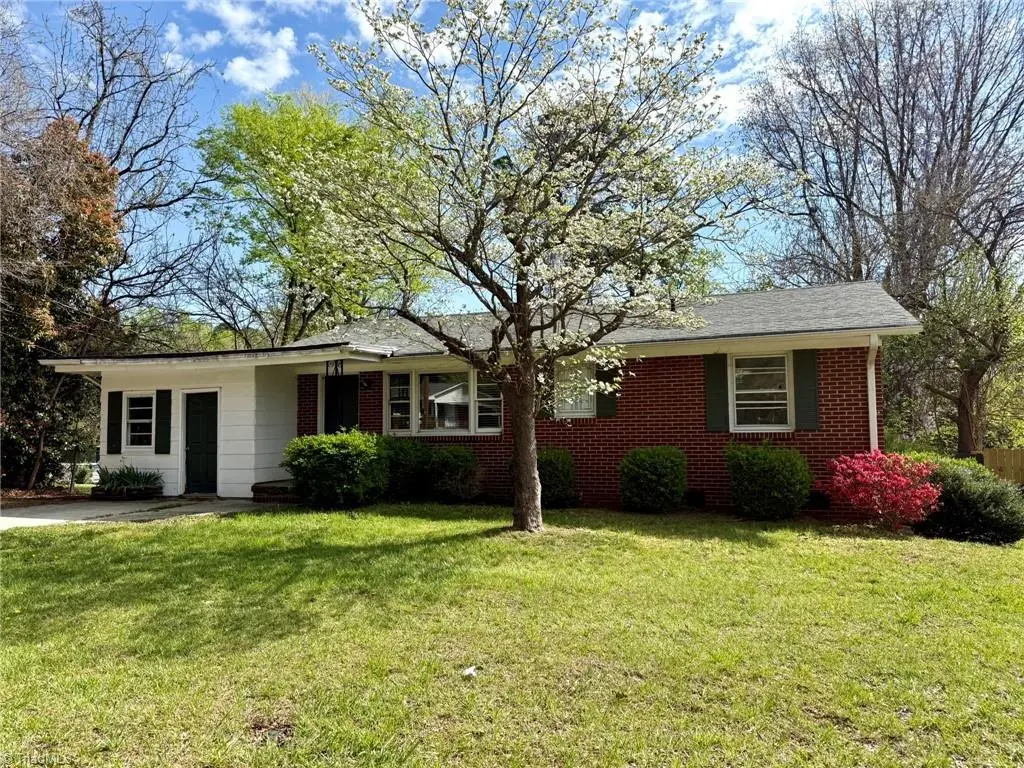
2003 Vanstory St · Greensboro, NC
Flood risk 1/10 · Minimal
- FEMA flood zone
- X (unshaded)
- Chance of flooding over 30 yrs
- 0.0%
- Est. flood insurance / yr
- $507 – $1,088
Fire risk 1/10 · Minimal
- Est. fire insurance / yr
- $906 – $1,684
Heat risk 5/10 · Moderate
- Hot days now (above 103°F)
- 7 days/yr
- Hot days in 30 yrs
- 16 days/yr
Wind risk 4/10 · Minor
- Chance of severe wind over 30 yrs
- 15.0%
Air-quality risk 2/10 · Minimal
- Unhealthy air days now
- 1 days/yr
- Unhealthy air days in 30 yrs
- 1 days/yr
Risk factors via First Street. Map © Google.
Why this score? — see what drove the C- grade
The composite is a weighted blend of 9 inputs, each scored 0–100. Each bar is that input's sub-score; the figure is the points it added to the 100-point composite (weight × sub-score).
- ARV discount +15.0/15.0
- Cash flow +14.7/30.0
- DSCR +4.5/10.0
- Livability +4.0/5.0
- 1% rule +3.8/10.0
- Schools +3.6/10.0
- Rent growth +3.2/5.0
- Condition / age +2.5/5.0
- Appreciation +0.0/10.0
$162,000
🖨 Deal sheet 📄 Offer letter ✓ Due diligence
Listing remarks
PROPERTY BEING SOLD "AS IS, WHERE IS" IN ITS CURRENT CONDITION. SELLER MAKES NO REPRESENTATION OR WARRANTY. SOLID BRICK HOME IN NEED OF COSMETIC REPAIRS.
Key facts
- 0.23 acre lot
- Built 1958
- Listed 55 days
Property features AI
Finance
- Other: Located in the Hilldale Park subdivision; Directions: Gate City Blvd to Vanstory
- HOA & community: No association fee (association listed as Greensboro but association not active)
Exterior
- Parking: Driveway
- Utilities: Public water; Public sewer; Water heater: Unknown; Public maintained road
- Home design: Residential stick/site-built house; One level
- Construction: Built in 1958; Brick construction; Existing structure
- Exterior features: Lot roughly 0.23 acres with dimensions 72 x 188 x 110 x 101; No pool
Interior
- Kitchen: Appliances listed in remarks
- Bedrooms: Bedrooms located on the main level
- Flooring: Flooring details provided in remarks
- Bathrooms: 2 full bathrooms
- Heating & cooling: Heating details provided in remarks; Cooling: Other
- Interior features: Primary bedroom located on the main level; Attic (see remarks); Other interior features noted in remarks
Neighborhood map
What this means for you Summary
Snapshot
- This is a 2-bed/1.0-bath single-family listed at $162k.
Deal economics
- At list price, monthly cash flow is $42 ($501/yr) — positive.
- The deal already cash-flows at list — no discount required.
- To meet the 1% rule (rent ≥ 1% of price), the offer needs to be $142k (12.3% below list).
- Recommended offer: $142k (12.3% below list) — sets the bar for 1% rule.
- Cap rate 6.6% vs local median 3.8% in Greensboro — top-decile yield for the area; either an underpriced asset or a hidden risk that comps aren't pricing in. Stress-test before assuming the spread holds.
Location & tenants
- Location reads 81/100 on livability (#12 in NC, #1,335 nationally) — a professional / high-income tenant draw. Strengths: amenities A+, commute A+, cost of living A+; Watch: employment D, crime F.
- Guilford County Schools (urban): math 39% / reading 45% proficiency, ranked #99 of 178 in NC (top 56%) — families likely to look elsewhere, expect single-tenant / working-renter base with shorter leases.
- Market conditions: Rents rising (+2.8%/yr); 67 active listings in the ZIP; 25 comparable units currently listed for rent nearby; rentals at typical pace (median 23d on market — plan ~3-4 weeks tenant-placement turnaround); 3,843 units permitted in Guilford County in 2024 (2,397 in 5+ unit buildings).
Forward outlook
- Local home prices are declining (-3.0%/yr); year-one equity from $1k of loan paydown is wiped out by about $5k of value loss. Plan a longer hold.
- Guilford County population projected at +26% by 2050 — long-run rental-demand tailwind backs the buy-and-hold thesis.
Negotiation context
- It's been on market 55 days — a 3% lower offer ($157k) is reasonable based on typical stale-listing flexibility.
Risks & watch-outs
- Watch-outs: built in 1958 — expect roof / HVAC / electrical / plumbing capex.
- Climate carrying-cost: extreme-heat days projected 7→16/yr by 2055 (HVAC capex compounding) — expect insurance premiums to compound above CPI over the hold.
Questions for the listing agent
- It's been on market 55 days. Have you received any prior offers? Is the seller open to a 12% concession, seller financing, or rate buy-down credit?
- Built in 1958 — when were the roof, HVAC, electrical panel, plumbing, and water heater last replaced?
- Is there a deadline driving the sale (1031 exchange, divorce, estate, relocation)? That informs how much negotiation room exists.
- Crime grade is F in this area — have there been break-ins, vandalism, or insurance claims at this property in the last 3 years? What carrier currently insures it and at what premium?
- What's the average days-on-market for RENTAL listings here right now (not sales)? A rising rental-DOM trend means longer vacancies and softer asking-rent achievability than the comps imply.
- What's the recent tenant-quality profile in this submarket — average credit score on applications, eviction rate, late-payment / NSF rate, and stable-employment percentage? A property-management company in the area should have these aggregated.
- How much new for-sale + rental construction is in the pipeline within 1–3 miles? Heavy new supply typically softens prices + rents 12–24 months out; constrained supply supports both.
Investment metrics
- 1% rule
- 0.88% ✗
- Cap rate
- 6.60%
- Cash-on-cash
- 1.10%
- DSCR
- 1.05
- GRM
- 9.5
CMA / ARV
- ARV (on-the-fly)
- $233,430
- Comps found
- 12
Show comp detail 12 sales within ~0.75 mi
| Address | Dist | Beds/Ba | Sqft | Sold | Price | $/sf | Match |
|---|---|---|---|---|---|---|---|
| 2710 Hayden St | 0.41mi | 2/2.0 | 1,352 (+8%) | 2mo | $140,000 | $104 | 62 |
| 2301 Ontario St | 0.17mi | 3/2.0 (+1) | 1,099 (-12%) | 2mo | $240,000 | $218 | 61 |
| 2109 Carpenter St | 0.42mi | 3/2.0 (+1) | 1,203 (-4%) | 9mo | $225,000 | $187 | 57 |
| 2023 Lynette Dr | 0.52mi | 3/1.5 (+1) | 1,196 (-5%) | 5mo | $110,000 | $92 | 56 |
| 2200 Crestridge Rd | 0.20mi | 3/1.0 (+1) | 1,066 (-15%) | 7mo | $165,000 | $155 | 55 |
| 2111 Carpenter St | 0.42mi | 3/2.0 (+1) | 1,194 (-5%) | 11mo | $215,000 | $180 | 55 |
| 2107 Carpenter St | 0.43mi | 3/1.5 (+1) | 1,117 (-11%) | 5mo | $245,000 | $219 | 50 |
| 2108 Carpenter St | 0.45mi | 3/2.0 (+1) | 1,120 (-11%) | 7mo | $230,000 | $205 | 46 |
| 3108 Hayden St | 0.66mi | 3/1.5 (+1) | 1,116 (-11%) | 2mo | $192,000 | $172 | 42 |
| 1407 W Meadowview Rd | 0.70mi | 3/2.0 (+1) | 1,383 (+10%) | 4mo | $185,000 | $134 | 38 |
| 1609 Hardie St | 0.62mi | 3/2.5 (+1) | 1,140 (-9%) | 11mo | $247,000 | $217 | 35 |
| 2505 Fontaine Rd | 0.72mi | 3/1.0 (+1) | 1,102 (-12%) | 8mo | $205,000 | $186 | 34 |
Match score weights: distance 35% · size 25% · config 20% · recency 20%. Top-matched comps best support the ARV.
Projected returns pro-forma
-3.0% appreciation · 2.75% rent growth · sell at horizon
- IRR
- -14.8%
- Equity multiple
- 0.47×
- Total profit
- $-23,953
- Equity at exit
- $24,155
- IRR
- -6.6%
- Equity multiple
- 0.58×
- Total profit
- $-18,903
- Equity at exit
- $14,007
Cash invested: $45,360 (down + closing). Projections, not guarantees.
Landlord ↔ Tenant lean methodology
- Overall (STATE)
- 85 Strongly Landlord-Friendly
- State North Carolina
- 85 Strongly Landlord-Friendly · R+3
- County
- — inherits STATE
- City
- — inherits STATE
ZIP-level market 27403
- Rents YoY
- 2.8%
- Active inventory
- 67
- Price-to-rent
- 9.5×
Monthly cashflow live
- Estimated rent
- $1,420 high interval (Pro) →
- Mortgage (P&I)
- −$850
- Tax from tax record
- −$163 /mo · $1,961/yr
- Insurance
- −$68
- HOA
- −$0
- Vacancy / Maint / Mgmt
- −$298
- Net cashflow
- $42
Break-even live
UW: 25.0% down · 7.5% · 30yr · 1.5% tax · 5.0% vac · 8.0% maint · 8.0% mgmt
Financing live
Cash to close
- Down payment
- $40,500
- Closing costs
- $4,860
- Reserves months
- —
- Total cash needed
- —
Loan-product check · same deal, 3 products live
Conventional
25% down · 7.5% · 30yr
- Down + closing
- —
- Monthly P&I
- —
- Monthly cashflow
- —
- DSCR
- —
- Eligible?
- —
Personal DTI + credit; lowest rate.
DSCR
20% down · 8.5% · 30yr
- Down + closing
- —
- Monthly P&I
- —
- Monthly cashflow
- —
- DSCR
- —
- Eligible?
- —
No personal income docs; deal must DSCR.
Hard money
10% down · 12.0% · 12mo
- Down + closing
- —
- Monthly P&I
- —
- Monthly cashflow
- —
- DSCR
- —
- Eligible?
- —
Short-term bridge; refi at stabilization.
Rent comps 25 comps
| Address | Beds | Baths | Sqft | Rent | $/sqft | DOM | Units | Dist |
|---|---|---|---|---|---|---|---|---|
| 1821 W Meadowview Rd Greensboro, NC | 3.0 | 1.5 | 1610 | $1,750 | $1.09 | 23d | 1 | 0.30mi |
| 2212 Coliseum Blvd Greensboro, NC | 3.0 | 2.0 | 1044 | $1,750 | $1.68 | 14d | 1 | 0.53mi |
| 2305 Vanstory St Unit 2305-A Greensboro, NC | 2.0 | 1.5 | 1050 | $1,150 | $1.10 | 19d | 1 | 0.57mi |
| 2202 Maywood St Greensboro, NC | 3.0 | 1.0 | 960 | $1,250 | $1.30 | 14d | 1 | 0.58mi |
| 1606 Pinecroft Rd Greensboro, NC | 1.0–3.0 | 1.0 | 765 | $1,088 | $1.42 | 23d | 1 | 0.67mi |
| 2204 Celeste Ct Greensboro, NC | 3.0 | 1.5 | 1318 | $1,695 | $1.29 | 23d | 1 | 0.67mi |
| 2309 Bridgette Blvd Greensboro, NC | 3.0 | 2.0 | 1400 | $1,600 | $1.14 | 19d | 1 | 0.71mi |
| 2003 Urban Dr Greensboro, NC | 3.0 | 1.5 | 1107 | $1,495 | $1.35 | 21d | 1 | 0.79mi |
| 1636 Willomore St Greensboro, NC | 2.0 | 1.0 | 1070 | $1,330 | $1.24 | 14d | 1 | 1.01mi |
| 2002 Cedar Fork Dr Greensboro, NC | 1.0–2.0 | 1.0–2.0 | 742 | $1,300 | $1.75 | 23d | 1 | 1.03mi |
| 1406 W Florida St Greensboro, NC | 3.0 | 1.0 | 1441 | $1,750 | $1.21 | 23d | 1 | 1.06mi |
| 2705 Four Seasons Blvd Greensboro, NC | 2.0 | 1.5 | 960 | $1,219 | $1.27 | 14d | 3 | 1.09mi |
| 2826 Vanstory St Greensboro, NC | 1.0–2.0 | 1.0–2.0 | 993 | $1,595 | $1.61 | 14d | 22 | 1.11mi |
| 906 Howard St Apt E Greensboro, NC | 3.0 | 2.0 | 1080 | $1,299 | $1.20 | 21d | 1 | 1.19mi |
| 811 Dana Pl Greensboro, NC | 3.0 | 1.0 | 950 | $1,250 | $1.32 | 23d | 1 | 1.25mi |
| 1915 Spring Garden St Greensboro, NC | 2.0–3.0 | 2.0–3.0 | 786 | $695 | $0.88 | 14d | 32 | 1.26mi |
| 3714 West Ave Greensboro, NC | 2.0 | 2.0 | 940 | $1,149 | $1.22 | 21d | 1 | 1.27mi |
| 3712 West Ave Greensboro, NC | 2.0 | 2.0 | 940 | $1,149 | $1.22 | 23d | 1 | 1.29mi |
| 1002 Amesbury Rd Greensboro, NC | 3.0 | 2.0 | 1445 | $2,650 | $1.83 | 23d | 1 | 1.36mi |
| 3203 Cypress Park Rd Unit C Greensboro, NC | 2.0 | 2.5 | 1316 | $1,250 | $0.95 | 23d | 1 | 1.37mi |
| 803 Holliday Dr Greensboro, NC | 2.0 | 2.0 | 1300 | $1,680 | $1.29 | 14d | 18 | 1.37mi |
| 826 W Terrell St Greensboro, NC | 3.0 | 1.0 | 1084 | $1,750 | $1.61 | 23d | 1 | 1.43mi |
| 3755 Oakwood Dr Greensboro, NC | 2.0 | 1.0–1.5 | 850 | $888 | $1.04 | 23d | 2 | 1.44mi |
| 1630 Spring Garden St Unit 1630-C Greensboro, NC | 2.0 | 1.5 | 1080 | $1,300 | $1.20 | 23d | 1 | 1.47mi |
| 1835 Merritt Dr Unit A Greensboro, NC | 2.0 | 1.5 | 950 | $1,025 | $1.08 | 23d | 1 | 1.48mi |
Listing history 9 events
-
2026-06-02status $162,000 Pending 55 DOM
-
2026-06-01days on market $162,000 Due Diligence Period 55 DOM
-
2026-05-31days on market $162,000 Due Diligence Period 54 DOM
-
2026-05-31days on market $162,000 Due Diligence Period 53 DOM
-
2026-05-13historical Due Diligence Period
-
2026-04-27price $162,000
-
2026-04-07$179,900 Active
-
2023-02-03soldstatus $175,000
-
1984-05-01soldstatus $50,000
ⓘ Source: listings_history table (triggers on properties + properties_extension) + one-shot
backfill from property_details.listing_events for pre-trigger history.
Tax reassessment forecast NC · Resets to sale price
- Current annual tax
- $1,961 · $163/mo
- Projected year-2 tax
- $1,961 · $163/mo
- Expected delta
- $0/yr ($0/mo · 0.0%)
ⓘ Screening estimate from a state-policy table — verify with the county assessor before closing.
Climate risk First Street
- Flood 1/10 Low FEMA zone X (unshaded) · 0% chance over 30 yrs
- Wildfire 1/10 Low
- Heat 5/10 Major 7 d/yr ≥103°F today · 16 d/yr by 30 yrs out
- Wind 4/10 Moderate 15% chance of damaging wind over 30 yrs
- Air quality 2/10 Low 1 unhealthy d/yr today · 1 by 30 yrs out
Nearby sold comps map
Loading sold comps map…
Walkable amenities ~0.75 mi
Loading nearby amenities…
Taxation est. · year 1
- Rental income
- $17,046
- − Mortgage interest
- −$9,075
- − Property taxes
- −$1,961
- − Insurance
- −$810
- − Repairs & maintenance
- −$1,364
- − Management
- −$1,364
- − Depreciation
- −$4,713
- Taxable loss
- −$2,240
- Est. tax savings @ 24.0%
- +$538
- After-tax cash flow
- $1,038/yr
For passive investors: Depreciation is non-cash, so a rental often shows a tax loss while cash-flowing — sheltering income. Rental losses are passive: they offset passive income freely, and up to $25,000/yr can offset ordinary (W-2) income if you actively participate and your MAGI is under $100k (phasing out to $0 by $150k); unused losses carry forward. On sale, claimed depreciation is recaptured at up to 25%, and gains may owe capital-gains tax (a 1031 exchange can defer both). Figures are a year-1 estimate at your 24.0% rate — not tax advice; consult a CPA.
Schools (NCES district)
- District
- Guilford County Schools
- NCES district ID
- 3701920
- Math proficiency
- 39% ▲ 1.00%
- Reading proficiency
- 45% ▲ 1.00%
- Median HH income
- $46,315
- Composite
- 35.78/100
- National rank
- #4842
- State rank
- #99 of 178 in NC
Livability — Greensboro
- Score
- 81/100
- State rank
- #12
- US rank
- #1335
Category grades
Schools grade is shown separately in the Schools card above.
Census & demographics
- Census place
- Greensboro, NC
- County
- Guilford County · 487,190 people
- City population
- 329,421
- Metro
- Greensboro-High Point, NC
- Population (ZIP)
- 22,557
- Household income
- $57,917
- Rent vs Own
- Severe rent burden
- 1047.0
Population outlook (Guilford County) Hauer SSP2
- Today (2025)
- 584,596 people
- By 2030
- 616,851 · +5.5%
- By 2040
- 678,451 · +16.1%
- By 2050
- 734,788 · +25.7%
- By 2075
- 862,985 · +47.6%
- By 2100
- 948,704 · +62.3%
Race, ethnicity, and origin ACS 2023
- Neighborhood character
- Diverse neighborhood (Simpson 0.65)
- Race & ethnicity
- White 52% Black 25% Hispanic / Latino 14% Two or more races 10% Asian 5%
- Hispanic origin (detail)
- Mexican 5% Puerto Rican 3%
- Common ancestry
- Slovak 2% Serbian 2% Lithuanian 2%
- Foreign-born
- 10% · Canada, Vietnam, Jamaica
- Languages at home
- 86% English-only · Spanish 8% Other Indo-European 2% Other Asian/Pacific 1%
Political lean MEDSL · Guilford
- 2024 margin
- Strong D (+21.8) · D 60.2% · R 38.4% · Other 1.4%
- 2008→2024 swing
- +3.5pp toward D · 2008: 18.4pp · 2024: 21.8pp
- All cycles
- 2024: D+21.8 2020: D+23.1 2016: D+20.0 2012: D+16.5 2008: D+18.4
Not yet ingested
- Civics
- —
Market trends
- HPI YoY
- ▼ -215.63%
- Current HPI
- 222.3145
- Rent YoY
- ▲ 2.75%
- Metro
- Greensboro-High Point, NC
- State GDP YoY
- ▲ 3.28%
- F500 in state
- 26
Industry mix (Fortune 500 HQ in NC)
| Industry | F500 HQs | Revenue |
|---|---|---|
| Financial Services | 2 | $213B |
|
||
| Retail | 2 | $95B |
|
||
| Industrial Conglomerate | 1 | $38B |
|
||
| Metals / Steel | 1 | $35B |
|
||
| Utilities | 1 | $30B |
|
||
| Industrial Machinery | 1 | $19B |
|
||
Price history
+224.0% since first listed5 events — show timeline
- 2026-05-13 Contingent — Triad MLS
- 2026-04-27 Price Changed $162,000 Triad MLS
- 2026-04-07 Listed $179,900 Triad MLS
- 2023-02-03 Sold (Public Records) $175,000 Public Records
- 1984-05-01 Sold (Public Records) $50,000 Public Records
Property tax history
+5.2%/yrLatest (2025): $1,961 · -1.0% YoY. Source: county tax records.
Cash-flow waterfall
monthlySold comps — $/sqft
last 12 mo · ≤1 miLoading sold comps…