2060 E Mary Lue St · Hernando, FL
Flood risk 1/10 · Minimal
- FEMA flood zone
- X (unshaded)
- Chance of flooding over 30 yrs
- 0.0%
- Est. flood insurance / yr
- $507 – $1,088
Fire risk 4/10 · Minor
- Est. fire insurance / yr
- $947 – $1,759
Heat risk 9/10 · Severe
- Hot days now (above 108°F)
- 7 days/yr
- Hot days in 30 yrs
- 23 days/yr
Wind risk 9/10 · Severe
- Chance of severe wind over 30 yrs
- 99.0%
Air-quality risk 1/10 · Minimal
- Unhealthy air days now
- 0 days/yr
- Unhealthy air days in 30 yrs
- 0 days/yr
Risk factors via First Street. Map © Google.
Why this score? — see what drove the D+ grade
The composite is a weighted blend of 9 inputs, each scored 0–100. Each bar is that input's sub-score; the figure is the points it added to the 100-point composite (weight × sub-score).
- ARV discount +15.0/15.0
- Cash flow +14.4/30.0
- DSCR +4.4/10.0
- Schools +4.1/10.0
- Livability +3.6/5.0
- 1% rule +3.0/10.0
- Rent growth +2.5/5.0
- Condition / age +2.5/5.0
- Appreciation +0.0/10.0
$239,995
🖨 Deal sheet (PDF) 📄 Offer letter ✓ Due diligence
Listing remarks MLS
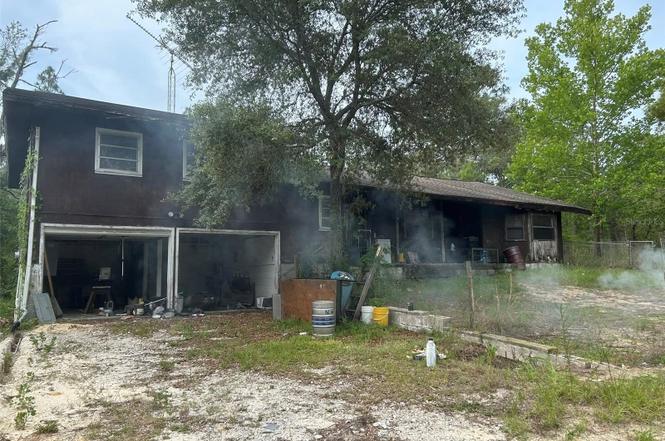
HUGE PRICE REDUCTION!! Nothing cookie cutter about this one! 2 story Ranch Style POOL HOME situated on nearly 5 acres of fenced property - convenient to everything Inverness has to offer! You are going to love the privacy that this one has in store! The floor plan is really unique with soaring ceilings in the living areas and tons of character. Looking for someone to love it - Hurry, this is a great opportunity!
Key facts
- Multiple residences
- Existing structure
- Nearly 5 acres
Tags
Property features AI
Finance
- Other: Lot approximately 4.81 acres (330 x 635, paved road); One well and one septic on the property; No CDD; not marked homestead; Zoning: LDRMH
Exterior
- Parking: Attached garage (2 spaces)
- Utilities: Well water; Septic tank; Electricity available; Water connected
- Home design: Single family residence; Residential property; Two stories; North-facing
- Construction: Frame and wood siding construction; Shingle roof; Slab foundation; Built with year not specified
- Exterior features: Other exterior features; Gunite private pool
Interior
- Kitchen: No appliances listed
- Bedrooms: 2 bedrooms
- Flooring: Other flooring
- Bathrooms: 1 full bath; 2 half baths
- Heating & cooling: Heat pump heating; Central air conditioning
- Interior features: Ceiling fans; Solid wood cabinets; Vaulted ceilings
- Laundry & utility: Laundry inside
Neighborhood map
What this means for you Summary
Snapshot
- This is a 2-bed/2.0-bath single-family listed at $240k.
Deal economics
- At list price, monthly cash flow is $49 ($589/yr) — positive.
- The deal already cash-flows at list — no discount required.
- To meet the 1% rule (rent ≥ 1% of price), the offer needs to be $192k (20.0% below list).
- Recommended offer: $192k (20.0% below list) — sets the bar for 1% rule.
Location & tenants
- Location reads 71/100 on livability (#402 in FL) — a middle-class / working-renter tenant base. Strengths: cost of living A+, housing A+, health & safety A+; Watch: amenities F, commute F, employment D-.
- Citrus (rural): math 49% / reading 50% proficiency, ranked #44 of 73 in FL (top 60%) — families likely to look elsewhere, expect single-tenant / working-renter base with shorter leases.
- Zoned schools: Hernando Elementary School (math 47% / reading 51%, grade D, #1,134 of 2,144 statewide, top 54%, 813 students, 71% FRL); Inverness Middle School (math 52% / reading 48%, grade C, #254 of 571 statewide, top 45%, 1,017 students, 60% FRL); Citrus High School (math 34% / reading 51%, grade F, #264 of 667 statewide, top 41%, 1,503 students, 54% FRL) — zoned schools at 62% FRL track the district average.
- Market conditions: 427 active listings in the ZIP; 3 comparable units currently listed for rent nearby; rentals at typical pace (median 23d on market — plan ~3-4 weeks tenant-placement turnaround); 2,443 units permitted in Citrus County in 2024 (0 in 5+ unit buildings).
- This rent runs 40% of the median local income ($58k/yr) — at the standard rent-burdened threshold; future hikes will face affordability resistance.
Forward outlook
- Local home prices are declining (-3.0%/yr); year-one equity from $2k of loan paydown is wiped out by about $7k of value loss. Plan a longer hold.
- Citrus County population projected to shrink 10% by 2050 — rents likely to lag national; underwrite the cash flow, not the appreciation.
Negotiation context
- It's been on market 348 days — a 12% lower offer ($211k) is reasonable based on typical stale-listing flexibility.
- 5 sale attempts since 12y ago; this cycle's ask is 7% above the opening price — seller raised mid-cycle; expect resistance to lowballs.
Risks & watch-outs
- Climate carrying-cost: severe wind risk, 99% chance of damaging wind over 30y; extreme-heat days projected 7→23/yr by 2055 (HVAC capex compounding) — expect insurance premiums to compound above CPI over the hold.
Questions for the listing agent
- It's been on market 348 days. Have you received any prior offers? Is the seller open to a 20% concession, seller financing, or rate buy-down credit?
- Why hasn't it sold? Are there any deal-killer items the seller is aware of (foundation, flood, title, zoning, code violations)?
- Is there a deadline driving the sale (1031 exchange, divorce, estate, relocation)? That informs how much negotiation room exists.
- The area grade is low — what's the realistic commute time and amenity access for the typical tenant pool here? Any planned neighborhood developments (good or bad) we should know about?
- What's the average days-on-market for RENTAL listings here right now (not sales)? A rising rental-DOM trend means longer vacancies and softer asking-rent achievability than the comps imply.
- What's the recent tenant-quality profile in this submarket — average credit score on applications, eviction rate, late-payment / NSF rate, and stable-employment percentage? A property-management company in the area should have these aggregated.
- How much new for-sale + rental construction is in the pipeline within 1–3 miles? Heavy new supply typically softens prices + rents 12–24 months out; constrained supply supports both.
Investment metrics
- 1% rule
- 0.80% ✗
- Cap rate
- 6.54%
- Cash-on-cash
- 0.88%
- DSCR
- 1.04
- GRM
- 10.4
CMA / ARV
- ARV (on-the-fly)
- $337,824
- Comps found
- 12
Show comp detail 12 sales within ~0.75 mi
| Address | Dist | Beds/Ba | Sqft | Sold | Price | $/sf | Match |
|---|---|---|---|---|---|---|---|
| 2500 E Steven St | 0.48mi | 3/2.0 (+1) | 1,863 (+2%) | 1mo | $392,000 | $210 | 70 |
| 2174 E Celina St | 0.54mi | 3/2.0 (+1) | 1,886 (+3%) | 2mo | $380,000 | $201 | 64 |
| 1191 N Chance Way | 0.43mi | 3/2.0 (+1) | 1,997 (+9%) | 1mo | $425,000 | $213 | 60 |
| 2245 E Marcia St | 0.38mi | 3/2.0 (+1) | 1,610 (-12%) | 1mo | $280,000 | $174 | 56 |
| 1475 E Monopoly Loop | 0.68mi | 3/2.0 (+1) | 1,842 (+0%) | 8mo | $419,000 | $227 | 56 |
| 2617 E Newhaven St | 0.69mi | 3/2.0 (+1) | 1,770 (-4%) | 4mo | $300,000 | $169 | 53 |
| 1183 N Chance Way | 0.45mi | 3/2.0 (+1) | 1,975 (+8%) | 10mo | $230,000 | $116 | 53 |
| 1105 N Mediterranean Way | 0.71mi | 3/3.0 (+1) | 1,876 (+2%) | 6mo | $150,000 | $80 | 49 |
| 2740 E Steven St | 0.72mi | 3/2.0 (+1) | 1,741 (-5%) | 8mo | $320,000 | $184 | 47 |
| 2061 E Celina St | 0.49mi | 3/2.5 (+1) | 1,585 (-14%) | 6mo | $267,500 | $169 | 43 |
| 1457 E Saint James Loop | 0.64mi | 3/2.0 (+1) | 1,676 (-9%) | 9mo | $315,000 | $188 | 43 |
| 2499 E Harley St | 0.54mi | 3/2.0 (+1) | 1,588 (-14%) | 8mo | $292,500 | $184 | 41 |
Match score weights: distance 35% · size 25% · config 20% · recency 20%. Top-matched comps best support the ARV.
Projected returns pro-forma
-3.0% appreciation · 3.0% rent growth · sell at horizon
- IRR
- -14.9%
- Equity multiple
- 0.47×
- Total profit
- $-35,854
- Equity at exit
- $35,784
- IRR
- -6.4%
- Equity multiple
- 0.59×
- Total profit
- $-27,556
- Equity at exit
- $20,750
Cash invested: $67,199 (down + closing). Projections, not guarantees.
Landlord ↔ Tenant lean methodology
- Overall (STATE)
- 87 Strongly Landlord-Friendly
- State Florida
- 87 Strongly Landlord-Friendly · R+3
- County
- — inherits STATE
- City
- — inherits STATE
ZIP-level market 34453
- Home prices YoY
- -26.1%
- Active inventory
- 427
- Price-to-rent
- 10.4×
Monthly cashflow live
- Estimated rent
- $1,920 medium interval (Pro) →
- Mortgage (P&I)
- −$1,259
- Tax from tax record
- −$109 /mo · $1,311/yr
- Insurance
- −$100
- HOA
- −$0
- Vacancy / Maint / Mgmt
- −$403
- Net cashflow
- $49
Break-even live
Sensitivity live
| Price | -10% $185 | -5% $117 | +0% $49 | +5% $-19 | +10% $-87 |
|---|---|---|---|---|---|
| Rent | -10% $-103 | -5% $-27 | +0% $49 | +5% $125 | +10% $201 |
| Rate | -1.0pp $170 | -0.5pp $110 | base $49 | +0.5pp $-13 | +1.0pp $-76 |
UW: 25.0% down · 7.5% · 30yr · 1.5% tax · 5.0% vac · 8.0% maint · 8.0% mgmt
Financing live
Cash to close
- Down payment
- $59,999
- Closing costs
- $7,200
- Reserves months
- —
- Total cash needed
- —
Loan-product check · same deal, 3 products live
Conventional
25% down · 7.5% · 30yr
- Down + closing
- —
- Monthly P&I
- —
- Monthly cashflow
- —
- DSCR
- —
- Eligible?
- —
Personal DTI + credit; lowest rate.
DSCR
20% down · 8.5% · 30yr
- Down + closing
- —
- Monthly P&I
- —
- Monthly cashflow
- —
- DSCR
- —
- Eligible?
- —
No personal income docs; deal must DSCR.
Hard money
10% down · 12.0% · 12mo
- Down + closing
- —
- Monthly P&I
- —
- Monthly cashflow
- —
- DSCR
- —
- Eligible?
- —
Short-term bridge; refi at stabilization.
Rent comps 3 comps
| Address | Beds | Baths | Sqft | Rent | $/sqft | DOM | Units | Dist |
|---|---|---|---|---|---|---|---|---|
| 1471 E Saint James Loop Inverness, FL | 3.0 | 2.0 | 1228 | $1,700 | $1.38 | 22d | 1 | 0.63mi |
| 2620 E Newhaven St Inverness, FL | 3.0 | 2.0 | 1884 | $2,400 | $1.27 | 22d | 1 | 0.73mi |
| 790 E Gilchrist Ct Unit 2B Hernando, FL | 2.0 | 2.5 | 1320 | $2,000 | $1.52 | 22d | 1 | 1.29mi |
Listing history 22 events
-
2026-06-13status $239,995 Pending 348 DOM
-
2026-06-09days on market $239,995 Active 348 DOM
-
2026-06-08days on market $239,995 Active 347 DOM
-
2026-06-03days on market $239,995 Active 342 DOM
-
2026-06-02days on market $239,995 Active 341 DOM
-
2026-06-01days on market $239,995 Active 340 DOM
-
2026-05-31days on market $239,995 Active 339 DOM
-
2026-05-30days on market $239,995 Active 338 DOM
-
2025-08-05status Active
-
2025-08-05price $239,995
-
2025-07-30status Pending
-
2025-06-21price $250,000
-
2025-06-21$225,000 Active
-
2025-05-12historical
-
2025-04-23status Active
-
2025-04-23price $265,000
-
2025-03-25historical
-
2025-03-13$345,000 Active
-
2019-02-19soldstatus $950,000
-
2015-05-19soldstatus $52,500 415-char remark
Show marketing remark (415 chars)
HUGE PRICE REDUCTION!! Nothing cookie cutter about this one! 2 story Ranch Style POOL HOME situated on nearly 5 acres of fenced property - convenient to everything Inverness has to offer! You are going to love the privacy that this one has in store! The floor plan is really unique with soaring ceilings in the living areas and tons of character. Looking for someone to love it - Hurry, this is a great opportunity!
-
2014-11-03$80,100 415-char remark
Show marketing remark (415 chars)
HUGE PRICE REDUCTION!! Nothing cookie cutter about this one! 2 story Ranch Style POOL HOME situated on nearly 5 acres of fenced property - convenient to everything Inverness has to offer! You are going to love the privacy that this one has in store! The floor plan is really unique with soaring ceilings in the living areas and tons of character. Looking for someone to love it - Hurry, this is a great opportunity!
-
2004-07-20soldstatus $86,500
ⓘ Source: listings_history table (triggers on properties + properties_extension) + one-shot
backfill from property_details.listing_events for pre-trigger history.
Tax reassessment forecast FL · Resets to sale price
- Current annual tax
- $1,311 · $109/mo
- Projected year-2 tax
- $1,992 · $166/mo
- Expected delta
- +$681/yr (+$57/mo · 51.9%)
ⓘ Screening estimate from a state-policy table — verify with the county assessor before closing.
Climate risk First Street
- Flood 1/10 Low FEMA zone X (unshaded) · 0% chance over 30 yrs
- Wildfire 4/10 Moderate
- Heat 9/10 Extreme 7 d/yr ≥108°F today · 23 d/yr by 30 yrs out
- Wind 9/10 Extreme 99% chance of damaging wind over 30 yrs
- Air quality 1/10 Low 0 unhealthy d/yr today · 0 by 30 yrs out
Nearby sold comps map
Loading sold comps map…
Walkable amenities ~0.75 mi
Loading nearby amenities…
Taxation est. · year 1
- Rental income
- $23,041
- − Mortgage interest
- −$13,443
- − Property taxes
- −$1,311
- − Insurance
- −$1,200
- − Repairs & maintenance
- −$1,843
- − Management
- −$1,843
- − Depreciation
- −$6,982
- Taxable loss
- −$3,582
- Est. tax savings @ 24.0%
- +$860
- After-tax cash flow
- $1,448/yr
For passive investors: Depreciation is non-cash, so a rental often shows a tax loss while cash-flowing — sheltering income. Rental losses are passive: they offset passive income freely, and up to $25,000/yr can offset ordinary (W-2) income if you actively participate and your MAGI is under $100k (phasing out to $0 by $150k); unused losses carry forward. On sale, claimed depreciation is recaptured at up to 25%, and gains may owe capital-gains tax (a 1031 exchange can defer both). Figures are a year-1 estimate at your 24.0% rate — not tax advice; consult a CPA.
Schools (NCES district)
- District
- Citrus
- NCES district ID
- 1200270
- Math proficiency
- 49% ▼ -10.00%
- Reading proficiency
- 50% ▼ -6.00%
- Median HH income
- $38,618
- Composite
- 41.28/100
- National rank
- #3519
- State rank
- #44 of 73 in FL
Livability — Hernando
- Score
- 71/100
- State rank
- #402
- US rank
- #7137
Category grades
Schools grade is shown separately in the Schools card above.
Census & demographics
- Census place
- Hernando, FL
- County
- Citrus County · 111,314 people
- City population
- 17,281
- Metro
- Homosassa Springs, FL
- Population (ZIP)
- 10,621
- Household income
- $57,568
- Rent vs Own
- Severe rent burden
- 240.0
Population outlook (Citrus County) Hauer SSP2
- Today (2025)
- 138,622 people
- By 2030
- 136,886 · -1.3%
- By 2040
- 132,009 · -4.8%
- By 2050
- 125,196 · -9.7%
- By 2075
- 108,570 · -21.7%
- By 2100
- 84,454 · -39.1%
Race, ethnicity, and origin ACS 2023
- Neighborhood character
- Predominantly White (87%)
- Race & ethnicity
- White 87% Hispanic / Latino 6% Black 3% Two or more races 3% Asian 2%
- Hispanic origin (detail)
- Puerto Rican 2%
- Common ancestry
- Lithuanian 3% Romanian 3% Italian 3%
- Foreign-born
- 4% · Canada
- Languages at home
- 94% English-only · Spanish 4% Tagalog/Filipino 1% Other Asian/Pacific 0%
Political lean MEDSL · Citrus
- 2024 margin
- Solid R (+45.9) · D 26.8% · R 72.6%
- 2008→2024 swing
- -29.8pp toward R · 2008: -16.1pp · 2024: -45.9pp
- All cycles
- 2024: R+45.9 2020: R+41.0 2016: R+39.7 2012: R+21.9 2008: R+16.1
Not yet ingested
- Civics
- —
Market trends
- HPI YoY
- ▼ -103.32%
- Current HPI
- 291.8965
- Rent YoY
- —
- Metro
- Homosassa Springs, FL
- State GDP YoY
- ▲ 3.28%
- F500 in state
- 36
Industry mix (Fortune 500 HQ in FL)
| Industry | F500 HQs | Revenue |
|---|---|---|
| Industrial Technology | 2 | $29B |
|
||
| Insurance | 2 | $17B |
|
||
| Retail | 1 | $60B |
|
||
| Technology Distribution | 1 | $58B |
|
||
| Homebuilding | 1 | $35B |
|
||
| Technology Manufacturing | 1 | $35B |
|
||
Price history
+177.5% since first listed14 events — show timeline
- 2025-08-05 Relisted — Stellar MLS as Distributed by MLS Grid
- 2025-08-05 Price Changed $239,995 Stellar MLS as Distributed by MLS Grid
- 2025-07-30 Pending — Stellar MLS as Distributed by MLS Grid
- 2025-06-21 Price Changed $250,000 Stellar MLS as Distributed by MLS Grid
- 2025-06-21 Listed $225,000 Stellar MLS as Distributed by MLS Grid
- 2025-05-12 Listing Removed — Stellar MLS as Distributed by MLS Grid
- 2025-04-23 Relisted — Stellar MLS as Distributed by MLS Grid
- 2025-04-23 Price Changed $265,000 Stellar MLS as Distributed by MLS Grid
- 2025-03-25 Listing Removed — Stellar MLS as Distributed by MLS Grid
- 2025-03-13 Listed $345,000 Stellar MLS as Distributed by MLS Grid
- 2019-02-19 Sold (Public Records) $950,000 Public Records
- 2015-05-19 Sold (MLS) $52,500 Stellar MLS as Distributed by MLS Grid
- 2014-11-03 Listed $80,100 Stellar MLS as Distributed by MLS Grid
- 2004-07-20 Sold (Public Records) $86,500 Public Records
Property tax history
-3.1%/yrLatest (2025): $1,311 · +7.2% YoY. Source: county tax records.
Cash-flow waterfall
monthlySold comps — $/sqft
last 12 mo · ≤1 miLoading sold comps…