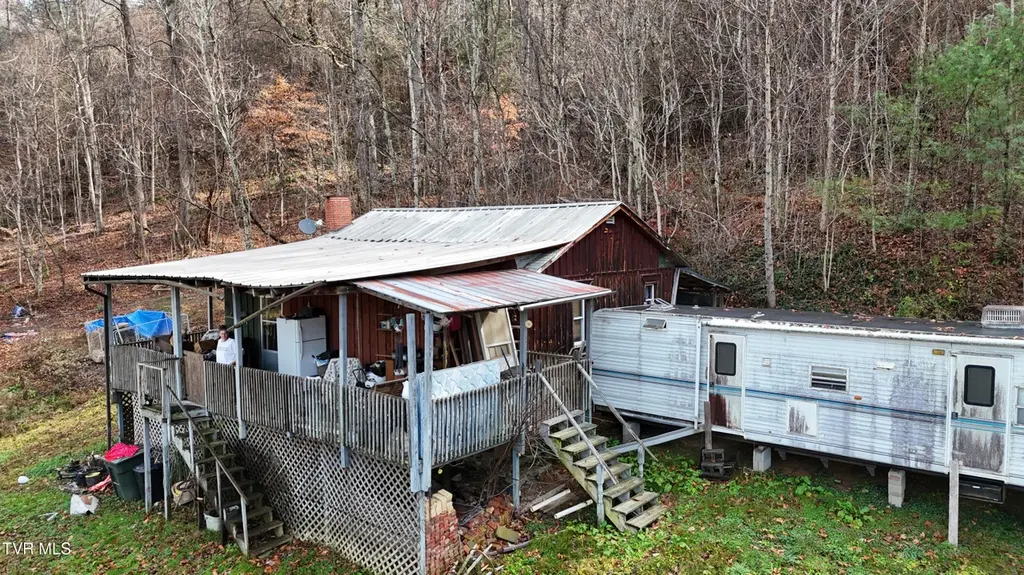
1704 Main Ave · Erwin, TN
Flood risk 1/10 · Minimal
- FEMA flood zone
- X (unshaded)
- Chance of flooding over 30 yrs
- 0.0%
- Est. flood insurance / yr
- $507 – $1,088
Fire risk 4/10 · Minor
- Est. fire insurance / yr
- $949 – $1,763
Heat risk 4/10 · Minor
- Hot days now (above 93°F)
- 8 days/yr
- Hot days in 30 yrs
- 24 days/yr
Wind risk 2/10 · Minimal
- Chance of severe wind over 30 yrs
- —
Air-quality risk 2/10 · Minimal
- Unhealthy air days now
- 1 days/yr
- Unhealthy air days in 30 yrs
- 1 days/yr
Risk factors via First Street. Map © Google.
Why this score? — see what drove the B- grade
The composite is a weighted blend of 9 inputs, each scored 0–100. Each bar is that input's sub-score; the figure is the points it added to the 100-point composite (weight × sub-score).
- Cash flow +30.0/30.0
- 1% rule +10.0/10.0
- DSCR +10.0/10.0
- ARV discount +7.5/15.0
- Livability +3.1/5.0
- Rent growth +2.5/5.0
- Condition / age +2.5/5.0
- Schools +2.1/10.0
- Appreciation +0.9/10.0
$79,900
🖨 Deal sheet (PDF) 📄 Offer letter ✓ Due diligence
Listing remarks MLS
THE HOME IS ''BEING SOLD AS IS'' THERE ARE NO WARRANTIES WITH THE HOME; 952 SQUARE FEET OF LIVING SPACE; WOOD STOVE AS THE MAIN SOURCE OF HEAT; COVERED FRONT PORCH AREA;
Key facts
- Wood stove
- Built 1952
- Listed 215 days
Tags
Neighborhood map
What this means for you Summary
Snapshot
- This is a 1-bed/1.0-bath single-family listed at $80k.
Deal economics
- At list price, monthly cash flow is $475 ($6k/yr) — positive.
- The deal already cash-flows at list — no discount required.
- Meets the 1% rule at list price ($1k rent vs $80k).
- Recommended offer: $70k (12.0% below list) — sets the bar for market timing.
- Cap rate 13.4% vs local median 3.5% in Erwin — top-decile yield for the area; either an underpriced asset or a hidden risk that comps aren't pricing in. Stress-test before assuming the spread holds.
Location & tenants
- Location reads 61/100 on livability (#241 in TN) — a middle-class / working-renter tenant base. Strengths: cost of living A+, housing A+; Watch: crime F, amenities F, commute F.
- Unicoi County (town): math 25% / reading 26% proficiency, ranked #88 of 139 in TN (top 63%) — low school quality limits family demand, transient renter base, plan for 1-2y turnover.
- Zoned schools: Unicoi Elementary (math 22% / reading 22%, grade F, #601 of 952 statewide, top 66%, 317 students, 0% FRL); Unicoi Co Middle School (math 26% / reading 22%, grade F, #160 of 333 statewide, top 48%, 446 students, 0% FRL); Unicoi Co High School (math 8% / reading 34%, grade F, #174 of 332 statewide, top 52%, 713 students, 0% FRL) — zoned schools average 0% FRL vs 50% district-wide (50 pts lower); this property's tenant base skews higher-income than the district average.
- Market conditions: 74 active listings in the ZIP; 24 units permitted in Unicoi County in 2024 (0 in 5+ unit buildings).
Forward outlook
- Local home prices are declining (-3.0%/yr); year-one equity from $552 of loan paydown is wiped out by about $2k of value loss. Plan a longer hold.
- Unicoi County population projected at -16% by 2050 — secular population decline; favor cash flow + early exit over multi-decade hold.
- At projected returns (-3.0% appreciation + 3.0% rent growth), your $22k cash investment doubles in ~5 years — after that, you're playing with house money.
Negotiation context
- It's been on market 215 days — a 12% lower offer ($70k) is reasonable based on typical stale-listing flexibility.
- 2 sale attempts with the ask held roughly flat each time — persistent listings suggest the price (not the market) is what's stuck; bring a comps-based counter.
- Current owner paid $20k; list at $80k implies a 300% gain — meaningful room to come down on a strong offer.
Risks & watch-outs
- Watch-outs: built in 1952 — expect roof / HVAC / electrical / plumbing capex.
Questions for the listing agent
- It's been on market 215 days. Have you received any prior offers? Is the seller open to a 12% concession, seller financing, or rate buy-down credit?
- Built in 1952 — when were the roof, HVAC, electrical panel, plumbing, and water heater last replaced?
- Why hasn't it sold? Are there any deal-killer items the seller is aware of (foundation, flood, title, zoning, code violations)?
- Is there a deadline driving the sale (1031 exchange, divorce, estate, relocation)? That informs how much negotiation room exists.
- Schools are F-rated, which usually means shorter tenancies and higher turnover. Who's the typical renter profile here, and what's been the actual vacancy rate?
- Crime grade is F in this area — have there been break-ins, vandalism, or insurance claims at this property in the last 3 years? What carrier currently insures it and at what premium?
- What's the average days-on-market for RENTAL listings here right now (not sales)? A rising rental-DOM trend means longer vacancies and softer asking-rent achievability than the comps imply.
- What's the recent tenant-quality profile in this submarket — average credit score on applications, eviction rate, late-payment / NSF rate, and stable-employment percentage? A property-management company in the area should have these aggregated.
- How much new for-sale + rental construction is in the pipeline within 1–3 miles? Heavy new supply typically softens prices + rents 12–24 months out; constrained supply supports both.
Investment metrics
- 1% rule
- 1.54% ✓
- Cap rate
- 13.42%
- Cash-on-cash
- 25.46%
- DSCR
- 2.13
- GRM
- 5.4
CMA / ARV
- ARV (median comp)
- $190,266
- List price
- $79,900
- Delta
- -58.01%
- Verdict
- UNDERPRICED
- Comps
- 7 within 1.0 mi
Show comp detail 1 sale within ~0.75 mi
| Address | Dist | Beds/Ba | Sqft | Sold | Price | $/sf | Match |
|---|---|---|---|---|---|---|---|
| 1830 Main St Unit A3 | 0.64mi | 2/1.5 (+1) | 1,050 (+10%) | 11mo | $1,100 | $1 | 37 |
Match score weights: distance 35% · size 25% · config 20% · recency 20%. Top-matched comps best support the ARV.
Projected returns pro-forma
-3.0% appreciation · 3.0% rent growth · sell at horizon
- IRR
- 19.0%
- Equity multiple
- 1.77×
- Total profit
- $17,275
- Equity at exit
- $11,913
- IRR
- 27.3%
- Equity multiple
- 3.41×
- Total profit
- $53,918
- Equity at exit
- $6,908
Cash invested: $22,372 (down + closing). Projections, not guarantees.
Landlord ↔ Tenant lean methodology
- Overall (STATE)
- 87 Strongly Landlord-Friendly
- State Tennessee
- 87 Strongly Landlord-Friendly · R+13
- County
- — inherits STATE
- City
- — inherits STATE
ZIP-level market 37650
- Home prices YoY
- -2.7%
- Active inventory
- 74
- Price-to-rent
- 5.4×
Monthly cashflow live
- Estimated rent
- $1,232 medium interval (Pro) →
- Mortgage (P&I)
- −$419
- Tax from tax record
- −$46 /mo · $557/yr
- Insurance
- −$33
- HOA
- −$0
- Lot rent
- −$0
- Vacancy / Maint / Mgmt
- −$259
- Net cashflow
- $475
Break-even live
Sensitivity live
| Price | -10% $520 | -5% $497 | +0% $475 | +5% $452 | +10% $430 |
|---|---|---|---|---|---|
| Rent | -10% $377 | -5% $426 | +0% $475 | +5% $523 | +10% $572 |
| Rate | -1.0pp $515 | -0.5pp $495 | base $475 | +0.5pp $454 | +1.0pp $433 |
UW: 25.0% down · 7.5% · 30yr · 1.5% tax · 5.0% vac · 8.0% maint · 8.0% mgmt
Financing live
Cash to close
- Down payment
- $19,975
- Closing costs
- $2,397
- Reserves months
- —
- Total cash needed
- —
Loan-product check · same deal, 3 products live
Conventional
25% down · 7.5% · 30yr
- Down + closing
- —
- Monthly P&I
- —
- Monthly cashflow
- —
- DSCR
- —
- Eligible?
- —
Personal DTI + credit; lowest rate.
DSCR
20% down · 8.5% · 30yr
- Down + closing
- —
- Monthly P&I
- —
- Monthly cashflow
- —
- DSCR
- —
- Eligible?
- —
No personal income docs; deal must DSCR.
Hard money
10% down · 12.0% · 12mo
- Down + closing
- —
- Monthly P&I
- —
- Monthly cashflow
- —
- DSCR
- —
- Eligible?
- —
Short-term bridge; refi at stabilization.
Listing history 23 events
-
2026-06-22days on market $79,900 Active 215 DOM
-
2026-06-19days on market $79,900 Active 213 DOM
-
2026-06-18days on market $79,900 Active 212 DOM
-
2026-06-17days on market $79,900 Active 211 DOM
-
2026-06-16days on market $79,900 Active 210 DOM
-
2026-06-15days on market $79,900 Active 209 DOM
-
2026-06-14days on market $79,900 Active 207 DOM
-
2026-06-13days on market $79,900 Active 206 DOM
-
2026-06-10days on market $79,900 Active 204 DOM
-
2026-06-09days on market $79,900 Active 203 DOM
-
2026-06-08days on market $79,900 Active 202 DOM
-
2026-06-07days on market $79,900 Active 201 DOM
-
2026-06-05days on market $79,900 Active 198 DOM
-
2026-06-03days on market $79,900 Active 197 DOM
-
2026-06-02days on market $79,900 Active 196 DOM
-
2026-06-01days on market $79,900 Active 195 DOM
-
2026-05-31days on market $79,900 Active 194 DOM
-
2026-05-30days on market $79,900 Active 193 DOM
-
2026-04-15status Active 169-char remark
Show marketing remark (169 chars)
THE HOME IS ''BEING SOLD AS IS'' THERE ARE NO WARRANTIES WITH THE HOME; 952 SQUARE FEET OF LIVING SPACE; WOOD STOVE AS THE MAIN SOURCE OF HEAT; COVERED FRONT PORCH AREA;
-
2026-04-07historical Active Under Contract 169-char remark
Show marketing remark (169 chars)
THE HOME IS ''BEING SOLD AS IS'' THERE ARE NO WARRANTIES WITH THE HOME; 952 SQUARE FEET OF LIVING SPACE; WOOD STOVE AS THE MAIN SOURCE OF HEAT; COVERED FRONT PORCH AREA;
-
2025-11-17$79,900 Active 169-char remark
Show marketing remark (169 chars)
THE HOME IS ''BEING SOLD AS IS'' THERE ARE NO WARRANTIES WITH THE HOME; 952 SQUARE FEET OF LIVING SPACE; WOOD STOVE AS THE MAIN SOURCE OF HEAT; COVERED FRONT PORCH AREA;
-
1989-03-31soldstatus $20,000
-
1983-01-01soldstatus $9,000
ⓘ Source: listings_history table (triggers on properties + properties_extension) + one-shot
backfill from property_details.listing_events for pre-trigger history.
Tax reassessment forecast TN · Resets to sale price
- Current annual tax
- $557 · $46/mo
- Projected year-2 tax
- $567 · $47/mo
- Expected delta
- +$10/yr (+$1/mo · 1.8%)
ⓘ Screening estimate from a state-policy table — verify with the county assessor before closing.
Climate risk First Street
- Flood 1/10 Low FEMA zone X (unshaded) · 0% chance over 30 yrs
- Wildfire 4/10 Moderate
- Heat 4/10 Moderate 8 d/yr ≥93°F today · 24 d/yr by 30 yrs out
- Wind 2/10 Low
- Air quality 2/10 Low 1 unhealthy d/yr today · 1 by 30 yrs out
Nearby sold comps map
Loading sold comps map…
Walkable amenities ~0.75 mi
Loading nearby amenities…
Taxation est. · year 1
- Rental income
- $14,787
- − Mortgage interest
- −$4,476
- − Property taxes
- −$557
- − Insurance
- −$400
- − Repairs & maintenance
- −$1,183
- − Management
- −$1,183
- − Depreciation
- −$2,324
- Taxable income
- $4,664
- Est. tax owed @ 24.0%
- −$1,119
- After-tax cash flow
- $4,577/yr
For passive investors: Depreciation is non-cash, so a rental often shows a tax loss while cash-flowing — sheltering income. Rental losses are passive: they offset passive income freely, and up to $25,000/yr can offset ordinary (W-2) income if you actively participate and your MAGI is under $100k (phasing out to $0 by $150k); unused losses carry forward. On sale, claimed depreciation is recaptured at up to 25%, and gains may owe capital-gains tax (a 1031 exchange can defer both). Figures are a year-1 estimate at your 24.0% rate — not tax advice; consult a CPA.
Schools (NCES district)
- District
- Unicoi County
- NCES district ID
- 4704230
- Math proficiency
- 25% ▼ -8.00%
- Reading proficiency
- 26% ▼ -4.00%
- Median HH income
- $35,366
- Composite
- 21.08/100
- National rank
- #8443
- State rank
- #88 of 139 in TN
Livability — Erwin
- Score
- 61/100
- State rank
- #241
- US rank
- #17531
Category grades
Schools grade is shown separately in the Schools card above.
Census & demographics
- Population (ZIP)
- 13,109
Population outlook (Unicoi County) Hauer SSP2
- Today (2025)
- 17,083 people
- By 2030
- 16,570 · -3.0%
- By 2040
- 15,389 · -9.9%
- By 2050
- 14,270 · -16.5%
- By 2075
- 12,302 · -28.0%
- By 2100
- 10,812 · -36.7%
Race, ethnicity, and origin ACS 2023
- Neighborhood character
- Predominantly White (93%)
- Race & ethnicity
- White 93% Hispanic / Latino 5% Two or more races 5%
- Hispanic origin (detail)
- Mexican 4%
- Common ancestry
- Slovak 2% Romanian 1% Iranian 1%
- Foreign-born
- 1% · Canada
- Languages at home
- 95% English-only · Spanish 4%
Political lean MEDSL · Unicoi
- 2024 margin
- Solid R (+62.0) · D 18.5% · R 80.5% · Other 1.0%
- 2008→2024 swing
- -21.8pp toward R · 2008: -40.2pp · 2024: -62.0pp
- All cycles
- 2024: R+62.0 2020: R+60.0 2016: R+61.5 2012: R+44.1 2008: R+40.2
Not yet ingested
- Civics
- —
Market trends
- HPI YoY
- ▼ -8.18%
- Current HPI
- 290.1171
- Rent YoY
- —
- Metro
- —
- State GDP YoY
- ▲ 2.78%
- F500 in state
- 22
Industry mix (Fortune 500 HQ in TN)
| Industry | F500 HQs | Revenue |
|---|---|---|
| Healthcare | 3 | $91B |
|
||
| Retail | 3 | $72B |
|
||
| Transportation / Logistics | 1 | $88B |
|
||
| Paper / Packaging | 1 | $19B |
|
||
| Insurance | 1 | $13B |
|
||
| Energy | 1 | $12B |
|
||
Price history
+787.8% since first listed5 events — show timeline
- 2026-04-15 Relisted — TVRMLS
- 2026-04-07 Contingent — TVRMLS
- 2025-11-17 Listed $79,900 TVRMLS
- 1989-03-31 Sold (Public Records) $20,000 Public Records
- 1983-01-01 Sold (Public Records) $9,000 Public Records
Property tax history
+3.5%/yrLatest (2025): $557 · -7.2% YoY. Source: county tax records.
Cash-flow waterfall
monthlySold comps — $/sqft
last 12 mo · ≤1 miLoading sold comps…