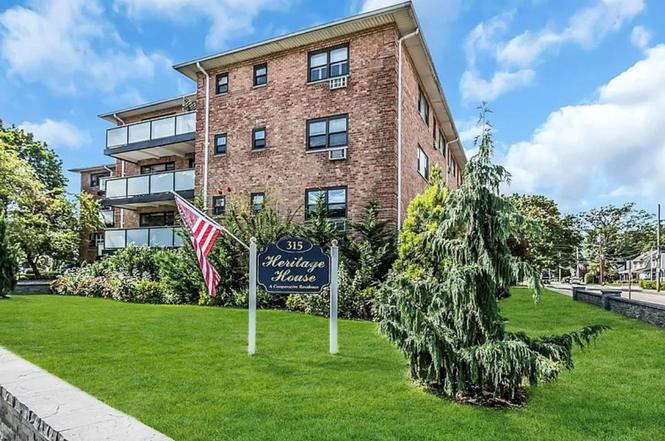
315 Atlantic Ave Unit 1A · East Rockaway, NY
Flood risk 4/10 · Minor
- FEMA flood zone
- X (unshaded)
- Chance of flooding over 30 yrs
- 0.13%
- Est. flood insurance / yr
- $507 – $1,088
Fire risk 1/10 · Minimal
- Est. fire insurance / yr
- $691 – $1,283
Heat risk 6/10 · Moderate
- Hot days now (above 95°F)
- 7 days/yr
- Hot days in 30 yrs
- 16 days/yr
Wind risk 6/10 · Moderate
- Chance of severe wind over 30 yrs
- 71.0%
Air-quality risk 4/10 · Minor
- Unhealthy air days now
- 4 days/yr
- Unhealthy air days in 30 yrs
- 6 days/yr
Risk factors via First Street. Map © Google.
Why this score? — see what drove the C- grade
The composite is a weighted blend of 9 inputs, each scored 0–100. Each bar is that input's sub-score; the figure is the points it added to the 100-point composite (weight × sub-score).
- Cash flow +20.5/30.0
- ARV discount +7.5/15.0
- DSCR +6.5/10.0
- Schools +5.7/10.0
- 1% rule +5.4/10.0
- Livability +4.2/5.0
- Rent growth +2.5/5.0
- Condition / age +2.5/5.0
- Appreciation +0.0/10.0
$299,000
🖨 Deal sheet (PDF) 📄 Offer letter ✓ Due diligence
Listing remarks
AO -1/24/26 Welcome to Heritage House! This fantastic elevator building offers a bright and spacious co-op, presenting a fantastic opportunity for those looking to add their personal touch. The unit is a blank canvas, needing some TLC to transform it into your dream home, and is perfectly situated just a few blocks from the LIRR for an easy commute. The residence features a king-size bedroom with a walk-in closet and a second closet, a good-sized bathroom, and a large living room perfect for entertaining. Step out from the living room onto your private balcony overlooking the front, ideal for your morning coffee or evening relaxation. Enjoy a kitchen with stainless steel appliances, includi
Key facts
- Pantry
- Private balcony
- Natural light
Tags
Neighborhood map
What this means for you Summary
Snapshot
- This is a 1-bed/1.0-bath condo listed at $299k.
Deal economics
- At list price, monthly cash flow is $393 ($5k/yr) — positive.
- The deal already cash-flows at list — no discount required.
- Meets the 1% rule at list price ($3k rent vs $299k).
- Recommended offer: $263k (12.0% below list) — sets the bar for market timing.
- Cap rate 7.9% vs local median 3.0% in East Rockaway — top-decile yield for the area; either an underpriced asset or a hidden risk that comps aren't pricing in. Stress-test before assuming the spread holds.
Location & tenants
- Location reads 84/100 on livability (#47 in NY, #741 nationally) — a professional / high-income tenant draw. Strengths: crime A+, amenities A+, commute A+; Watch: cost of living F.
- East Rockaway Union Free School District (suburban): math 61% / reading 67% proficiency, ranked #165 of 590 in NY (top 28%) — acceptable for families but not a draw, mixed tenant base, ~2y average lease; only 20% free/reduced lunch — higher-income household profile.
- Zoned schools: Rhame Avenue Elementary School (math 42% / reading 62%, grade C-, #988 of 2,108 statewide, top 49%, 312 students, 0% FRL); East Rockaway Junior-Senior High School (math 77% / reading 67%, grade B+, #677 of 1,100 statewide, top 63%, 583 students, 0% FRL) — zoned schools average 0% FRL vs 20% district-wide (20 pts lower); this property's tenant base skews higher-income than the district average.
- Market conditions: 92 active listings in the ZIP; 12 comparable units currently listed for rent nearby; rentals at typical pace (median 25d on market — plan ~3-4 weeks tenant-placement turnaround); 824 units permitted in Nassau County in 2024 (153 in 5+ unit buildings).
Forward outlook
- Local home prices are declining (-3.0%/yr); year-one equity from $2k of loan paydown is wiped out by about $9k of value loss. Plan a longer hold.
- Nassau County population projected at +7% by 2050 — modest demand growth; plan on rents tracking national, not racing it.
Negotiation context
- It's been on market 153 days — a 12% lower offer ($263k) is reasonable based on typical stale-listing flexibility.
Risks & watch-outs
- Climate carrying-cost: major wind risk, 71% chance of damaging wind over 30y; extreme-heat days projected 7→16/yr by 2055 (HVAC capex compounding) — expect insurance premiums to compound above CPI over the hold.
Questions for the listing agent
- It's been on market 153 days. Have you received any prior offers? Is the seller open to a 12% concession, seller financing, or rate buy-down credit?
- Built in 1961 — when were the roof, HVAC, electrical panel, plumbing, and water heater last replaced?
- Any open or pending special assessments — roof, HVAC, plumbing, elevator, façade? What's the per-unit balance and payoff schedule, and is the seller paying it off at close or rolling it to the buyer?
- Why hasn't it sold? Are there any deal-killer items the seller is aware of (foundation, flood, title, zoning, code violations)?
- Is there a deadline driving the sale (1031 exchange, divorce, estate, relocation)? That informs how much negotiation room exists.
- Schools are A-rated — typically a magnet for longer-tenancy family renters. What's the average tenant stay here, and is there a school-zone premium baked into asking?
- What's the average days-on-market for RENTAL listings here right now (not sales)? A rising rental-DOM trend means longer vacancies and softer asking-rent achievability than the comps imply.
- What's the recent tenant-quality profile in this submarket — average credit score on applications, eviction rate, late-payment / NSF rate, and stable-employment percentage? A property-management company in the area should have these aggregated.
- How much new apartment / multifamily construction is in the pipeline within 1–3 miles? Heavy new supply (>2% of stock underway) typically softens rents 12–24 months out; light construction supports rent growth.
Investment metrics
- 1% rule
- 1.04% ✓
- Cap rate
- 7.87%
- Cash-on-cash
- 5.63%
- DSCR
- 1.25
- GRM
- 8.0
CMA / ARV
No comps found within radius.
Projected returns pro-forma
-3.0% appreciation · 3.0% rent growth · sell at horizon
- IRR
- -7.6%
- Equity multiple
- 0.72×
- Total profit
- $-23,400
- Equity at exit
- $44,582
- IRR
- 2.0%
- Equity multiple
- 1.14×
- Total profit
- $12,011
- Equity at exit
- $25,852
Cash invested: $83,720 (down + closing). Projections, not guarantees.
Landlord ↔ Tenant lean methodology
- Overall (STATE)
- 15 Strongly Tenant-Friendly
- State New York
- 15 Strongly Tenant-Friendly · D+10
- County
- — inherits STATE
- City
- — inherits STATE
ZIP-level market 11518
- Active inventory
- 92
- Price-to-rent
- 8.0×
Monthly cashflow live
- Estimated rent
- $3,113 high interval (Pro) →
- Mortgage (P&I)
- −$1,568
- Tax est. 1.5%
- −$374 /mo · $4,485/yr
- Insurance
- −$125
- HOA
- −$0
- Vacancy / Maint / Mgmt
- −$654
- Net cashflow
- $393
Break-even live
Sensitivity live
| Price | -10% $599 | -5% $496 | +0% $393 | +5% $289 | +10% $186 |
|---|---|---|---|---|---|
| Rent | -10% $147 | -5% $270 | +0% $393 | +5% $516 | +10% $638 |
| Rate | -1.0pp $543 | -0.5pp $469 | base $393 | +0.5pp $315 | +1.0pp $236 |
UW: 25.0% down · 7.5% · 30yr · 1.5% tax · 5.0% vac · 8.0% maint · 8.0% mgmt
Financing live
Cash to close
- Down payment
- $74,750
- Closing costs
- $8,970
- Reserves months
- —
- Total cash needed
- —
Loan-product check · same deal, 3 products live
Conventional
25% down · 7.5% · 30yr
- Down + closing
- —
- Monthly P&I
- —
- Monthly cashflow
- —
- DSCR
- —
- Eligible?
- —
Personal DTI + credit; lowest rate.
DSCR
20% down · 8.5% · 30yr
- Down + closing
- —
- Monthly P&I
- —
- Monthly cashflow
- —
- DSCR
- —
- Eligible?
- —
No personal income docs; deal must DSCR.
Hard money
10% down · 12.0% · 12mo
- Down + closing
- —
- Monthly P&I
- —
- Monthly cashflow
- —
- DSCR
- —
- Eligible?
- —
Short-term bridge; refi at stabilization.
Rent comps 12 comps
| Address | Beds | Baths | Sqft | Rent | $/sqft | DOM | Units | Dist |
|---|---|---|---|---|---|---|---|---|
| 24 Doxsey Pl Unit 3 Lynbrook, NY | 2.0 | 1.0 | 900 | $3,300 | $3.67 | 25d | 1 | 0.39mi |
| 112 Atlantic Ave Apt 71 Lynbrook, NY | 2.0 | 1.0 | 760 | $3,000 | $3.95 | 13d | 1 | 0.45mi |
| 111 S Centre Ave Apt 1SS Rockville Centre, NY | 2.0 | 1.0 | 950 | $3,250 | $3.42 | 5d | 1 | 0.95mi |
| 65 Prospect Ave Unit 2W Lynbrook, NY | 1.0 | 1.0 | 800 | $3,055 | $3.82 | 44d | 1 | 0.96mi |
| 65 Prospect Ave Apt 15W Lynbrook, NY | 2.0 | 2.0 | 1060 | $3,680 | $3.47 | 22d | 1 | 0.96mi |
| 318 Earle Ave Unit 2 Lynbrook, NY | 1.0 | 1.0 | 600 | $2,500 | $4.17 | 25d | 1 | 0.96mi |
| 157 Hempstead Ave Unit B6 Lynbrook, NY | 1.0 | 1.0 | 700 | $2,700 | $3.86 | 25d | 1 | 1.05mi |
| 80 N Centre Ave Rockville Centre, NY | 3.0 | 1.0–3.5 | 1254 | $3,962 | $3.16 | 2d | 1 | 1.15mi |
| 8 Roswell Ave Oceanside, NY | 2.0 | 1.5 | 741 | $3,100 | $4.18 | 25d | 1 | 1.23mi |
| 45 Grand Ave Rockville Centre, NY | 2.0 | 1.0 | 800 | $3,000 | $3.75 | 25d | 1 | 1.47mi |
| 55 Grand Ave Apt 2A Rockville Centre, NY | 2.0 | 1.0 | 875 | $3,000 | $3.43 | 5d | 1 | 1.49mi |
| 67 N Prospect Ave Unit 16C Lynbrook, NY | 1.0 | 1.0 | 785 | $3,030 | $3.86 | 19d | 1 | 1.49mi |
HOA detail condo
- Monthly dues
- $0 · $0/yr
- Assessments
- None detected in remarks — confirm with the listing agent.
Listing history 3 events
-
2026-02-27status Pending
-
2025-09-27price $299,000
-
2025-09-26$285,000 Active
ⓘ Source: listings_history table (triggers on properties + properties_extension) + one-shot
backfill from property_details.listing_events for pre-trigger history.
Climate risk First Street
- Flood 4/10 Moderate FEMA zone X (unshaded) · 13% chance over 30 yrs
- Wildfire 1/10 Low
- Heat 6/10 Major 7 d/yr ≥95°F today · 16 d/yr by 30 yrs out
- Wind 6/10 Major 71% chance of damaging wind over 30 yrs
- Air quality 4/10 Moderate 4 unhealthy d/yr today · 6 by 30 yrs out
Nearby sold comps map
Loading sold comps map…
Walkable amenities ~0.75 mi
Loading nearby amenities…
Taxation est. · year 1
- Rental income
- $37,350
- − Mortgage interest
- −$16,749
- − Property taxes
- −$4,485
- − Insurance
- −$1,495
- − Repairs & maintenance
- −$2,988
- − Management
- −$2,988
- − Depreciation
- −$8,698
- Taxable loss
- −$52
- Est. tax savings @ 24.0%
- +$13
- After-tax cash flow
- $4,724/yr
For passive investors: Depreciation is non-cash, so a rental often shows a tax loss while cash-flowing — sheltering income. Rental losses are passive: they offset passive income freely, and up to $25,000/yr can offset ordinary (W-2) income if you actively participate and your MAGI is under $100k (phasing out to $0 by $150k); unused losses carry forward. On sale, claimed depreciation is recaptured at up to 25%, and gains may owe capital-gains tax (a 1031 exchange can defer both). Figures are a year-1 estimate at your 24.0% rate — not tax advice; consult a CPA.
Schools (NCES district)
- District
- East Rockaway Union Free School District
- NCES district ID
- 3609960
- Math proficiency
- 61% ▲ 1.00%
- Reading proficiency
- 67% ▲ 10.00%
- Median HH income
- $82,326
- Composite
- 57.47/100
- National rank
- #1072
- State rank
- #165 of 590 in NY
Livability — East Rockaway
- Score
- 84/100
- State rank
- #47
- US rank
- #741
Category grades
Schools grade is shown separately in the Schools card above.
Census & demographics
- Census place
- East Rockaway, NY
- City population
- 10,390
- Population (ZIP)
- 10,390
Population outlook (Nassau County) Hauer SSP2
- Today (2025)
- 1,409,302 people
- By 2030
- 1,431,482 · +1.6%
- By 2040
- 1,471,607 · +4.4%
- By 2050
- 1,502,845 · +6.6%
- By 2075
- 1,575,403 · +11.8%
- By 2100
- 1,554,356 · +10.3%
Race, ethnicity, and origin ACS 2023
- Neighborhood character
- Predominantly White (76%)
- Race & ethnicity
- White 76% Hispanic / Latino 14% Two or more races 6% Black 4% Asian 3%
- Hispanic origin (detail)
- Puerto Rican 2% Cuban 1% Dominican 3%
- Common ancestry
- Romanian 6% Scotch-Irish 4% Italian 1%
- Foreign-born
- 14% · Canada, China, Jamaica
- Languages at home
- 83% English-only · Spanish 11% Chinese 2% Other Indo-European 2%
Political lean MEDSL · Nassau
- 2024 margin
- Toss-up / Even · D 47.9% · R 52.1%
- 2008→2024 swing
- -12.6pp toward R · 2008: 8.4pp · 2024: -4.2pp
- All cycles
- 2024: R+4.2 2020: D+9.5 2016: D+5.3 2012: D+6.7 2008: D+8.4
Not yet ingested
- Civics
- —
Market trends
- HPI YoY
- ▼ -573.27%
- Current HPI
- 296.296
- Rent YoY
- —
- Metro
- —
- State GDP YoY
- ▲ 2.60%
- F500 in state
- 92
Industry mix (Fortune 500 HQ in NY)
| Industry | F500 HQs | Revenue |
|---|---|---|
| Financial Services | 10 | $950B |
|
||
| Consumer Goods | 9 | $162B |
|
||
| Insurance | 4 | $225B |
|
||
| Telecommunications | 2 | $144B |
|
||
| Pharmaceuticals | 2 | $112B |
|
||
| Media / Entertainment | 2 | $69B |
|
||
Price history
+4.9% since first listed3 events — show timeline
- 2026-02-27 Pending — OneKey® MLS as Distributed by MLS Grid
- 2025-09-27 Price Changed $299,000 OneKey® MLS as Distributed by MLS Grid
- 2025-09-26 Listed $285,000 OneKey® MLS as Distributed by MLS Grid
Cash-flow waterfall
monthlySold comps — $/sqft
last 12 mo · ≤1 miLoading sold comps…