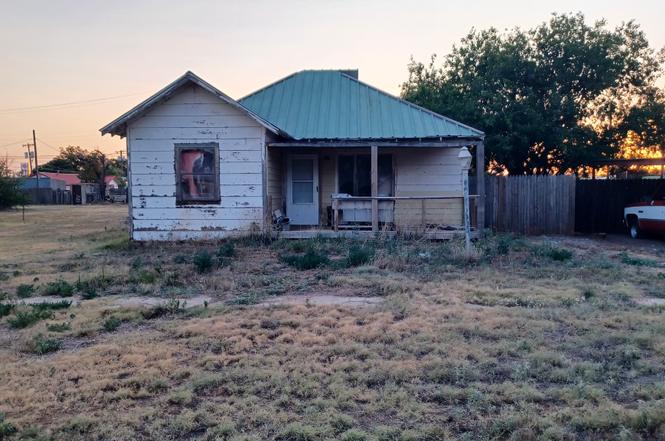
125 N Farmer Ave · Crosbyton, TX
Flood risk 1/10 · Minimal
- FEMA flood zone
- X
- Chance of flooding over 30 yrs
- 0.0%
- Est. flood insurance / yr
- $507 – $1,088
Fire risk 2/10 · Minimal
- Est. fire insurance / yr
- $1,222 – $2,270
Heat risk 5/10 · Moderate
- Hot days now (above 100°F)
- 7 days/yr
- Hot days in 30 yrs
- 19 days/yr
Wind risk 2/10 · Minimal
- Chance of severe wind over 30 yrs
- 2.0%
Air-quality risk 1/10 · Minimal
- Unhealthy air days now
- 0 days/yr
- Unhealthy air days in 30 yrs
- 0 days/yr
Risk factors via First Street. Map © Google.
Why this score? — see what drove the B+ grade
The composite is a weighted blend of 9 inputs, each scored 0–100. Each bar is that input's sub-score; the figure is the points it added to the 100-point composite (weight × sub-score).
- Cash flow +30.0/30.0
- 1% rule +10.0/10.0
- DSCR +10.0/10.0
- Appreciation +9.4/10.0
- ARV discount +7.5/15.0
- Livability +3.0/5.0
- Schools +2.6/10.0
- Rent growth +2.5/5.0
- Condition / age +2.5/5.0
$29,895
🖨 Deal sheet 📄 Offer letter ✓ Due diligence
Listing remarks
This House has 2 bedrooms, one Bath Room, Living Room, Dining Room, Back yard , Fenced in the City of Crosbyton , Crosby County , Nice Country Living. This House need interior work and Exterior Painting
Key facts
- Back yard
- Fenced
- Living room
Tags
Property features AI
Finance
- Other: Seller disclosure available
- Financial info: Lease considered
- HOA & community: Association: H&H Real Estate
Exterior
- Parking: No designated parking
- Security: Security features not specified
- Utilities: Public water; Public sewer
- Home design: Residential property; Faces north; Single-story (entry level not specified)
- Construction: Built in 1940; Wood siding construction; Metal roof; Pillar/post/pier foundation
- Exterior features: Fully fenced yard; Private yard; Cleared lot; Asphalt road access
Interior
- Kitchen: Appliances not specified
- Bedrooms: 2 possible bedrooms
- Flooring: Wood flooring
- Bathrooms: 1 full bathroom
- Heating & cooling: Window unit cooling
- Interior features: Kitchen/family room combo; Soaking tub; Free-standing fireplace
- Laundry & utility: Laundry info not specified
Neighborhood map
What this means for you Summary
Snapshot
- This is a 2-bed/1.0-bath single-family listed at $30k.
Deal economics
- At list price, monthly cash flow is $212 ($3k/yr) — positive.
- The deal already cash-flows at list — no discount required.
- Meets the 1% rule at list price ($545 rent vs $30k).
Location & tenants
- Location reads 59/100 on livability (#1,147 in TX) — a working-class tenant base; expect higher turnover. Strengths: cost of living A+, housing A+; Watch: health & safety C-, schools F, crime F.
- Crosbyton CISD (rural): math 25% / reading 30% proficiency, ranked #1,055 of 1,141 in TX (top 92%) — low school quality limits family demand, transient renter base, plan for 1-2y turnover; 65% free/reduced lunch — lower-income household profile, screen leases tightly.
- Market conditions: 16 active listings in the ZIP; 1 comparable units currently listed for rent nearby.
Forward outlook
- In year one you build about $3k of equity ($206 loan paydown + $3k appreciation (8.7% local appreciation)).
- Crosby County population projected at -19% by 2050 — secular population decline; favor cash flow + early exit over multi-decade hold.
- At projected returns (8.7% appreciation + 3.0% rent growth), your $8k cash investment doubles in ~2 years — after that, you're playing with house money.
- By year 10, paydown + projected appreciation supports a ~$32k cash-out refi (75% LTV) — recoverable capital for the next deal without selling this one.
Negotiation context
- Only 1 days on market — expect competitive offers; lowballing is unlikely to land.
- 5 sale attempts since 2y ago with the ask held roughly flat each time — persistent listings suggest the price (not the market) is what's stuck; bring a comps-based counter.
Risks & watch-outs
- Watch-outs: built in 1940 — expect roof / HVAC / electrical / plumbing capex.
- Climate carrying-cost: extreme-heat days projected 7→19/yr by 2055 (HVAC capex compounding) — expect insurance premiums to compound above CPI over the hold.
Questions for the listing agent
- Built in 1940 — when were the roof, HVAC, electrical panel, plumbing, and water heater last replaced?
- Is there a deadline driving the sale (1031 exchange, divorce, estate, relocation)? That informs how much negotiation room exists.
- Schools are F-rated, which usually means shorter tenancies and higher turnover. Who's the typical renter profile here, and what's been the actual vacancy rate?
- Crime grade is F in this area — have there been break-ins, vandalism, or insurance claims at this property in the last 3 years? What carrier currently insures it and at what premium?
- What's the average days-on-market for RENTAL listings here right now (not sales)? A rising rental-DOM trend means longer vacancies and softer asking-rent achievability than the comps imply.
- What's the recent tenant-quality profile in this submarket — average credit score on applications, eviction rate, late-payment / NSF rate, and stable-employment percentage? A property-management company in the area should have these aggregated.
- How much new for-sale + rental construction is in the pipeline within 1–3 miles? Heavy new supply typically softens prices + rents 12–24 months out; constrained supply supports both.
Investment metrics
- 1% rule
- 1.82% ✓
- Cap rate
- 14.80%
- Cash-on-cash
- 30.37%
- DSCR
- 2.35
- GRM
- 4.6
CMA / ARV
No comps found within radius.
Projected returns pro-forma
8.72% appreciation · 3.0% rent growth · sell at horizon
- IRR
- 45.4%
- Equity multiple
- 4.25×
- Total profit
- $27,211
- Equity at exit
- $24,190
- IRR
- 40.3%
- Equity multiple
- 9.25×
- Total profit
- $69,079
- Equity at exit
- $49,499
Cash invested: $8,371 (down + closing). Projections, not guarantees.
Landlord ↔ Tenant lean methodology
- Overall (STATE)
- 87 Strongly Landlord-Friendly
- State Texas
- 87 Strongly Landlord-Friendly · R+5
- County
- — inherits STATE
- City
- — inherits STATE
ZIP-level market 79322
- Home prices YoY
- 8.3%
- Active inventory
- 16
- Price-to-rent
- 4.6×
Monthly cashflow live
- Estimated rent
- $545 medium interval (Pro) →
- Mortgage (P&I)
- −$157
- Tax from tax record
- −$49 /mo · $594/yr
- Insurance
- −$12
- HOA
- −$0
- Vacancy / Maint / Mgmt
- −$114
- Net cashflow
- $212
Break-even live
UW: 25.0% down · 7.5% · 30yr · 1.5% tax · 5.0% vac · 8.0% maint · 8.0% mgmt
Financing live
Cash to close
- Down payment
- $7,474
- Closing costs
- $897
- Reserves months
- —
- Total cash needed
- —
Loan-product check · same deal, 3 products live
Conventional
25% down · 7.5% · 30yr
- Down + closing
- —
- Monthly P&I
- —
- Monthly cashflow
- —
- DSCR
- —
- Eligible?
- —
Personal DTI + credit; lowest rate.
DSCR
20% down · 8.5% · 30yr
- Down + closing
- —
- Monthly P&I
- —
- Monthly cashflow
- —
- DSCR
- —
- Eligible?
- —
No personal income docs; deal must DSCR.
Hard money
10% down · 12.0% · 12mo
- Down + closing
- —
- Monthly P&I
- —
- Monthly cashflow
- —
- DSCR
- —
- Eligible?
- —
Short-term bridge; refi at stabilization.
Rent comps 1 comps
| Address | Beds | Baths | Sqft | Rent | $/sqft | DOM | Units | Dist |
|---|---|---|---|---|---|---|---|---|
| 645 S Crosby St Crosbyton, TX | 2.0 | 1.0 | 881 | $545 | $0.62 | 43d | 1 | 0.73mi |
Listing history 2 events
-
2026-06-17remarks 202-char remark
-
2026-06-17$29,895 Active 1 DOM
ⓘ Source: listings_history table (triggers on properties + properties_extension) + one-shot
backfill from property_details.listing_events for pre-trigger history.
Tax reassessment forecast TX · Resets to sale price
- Current annual tax
- $594 · $49/mo
- Projected year-2 tax
- $594 · $49/mo
- Expected delta
- $0/yr ($0/mo · 0.0%)
ⓘ Screening estimate from a state-policy table — verify with the county assessor before closing.
Climate risk First Street
- Flood 1/10 Low FEMA zone X · 0% chance over 30 yrs
- Wildfire 2/10 Low
- Heat 5/10 Major 7 d/yr ≥100°F today · 19 d/yr by 30 yrs out
- Wind 2/10 Low 2% chance of damaging wind over 30 yrs
- Air quality 1/10 Low 0 unhealthy d/yr today · 0 by 30 yrs out
Nearby sold comps map
Loading sold comps map…
Walkable amenities ~0.75 mi
Loading nearby amenities…
Taxation est. · year 1
- Rental income
- $6,540
- − Mortgage interest
- −$1,675
- − Property taxes
- −$594
- − Insurance
- −$149
- − Repairs & maintenance
- −$523
- − Management
- −$523
- − Depreciation
- −$870
- Taxable income
- $2,206
- Est. tax owed @ 24.0%
- −$529
- After-tax cash flow
- $2,013/yr
For passive investors: Depreciation is non-cash, so a rental often shows a tax loss while cash-flowing — sheltering income. Rental losses are passive: they offset passive income freely, and up to $25,000/yr can offset ordinary (W-2) income if you actively participate and your MAGI is under $100k (phasing out to $0 by $150k); unused losses carry forward. On sale, claimed depreciation is recaptured at up to 25%, and gains may owe capital-gains tax (a 1031 exchange can defer both). Figures are a year-1 estimate at your 24.0% rate — not tax advice; consult a CPA.
Schools (NCES district)
- District
- Crosbyton CISD
- NCES district ID
- 4800001
- Math proficiency
- 25% ▼ -1.00%
- Reading proficiency
- 30% ▲ 5.00%
- Median HH income
- $37,076
- Composite
- 25.82/100
- National rank
- #12789
- State rank
- #1055 of 1141 in TX
Livability — Crosbyton
- Score
- 59/100
- State rank
- #1147
- US rank
- #20185
Category grades
Schools grade is shown separately in the Schools card above.
Census & demographics
- Census place
- Crosbyton, TX
- Population (ZIP)
- 1,945
Population outlook (Crosby County) Hauer SSP2
- Today (2025)
- 5,795 people
- By 2030
- 5,626 · -2.9%
- By 2040
- 5,198 · -10.3%
- By 2050
- 4,696 · -19.0%
- By 2075
- 3,250 · -43.9%
- By 2100
- 2,123 · -63.4%
Race, ethnicity, and origin ACS 2023
- Neighborhood character
- Majority Hispanic (63%)
- Race & ethnicity
- Hispanic / Latino 63% White 34% Two or more races 16% Black 1%
- Hispanic origin (detail)
- Mexican 59%
- Common ancestry
- Italian 4% Serbian 4% Iranian 3%
- Foreign-born
- 6% · Canada
- Languages at home
- 60% English-only · Spanish 39% Other Asian/Pacific 1%
Political lean MEDSL · Crosby
- 2024 margin
- Solid R (+51.3) · D 24.0% · R 75.3%
- 2008→2024 swing
- -23.3pp toward R · 2008: -28.1pp · 2024: -51.3pp
- All cycles
- 2024: R+51.3 2020: R+44.5 2016: R+41.6 2012: R+27.6 2008: R+28.1
Not yet ingested
- Civics
- —
Market trends
- HPI YoY
- ▲ 8.72%
- Current HPI
- 114.2754
- Rent YoY
- —
- Metro
- —
- State GDP YoY
- ▲ 3.95%
- F500 in state
- 110
Industry mix (Fortune 500 HQ in TX)
| Industry | F500 HQs | Revenue |
|---|---|---|
| Energy | 16 | $1,198B |
|
||
| Technology | 5 | $198B |
|
||
| Engineering / Construction | 4 | $72B |
|
||
| Energy Services | 3 | $60B |
|
||
| Utilities | 3 | $41B |
|
||
| Healthcare | 2 | $330B |
|
||
Price history
-24.3% since first listed11 events — show timeline
- 2026-06-17 Listed $29,895 HARMLS
- 2026-06-03 Listed for Rent $695 HARMLS
- 2026-01-01 Rental Removed $495 HARMLS
- 2025-10-31 Listing Removed — HARMLS
- 2025-07-08 Listed for Rent $495 HARMLS
- 2025-06-30 Rental Removed $495 HARMLS
- 2025-01-25 Listed for Rent $495 HARMLS
- 2025-01-17 Price Changed $28,500 HARMLS
- 2024-10-02 Listed $39,500 HARMLS
- 2006-01-26 Sold (Public Records) — Public Records
- 1999-09-13 Sold (Public Records) — Public Records
Property tax history
+7.9%/yrLatest (2025): $594 · +89.6% YoY. Source: county tax records.
Cash-flow waterfall
monthlySold comps — $/sqft
last 12 mo · ≤1 miLoading sold comps…