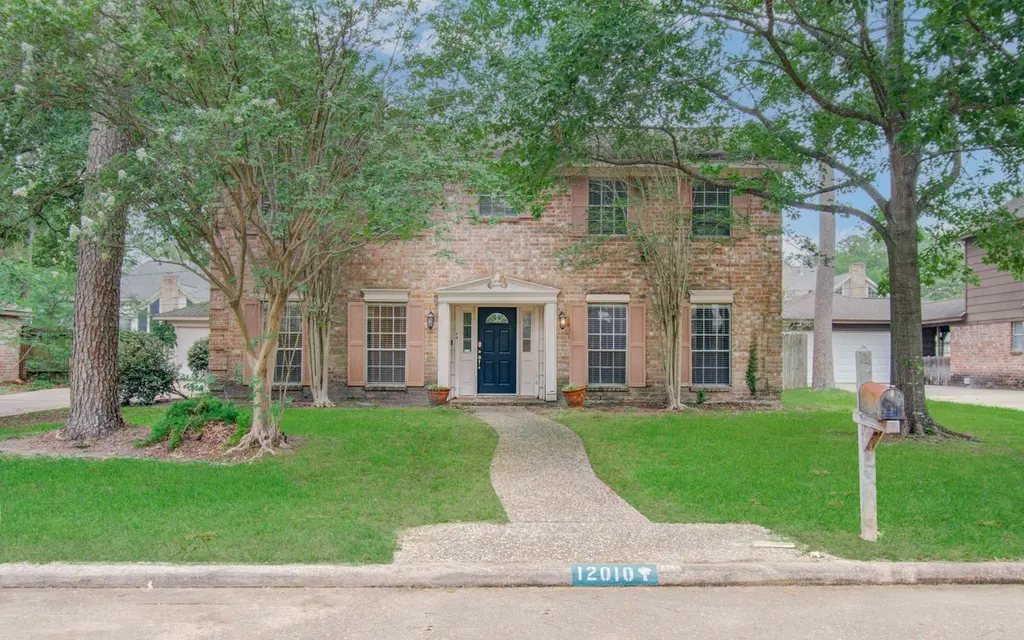
12010 Fawnview Dr · Houston, TX
Flood risk 1/10 · Minimal
- FEMA flood zone
- X (unshaded)
- Chance of flooding over 30 yrs
- 0.0%
- Est. flood insurance / yr
- $507 – $1,088
Fire risk 1/10 · Minimal
- Est. fire insurance / yr
- $1,222 – $2,270
Heat risk 9/10 · Severe
- Hot days now (above 110°F)
- 7 days/yr
- Hot days in 30 yrs
- 23 days/yr
Wind risk 8/10 · Major
- Chance of severe wind over 30 yrs
- 99.0%
Air-quality risk 3/10 · Minor
- Unhealthy air days now
- 2 days/yr
- Unhealthy air days in 30 yrs
- 3 days/yr
Risk factors via First Street. Map © Google.
Why this score? — see what drove the D grade
The composite is a weighted blend of 9 inputs, each scored 0–100. Each bar is that input's sub-score; the figure is the points it added to the 100-point composite (weight × sub-score).
- ARV discount +15.0/15.0
- Cash flow +7.2/30.0
- Schools +4.4/10.0
- Livability +3.7/5.0
- 1% rule +3.6/10.0
- Rent growth +2.7/5.0
- Condition / age +2.5/5.0
- DSCR +1.4/10.0
- Appreciation +0.0/10.0
$265,000
🖨 Deal sheet 📄 Offer letter ✓ Due diligence
Listing remarks MLS
Georgian Style Home will capture your heart! Immaculate home shows how well these original owners have cared for their home. Updated kitchen has Silestone counters, updated backsplash, stainless steel appliances. Frig can stay! Gas log fireplace and Gulf Coast insulated windows in Family room. Study/optional formal living. All BRs up. Silestone in half bath, marble counter and shower in Mstr bath. Double sinks in 2nd bath. Covered patio alongside garage, recent fence. Heat & air 2010.
Key facts
- Lakewood forest area
- Inviting curb appeal
- Quiet streets
Tags
Property features AI
Finance
- Other: Living area approximately 2,465 (building area total)
- HOA & community: Member of Lakewood Forest Fund, Inc.; annual association fee of $750
Exterior
- Parking: Detached garage (2 spaces)
- Utilities: Public water; Public sewer
- Home design: Residential property; Built in 1979; Slab foundation; Composition roof
- Construction: Brick and wood siding construction
- Exterior features: Covered patio; Deck; Patio; Fully fenced backyard; Back yard fencing; Located in a subdivision
Interior
- Kitchen: Kitchen on first floor (approx. 12x10)
- Bedrooms: Primary bedroom on second floor (approx. 17x16); Three additional bedrooms on second floor (approx. 15x12, 13x12, 12x12)
- Flooring: Carpet; Tile
- Bathrooms: 2 full bathrooms; 1 half bathroom
- Heating & cooling: Central heating (electric); Central air conditioning (electric)
- Interior features: Gas fireplace (1); Double vanity; Ceiling fan(s); 6 total rooms
Neighborhood map
What this means for you Summary
Snapshot
- This is a 4-bed/2.5-bath single-family listed at $265k.
Deal economics
- At list price, monthly cash flow is $-361 ($-4k/yr) — negative.
- To cash-flow at today's rent, offer at most $201k (24.1% below list).
- To meet the 1% rule (rent ≥ 1% of price), the offer needs to be $229k (13.7% below list).
- Recommended offer: $201k (24.1% below list) — sets the bar for cash-flow.
- Cap rate 4.7% vs local median 3.2% in Houston — top-decile yield for the area; either an underpriced asset or a hidden risk that comps aren't pricing in. Stress-test before assuming the spread holds.
Location & tenants
- Location reads 74/100 on livability (#184 in TX, #4,771 nationally) — a middle-class / working-renter tenant base. Strengths: amenities A+, cost of living A+, housing A+; Watch: crime F.
- Cypress-Fairbanks ISD (suburban): math 45% / reading 52% proficiency, ranked #161 of 826 in TX (top 20%) — families likely to look elsewhere, expect single-tenant / working-renter base with shorter leases.
- Zoned schools: Hamilton Middle (math 65% / reading 67%, grade A-, #92 of 1,662 statewide, top 6%, 1,538 students, 39% FRL); Cypress Creek H S (math 60% / reading 59%, grade C+, #275 of 1,632 statewide, top 19%, 3,366 students, 59% FRL).
- Zoned-school proficiency averages 63% at this address vs 48% district-wide (+14 pts) — the actual schools serving this property are materially stronger than the Cypress-Fairbanks ISD average implies; a family-tenant draw the district grade alone would hide.
- Market conditions: Rents flat; 235 active listings in the ZIP; 5 comparable units currently listed for rent nearby; rentals lingering (median 44d on market — plan ~5-8 weeks vacancy on turnover, expect pricing pressure); 60% of comp listings sitting > 30 days — soft ceiling on asking rent; solid renter incomes; 29,883 units permitted in Harris County in 2024 (8,621 in 5+ unit buildings).
- This rent runs 35% of the median local income ($77k/yr) — at the standard rent-burdened threshold; future hikes will face affordability resistance.
Forward outlook
- Local home prices are declining (-3.0%/yr); year-one equity from $2k of loan paydown is wiped out by about $8k of value loss. Plan a longer hold.
- Harris County population projected at +47% by 2050 — long-run rental-demand tailwind backs the buy-and-hold thesis.
Negotiation context
- It's been on market 49 days — a 3% lower offer ($257k) is reasonable based on typical stale-listing flexibility.
- 5 sale attempts since 17y ago; this cycle's ask has dropped $35k (12%) from the opening price — seller is motivated, your offer sets the floor, not the list.
Risks & watch-outs
- Watch-outs: property tax is 2.7% of price.
- Climate carrying-cost: severe wind risk, 99% chance of damaging wind over 30y; extreme-heat days projected 7→23/yr by 2055 (HVAC capex compounding) — expect insurance premiums to compound above CPI over the hold.
Questions for the listing agent
- What do current leases actually rent for vs. the listed asking? Can we see a recent rent roll and the last 12 months of T-12 income?
- It's been on market 49 days. Have you received any prior offers? Is the seller open to a 24% concession, seller financing, or rate buy-down credit?
- Built in 1979 — when were the roof, HVAC, electrical panel, plumbing, and water heater last replaced?
- Property tax is high relative to price — has the assessment been appealed recently, and will the sale trigger a re-assessment?
- What does the HOA fee cover, when was the last increase, and are there any pending special assessments or reserve-fund shortfalls?
- Is there a deadline driving the sale (1031 exchange, divorce, estate, relocation)? That informs how much negotiation room exists.
- Schools are D-rated, which usually means shorter tenancies and higher turnover. Who's the typical renter profile here, and what's been the actual vacancy rate?
- Crime grade is F in this area — have there been break-ins, vandalism, or insurance claims at this property in the last 3 years? What carrier currently insures it and at what premium?
- The area grade is low — what's the realistic commute time and amenity access for the typical tenant pool here? Any planned neighborhood developments (good or bad) we should know about?
- What's the average days-on-market for RENTAL listings here right now (not sales)? A rising rental-DOM trend means longer vacancies and softer asking-rent achievability than the comps imply.
- What's the recent tenant-quality profile in this submarket — average credit score on applications, eviction rate, late-payment / NSF rate, and stable-employment percentage? A property-management company in the area should have these aggregated.
- How much new for-sale + rental construction is in the pipeline within 1–3 miles? Heavy new supply typically softens prices + rents 12–24 months out; constrained supply supports both.
Investment metrics
- 1% rule
- 0.86% ✗
- Cap rate
- 4.66%
- Cash-on-cash
- -5.84%
- DSCR
- 0.74
- GRM
- 9.7
CMA / ARV
- ARV (median comp)
- $368,824
- List price
- $265,000
- Delta
- -28.15%
- Verdict
- UNDERPRICED
- Comps
- 20 within 1.0 mi
Show comp detail 12 sales within ~0.75 mi
| Address | Dist | Beds/Ba | Sqft | Sold | Price | $/sf | Match |
|---|---|---|---|---|---|---|---|
| 11918 Gardenglen Dr | 0.17mi | 4/2.5 | 2,383 (-3%) | 1mo | $349,000 | $146 | 86 |
| 12035 Glenway Dr | 0.02mi | 4/2.5 | 2,712 (+10%) | 3mo | $399,900 | $147 | 80 |
| 11719 Jaycreek Dr | 0.48mi | 4/2.5 | 2,289 (-7%) | 1mo | $325,000 | $142 | 65 |
| 12126 Quail Creek Dr | 0.46mi | 3/3.0 (-1) | 2,554 (+4%) | 2mo | $315,000 | $123 | 64 |
| 12023 Normont Drive Dr | 0.34mi | 4/2.5 | 2,790 (+13%) | 1mo | $349,900 | $125 | 62 |
| 11611 Aspenway Dr | 0.56mi | 3/2.5 (-1) | 2,603 (+6%) | 3mo | $369,000 | $142 | 57 |
| 11602 Aspenway Dr | 0.59mi | 3/2.5 (-1) | 2,332 (-5%) | 3mo | $362,888 | $156 | 56 |
| 14930 Spring Lake Dr | 0.67mi | 5/3.5 (+1) | 2,421 (-2%) | 1mo | $420,000 | $173 | 56 |
| 11727 Gardenglen Dr | 0.37mi | 4/3.5 | 2,783 (+13%) | 3mo | $280,000 | $101 | 55 |
| 11710 Pebbleton Dr | 0.71mi | 4/3.5 | 2,355 (-4%) | 2mo | $350,000 | $149 | 54 |
| 15002 Carols Way Dr | 0.73mi | 4/2.5 | 2,621 (+6%) | 3mo | $385,000 | $147 | 53 |
| 11503 Aspenway Dr | 0.69mi | 3/2.5 (-1) | 2,655 (+8%) | 2mo | $399,000 | $150 | 48 |
Match score weights: distance 35% · size 25% · config 20% · recency 20%. Top-matched comps best support the ARV.
Projected returns pro-forma
-3.0% appreciation · 0.91% rent growth · sell at horizon
- IRR
- -29.1%
- Equity multiple
- 0.05×
- Total profit
- $-70,419
- Equity at exit
- $39,512
- IRR
- -43.2%
- Equity multiple
- -0.46×
- Total profit
- $-108,500
- Equity at exit
- $22,912
Cash invested: $74,200 (down + closing). Projections, not guarantees.
Landlord ↔ Tenant lean methodology
- Overall (STATE)
- 87 Strongly Landlord-Friendly
- State Texas
- 87 Strongly Landlord-Friendly · R+5
- County
- — inherits STATE
- City
- — inherits STATE
ZIP-level market 77070
- Rents YoY
- 0.9%
- Active inventory
- 235
- Price-to-rent
- 9.7×
Monthly cashflow live
- Estimated rent
- $2,286 high interval (Pro) →
- Mortgage (P&I)
- −$1,390
- Tax from tax record
- −$604 /mo · $7,253/yr
- Insurance
- −$110
- HOA
- −$63
- Vacancy / Maint / Mgmt
- −$480
- Net cashflow
- $-361
Break-even live
UW: 25.0% down · 7.5% · 30yr · 1.5% tax · 5.0% vac · 8.0% maint · 8.0% mgmt
Financing live
Cash to close
- Down payment
- $66,250
- Closing costs
- $7,950
- Reserves months
- —
- Total cash needed
- —
Loan-product check · same deal, 3 products live
Conventional
25% down · 7.5% · 30yr
- Down + closing
- —
- Monthly P&I
- —
- Monthly cashflow
- —
- DSCR
- —
- Eligible?
- —
Personal DTI + credit; lowest rate.
DSCR
20% down · 8.5% · 30yr
- Down + closing
- —
- Monthly P&I
- —
- Monthly cashflow
- —
- DSCR
- —
- Eligible?
- —
No personal income docs; deal must DSCR.
Hard money
10% down · 12.0% · 12mo
- Down + closing
- —
- Monthly P&I
- —
- Monthly cashflow
- —
- DSCR
- —
- Eligible?
- —
Short-term bridge; refi at stabilization.
Rent comps 5 comps
| Address | Beds | Baths | Sqft | Rent | $/sqft | DOM | Units | Dist |
|---|---|---|---|---|---|---|---|---|
| 11906 Cottonwood Ln Cypress, TX | 3.0 | 2.5 | 2110 | $2,145 | $1.02 | 7d | 1 | 0.32mi |
| 11927 Pondwood Dr Cypress, TX | 3.0 | 3.0 | 1868 | $2,600 | $1.39 | 43d | 1 | 0.34mi |
| 14715 Spring Lake Dr Houston, TX | 3.0 | 2.0 | 1793 | $2,100 | $1.17 | 43d | 1 | 0.52mi |
| 12311 Oak Park Dr Houston, TX | 4.0 | 2.5 | 2347 | $2,300 | $0.98 | 20d | 1 | 0.82mi |
| 12635 Ivyforest Dr Cypress, TX | 4.0 | 2.5 | 2687 | $2,450 | $0.91 | 43d | 1 | 1.28mi |
HOA detail
- Monthly dues
- $63 · $756/yr
- Likely covers
- gas
Listing history 29 events
-
2026-06-18days on market $265,000 Active 49 DOM
-
2026-06-17days on market $265,000 Active 48 DOM
-
2026-06-16days on market $265,000 Active 47 DOM
-
2026-06-15days on market $265,000 Active 46 DOM
-
2026-06-13days on market $265,000 Active 44 DOM
-
2026-06-13pricedays on market $265,000 Active 43 DOM
-
2026-06-09days on market $275,000 Active 40 DOM
-
2026-06-08days on market $275,000 Active 39 DOM
-
2026-06-07days on market $275,000 Active 38 DOM
-
2026-06-04days on market $275,000 Active 35 DOM
-
2026-06-03days on market $275,000 Active 34 DOM
-
2026-06-02days on market $275,000 Active 33 DOM
-
2026-06-02days on market $275,000 Active 32 DOM
-
2026-05-31days on market $275,000 Active 31 DOM
-
2026-05-12price $285,000 955-char remark
-
2026-04-30$300,000 Active 955-char remark
-
2013-07-24soldstatus
-
2013-07-19soldstatus Sold 495-char remark
Show marketing remark (495 chars)
Georgian Style Home will capture your heart! Immaculate home shows how well these original owners have cared for their home. Updated kitchen has Silestone counters, updated backsplash, stainless steel appliances. Frig can stay! Gas log fireplace and Gulf Coast insulated windows in Family room. Study/optional formal living. All BRs up. Silestone in half bath, marble counter and shower in Mstr bath. Double sinks in 2nd bath. Covered patio alongside garage, recent fence. Heat & air 2010.
-
2013-06-28status Pending 495-char remark
Show marketing remark (495 chars)
Georgian Style Home will capture your heart! Immaculate home shows how well these original owners have cared for their home. Updated kitchen has Silestone counters, updated backsplash, stainless steel appliances. Frig can stay! Gas log fireplace and Gulf Coast insulated windows in Family room. Study/optional formal living. All BRs up. Silestone in half bath, marble counter and shower in Mstr bath. Double sinks in 2nd bath. Covered patio alongside garage, recent fence. Heat & air 2010.
-
2013-06-22status Option Pending 495-char remark
Show marketing remark (495 chars)
Georgian Style Home will capture your heart! Immaculate home shows how well these original owners have cared for their home. Updated kitchen has Silestone counters, updated backsplash, stainless steel appliances. Frig can stay! Gas log fireplace and Gulf Coast insulated windows in Family room. Study/optional formal living. All BRs up. Silestone in half bath, marble counter and shower in Mstr bath. Double sinks in 2nd bath. Covered patio alongside garage, recent fence. Heat & air 2010.
-
2013-06-16price $162,000 495-char remark
Show marketing remark (495 chars)
Georgian Style Home will capture your heart! Immaculate home shows how well these original owners have cared for their home. Updated kitchen has Silestone counters, updated backsplash, stainless steel appliances. Frig can stay! Gas log fireplace and Gulf Coast insulated windows in Family room. Study/optional formal living. All BRs up. Silestone in half bath, marble counter and shower in Mstr bath. Double sinks in 2nd bath. Covered patio alongside garage, recent fence. Heat & air 2010.
-
2013-05-25$165,000 Active 495-char remark
Show marketing remark (495 chars)
Georgian Style Home will capture your heart! Immaculate home shows how well these original owners have cared for their home. Updated kitchen has Silestone counters, updated backsplash, stainless steel appliances. Frig can stay! Gas log fireplace and Gulf Coast insulated windows in Family room. Study/optional formal living. All BRs up. Silestone in half bath, marble counter and shower in Mstr bath. Double sinks in 2nd bath. Covered patio alongside garage, recent fence. Heat & air 2010.
-
2010-05-18historical
-
2010-02-22$159,500
-
2010-01-01historical
-
2009-10-31$159,900
-
2009-10-22historical
-
2009-07-21$159,900
-
1980-05-02soldstatus
ⓘ Source: listings_history table (triggers on properties + properties_extension) + one-shot
backfill from property_details.listing_events for pre-trigger history.
Tax reassessment forecast TX · Resets to sale price
- Current annual tax
- $7,253 · $604/mo
- Projected year-2 tax
- $7,253 · $604/mo
- Expected delta
- $0/yr ($0/mo · 0.0%)
ⓘ Screening estimate from a state-policy table — verify with the county assessor before closing.
Climate risk First Street
- Flood 1/10 Low FEMA zone X (unshaded) · 0% chance over 30 yrs
- Wildfire 1/10 Low
- Heat 9/10 Extreme 7 d/yr ≥110°F today · 23 d/yr by 30 yrs out
- Wind 8/10 Severe 99% chance of damaging wind over 30 yrs
- Air quality 3/10 Moderate 2 unhealthy d/yr today · 3 by 30 yrs out
Nearby sold comps map
Loading sold comps map…
Walkable amenities ~0.75 mi
Loading nearby amenities…
Taxation est. · year 1
- Rental income
- $27,437
- − Mortgage interest
- −$14,844
- − Property taxes
- −$7,253
- − Insurance
- −$1,325
- − Repairs & maintenance
- −$2,195
- − Management
- −$2,195
- − HOA
- −$756
- − Depreciation
- −$7,709
- Taxable loss
- −$8,840
- Est. tax savings @ 24.0%
- +$2,122
- After-tax cash flow
- $-2,213/yr
For passive investors: Depreciation is non-cash, so a rental often shows a tax loss while cash-flowing — sheltering income. Rental losses are passive: they offset passive income freely, and up to $25,000/yr can offset ordinary (W-2) income if you actively participate and your MAGI is under $100k (phasing out to $0 by $150k); unused losses carry forward. On sale, claimed depreciation is recaptured at up to 25%, and gains may owe capital-gains tax (a 1031 exchange can defer both). Figures are a year-1 estimate at your 24.0% rate — not tax advice; consult a CPA.
Schools (NCES district)
- District
- Cypress-Fairbanks ISD
- NCES district ID
- 4816110
- Math proficiency
- 45% ▼ -12.00%
- Reading proficiency
- 52% ▼ -2.00%
- Median HH income
- $72,025
- Composite
- 43.63/100
- National rank
- #2968
- State rank
- #161 of 826 in TX
Livability — Houston
- Score
- 74/100
- State rank
- #184
- US rank
- #4771
Category grades
Schools grade is shown separately in the Schools card above.
Census & demographics
- County
- Harris County · 4,702,590 people
- City population
- 3,226,434
- Metro
- Houston-The Woodlands-Sugar Land, TX
- Population (ZIP)
- 58,229
- Household income
- $77,397
- Rent vs Own
- Severe rent burden
- 2924.0
Population outlook (Harris County) Hauer SSP2
- Today (2025)
- 5,571,493 people
- By 2030
- 6,089,821 · +9.3%
- By 2040
- 7,142,806 · +28.2%
- By 2050
- 8,185,864 · +46.9%
- By 2075
- 10,574,329 · +89.8%
- By 2100
- 12,109,958 · +117.4%
Race, ethnicity, and origin ACS 2023
- Neighborhood character
- Highly diverse neighborhood (Simpson 0.73)
- Race & ethnicity
- White 35% Hispanic / Latino 31% Black 19% Two or more races 16% Asian 11% Native American 1%
- Hispanic origin (detail)
- Mexican 20% Cuban 1%
- Common ancestry
- Lithuanian 2% Slovak 1% Romanian 1%
- Foreign-born
- 23% · Canada, Vietnam, Jamaica
- Languages at home
- 64% English-only · Spanish 24% Vietnamese 4% Other Indo-European 2%
Political lean MEDSL · Harris
- 2024 margin
- Lean D (+5.5) · D 52.0% · R 46.4% · Other 1.6%
- 2008→2024 swing
- +3.9pp toward D · 2008: 1.6pp · 2024: 5.5pp
- All cycles
- 2024: D+5.5 2020: D+13.3 2016: D+12.4 2012: D+0.1 2008: D+1.6
Not yet ingested
- Civics
- —
Market trends
- HPI YoY
- ▼ -130.95%
- Current HPI
- 232.3128
- Rent YoY
- ▲ 0.91%
- Metro
- Houston-The Woodlands-Sugar Land, TX
- State GDP YoY
- ▲ 3.95%
- F500 in state
- 110
Industry mix (Fortune 500 HQ in TX)
| Industry | F500 HQs | Revenue |
|---|---|---|
| Energy | 16 | $1,198B |
|
||
| Technology | 5 | $198B |
|
||
| Engineering / Construction | 4 | $72B |
|
||
| Energy Services | 3 | $60B |
|
||
| Utilities | 3 | $41B |
|
||
| Healthcare | 2 | $330B |
|
||
Price history
+65.7% since first listed17 events — show timeline
- 2026-06-12 Price Changed $265,000 HARMLS
- 2026-05-26 Price Changed $275,000 HARMLS
- 2026-05-12 Price Changed $285,000 HARMLS
- 2026-04-30 Listed $300,000 HARMLS
- 2013-07-24 Sold (Public Records) — Public Records
- 2013-07-19 Sold (MLS) — HARMLS
- 2013-06-28 Pending — HARMLS
- 2013-06-22 Pending — HARMLS
- 2013-06-16 Price Changed $162,000 HARMLS
- 2013-05-25 Listed $165,000 HARMLS
- 2010-05-18 Listing Removed — HARMLS
- 2010-02-22 Listed $159,500 HARMLS
- 2010-01-01 Listing Removed — HARMLS
- 2009-10-31 Listed $159,900 HARMLS
- 2009-10-22 Listing Removed — HARMLS
- 2009-07-21 Listed $159,900 HARMLS
- 1980-05-02 Sold (Public Records) — Public Records
Property tax history
+8.6%/yrLatest (2025): $7,253 · +3.7% YoY. Source: county tax records.
Cash-flow waterfall
monthlySold comps — $/sqft
last 12 mo · ≤1 miLoading sold comps…