2900 Muir Ave #67 · Atwater, CA
Flood risk 1/10 · Minimal
- FEMA flood zone
- X (unshaded)
- Chance of flooding over 30 yrs
- 0.0%
- Est. flood insurance / yr
- $507 – $1,088
Fire risk 7/10 · Major
- Est. fire insurance / yr
- $659 – $1,223
Heat risk 7/10 · Major
- Hot days now (above 103°F)
- 7 days/yr
- Hot days in 30 yrs
- 16 days/yr
Wind risk 1/10 · Minimal
- Chance of severe wind over 30 yrs
- —
Air-quality risk 10/10 · Severe
- Unhealthy air days now
- 35 days/yr
- Unhealthy air days in 30 yrs
- 38 days/yr
Risk factors via First Street. Map © Google.
Why this score? — see what drove the B+ grade
The composite is a weighted blend of 9 inputs, each scored 0–100. Each bar is that input's sub-score; the figure is the points it added to the 100-point composite (weight × sub-score).
- Cash flow +30.0/30.0
- ARV discount +15.0/15.0
- 1% rule +10.0/10.0
- DSCR +10.0/10.0
- Livability +3.4/5.0
- Schools +2.8/10.0
- Rent growth +2.5/5.0
- Condition / age +2.5/5.0
- Appreciation +0.0/10.0
$34,999
🖨 Deal sheet 📄 Offer letter ✓ Due diligence
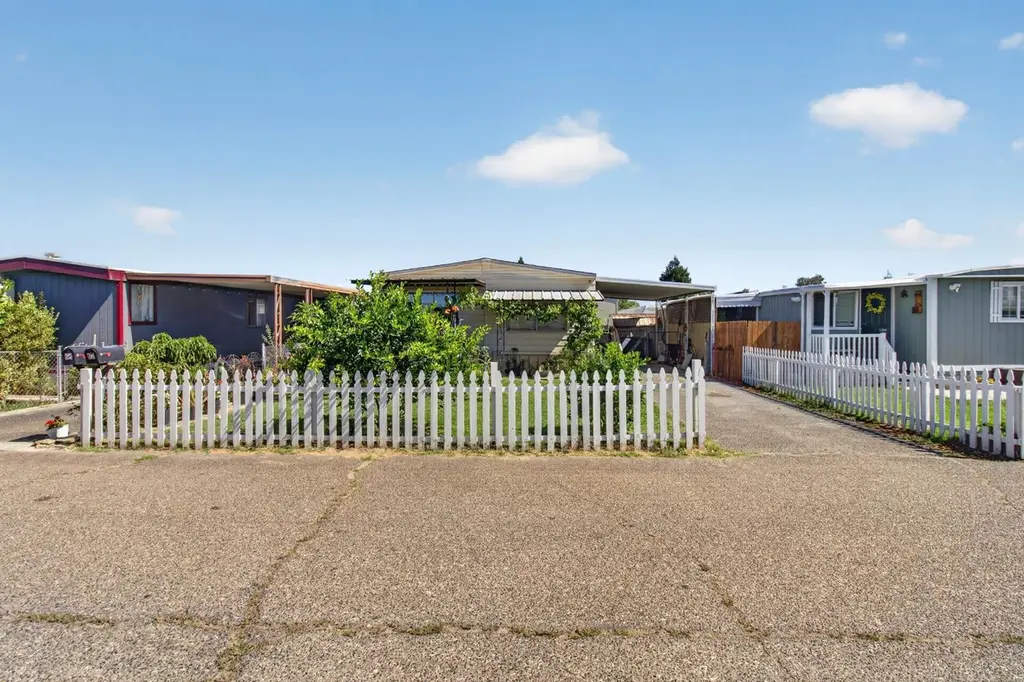
Listing remarks
Mobile Home for Sale at Bellevue Mobile Home Park- Space 67!! Welcome to this affordable opportunity in the desirable all-age community at Bellevue MHP! Priced at just $49,999, this fixer mobile home offers tremendous potential for buyers looking to create their own space, invest, or enjoy affordable homeownership. Situated in Space 67, this home features a spacious lot with a variety of producing fruit trees and plants that make the outdoor space truly special. Enjoy harvesting your own green limes, oranges, and grapes, all of which are already producing fruit. The property also includes chiltepin peppers and serrano pepper plants, currently growing and offering future harvests for thos
Key facts
- 2,886 sq ft lot
- 3 parking spots
- Built 1975
Property features AI
Finance
- Financial info: Land lease of $750 per month
- HOA & community: No homeowners association; Not a senior community
Exterior
- Parking: 3 parking spaces; Guest parking available
- Utilities: Public water; Public sewer; Individual gas meter; Cable and internet available; 220V service in kitchen and laundry
- Home design: Manufactured home (double wide) in a park; Made by Royal; Built in 1975; Located on Muir Ave in a manufactured home community; Land lease community (monthly land lease)
- Construction: Aluminum skirting
- Exterior features: Shingle roof; Front yard landscaping and garden; Fenced yard; Close to clubhouse; Regular-shaped lot
Interior
- Kitchen: Free-standing gas range and oven; Free-standing electric range and oven; Free-standing refrigerator; Laminate counters; Wood counters; Breakfast area
- Bedrooms: 2 bedrooms
- Flooring: Laminate flooring
- Bathrooms: 1 full bathroom with tub/shower over and separate shower stall(s)
- Heating & cooling: Wall furnace heating; Wall unit cooling; Window unit cooling; Whole house fan
- Interior features: Laminate flooring; Breakfast area; Laminate and wood countertops; Kitchen open to dining area with dining bar; Living room; Laundry room (inside)
- Laundry & utility: Washer and dryer included (stacked); Electric laundry hookup; Washer/Dryer located inside
Neighborhood map
What this means for you Summary
Snapshot
- This is a 2-bed/1.0-bath manufactured listed at $35k.
Deal economics
- At list price, monthly cash flow is $808 ($10k/yr) — positive.
- The deal already cash-flows at list — no discount required.
- Meets the 1% rule at list price ($1k rent vs $35k).
- Cap rate 34.0% vs local median 2.8% in Atwater — top-decile yield for the area; either an underpriced asset or a hidden risk that comps aren't pricing in. Stress-test before assuming the spread holds.
Location & tenants
- Location reads 68/100 on livability (#295 in CA) — a middle-class / working-renter tenant base. Strengths: housing A+, health & safety A+, amenities B; Watch: employment D+, schools D, crime F.
- Merced Union High (urban): math 20% / reading 46% proficiency, ranked #301 of 517 in CA (top 58%) — families likely to look elsewhere, expect single-tenant / working-renter base with shorter leases.
- Market conditions: 115 active listings in the ZIP; 459 units permitted in Merced County in 2024 (0 in 5+ unit buildings).
Forward outlook
- Local home prices are declining (-3.0%/yr); year-one equity from $242 of loan paydown is wiped out by about $1k of value loss. Plan a longer hold.
- Merced County population projected at +12% by 2050 — modest demand growth; plan on rents tracking national, not racing it.
- At projected returns (-3.0% appreciation + 3.0% rent growth), your $10k cash investment doubles in ~2 years — after that, you're playing with house money.
Negotiation context
- Only 11 days on market — expect competitive offers; lowballing is unlikely to land.
Risks & watch-outs
- Climate carrying-cost: major wildfire risk; extreme-heat days projected 7→16/yr by 2055 (HVAC capex compounding) — expect insurance premiums to compound above CPI over the hold.
Questions for the listing agent
- Built in 1975 — when were the roof, HVAC, electrical panel, plumbing, and water heater last replaced?
- Is there a deadline driving the sale (1031 exchange, divorce, estate, relocation)? That informs how much negotiation room exists.
- Schools are D-rated, which usually means shorter tenancies and higher turnover. Who's the typical renter profile here, and what's been the actual vacancy rate?
- Crime grade is F in this area — have there been break-ins, vandalism, or insurance claims at this property in the last 3 years? What carrier currently insures it and at what premium?
- What's the average days-on-market for RENTAL listings here right now (not sales)? A rising rental-DOM trend means longer vacancies and softer asking-rent achievability than the comps imply.
- What's the recent tenant-quality profile in this submarket — average credit score on applications, eviction rate, late-payment / NSF rate, and stable-employment percentage? A property-management company in the area should have these aggregated.
- How much new for-sale + rental construction is in the pipeline within 1–3 miles? Heavy new supply typically softens prices + rents 12–24 months out; constrained supply supports both.
Investment metrics
- 1% rule
- 3.68% ✓
- Cap rate
- 33.99%
- Cash-on-cash
- 98.93%
- DSCR
- 5.40
- GRM
- 2.3
CMA / ARV
- ARV (on-the-fly)
- $47,040
- Comps found
- 1
Show comp detail 1 sale within ~0.75 mi
| Address | Dist | Beds/Ba | Sqft | Sold | Price | $/sf | Match |
|---|---|---|---|---|---|---|---|
| 2900 Muir Ave #94 | 0.07mi | 2/2.0 | 924 (-4%) | 23mo | $45,000 | $49 | 68 |
Match score weights: distance 35% · size 25% · config 20% · recency 20%. Top-matched comps best support the ARV.
Projected returns pro-forma
-3.0% appreciation · 3.0% rent growth · sell at horizon
- IRR
- 100.0%
- Equity multiple
- 5.67×
- Total profit
- $45,783
- Equity at exit
- $5,218
- IRR
- —
- Equity multiple
- 11.83×
- Total profit
- $106,121
- Equity at exit
- $3,026
Cash invested: $9,800 (down + closing). Projections, not guarantees.
Landlord ↔ Tenant lean methodology
- Overall (STATE)
- 18 Strongly Tenant-Friendly
- State California
- 18 Strongly Tenant-Friendly · D+13
- County
- — inherits STATE
- City
- — inherits STATE
ZIP-level market 95301
- Active inventory
- 115
- Price-to-rent
- 2.3×
Monthly cashflow live
- Estimated rent
- $1,288 medium interval (Pro) →
- Mortgage (P&I)
- −$184
- Tax from tax record
- −$11 /mo · $137/yr
- Insurance
- −$15
- HOA
- −$0
- Vacancy / Maint / Mgmt
- −$270
- Net cashflow
- $808
Break-even live
UW: 25.0% down · 7.5% · 30yr · 1.5% tax · 5.0% vac · 8.0% maint · 8.0% mgmt
Financing live
Cash to close
- Down payment
- $8,750
- Closing costs
- $1,050
- Reserves months
- —
- Total cash needed
- —
Loan-product check · same deal, 3 products live
Conventional
25% down · 7.5% · 30yr
- Down + closing
- —
- Monthly P&I
- —
- Monthly cashflow
- —
- DSCR
- —
- Eligible?
- —
Personal DTI + credit; lowest rate.
DSCR
20% down · 8.5% · 30yr
- Down + closing
- —
- Monthly P&I
- —
- Monthly cashflow
- —
- DSCR
- —
- Eligible?
- —
No personal income docs; deal must DSCR.
Hard money
10% down · 12.0% · 12mo
- Down + closing
- —
- Monthly P&I
- —
- Monthly cashflow
- —
- DSCR
- —
- Eligible?
- —
Short-term bridge; refi at stabilization.
Listing history 10 events
-
2026-06-18days on market $34,999 Active 11 DOM
-
2026-06-17days on market $34,999 Active 10 DOM
-
2026-06-16days on market $34,999 Active 9 DOM
-
2026-06-15days on market $34,999 Active 8 DOM
-
2026-06-14days on market $34,999 Active 6 DOM
-
2026-06-13pricedays on market $34,999 Active 5 DOM
-
2026-06-10days on market $49,999 Active 3 DOM
-
2026-06-09days on market $49,999 Active 2 DOM
-
2026-06-08remarks 699-char remark
-
2026-06-08$49,999 Active 1 DOM
ⓘ Source: listings_history table (triggers on properties + properties_extension) + one-shot
backfill from property_details.listing_events for pre-trigger history.
Tax reassessment forecast CA · Resets to sale price
- Current annual tax
- $137 · $11/mo
- Projected year-2 tax
- $266 · $22/mo
- Expected delta
- +$129/yr (+$11/mo · 93.8%)
ⓘ Screening estimate from a state-policy table — verify with the county assessor before closing.
Climate risk First Street
- Flood 1/10 Low FEMA zone X (unshaded) · 0% chance over 30 yrs
- Wildfire 7/10 Severe
- Heat 7/10 Severe 7 d/yr ≥103°F today · 16 d/yr by 30 yrs out
- Wind 1/10 Low
- Air quality 10/10 Extreme 35 unhealthy d/yr today · 38 by 30 yrs out
Nearby sold comps map
Loading sold comps map…
Walkable amenities ~0.75 mi
Loading nearby amenities…
Taxation est. · year 1
- Rental income
- $15,455
- − Mortgage interest
- −$1,960
- − Property taxes
- −$137
- − Insurance
- −$175
- − Repairs & maintenance
- −$1,236
- − Management
- −$1,236
- − Depreciation
- −$1,018
- Taxable income
- $9,691
- Est. tax owed @ 24.0%
- −$2,326
- After-tax cash flow
- $7,369/yr
For passive investors: Depreciation is non-cash, so a rental often shows a tax loss while cash-flowing — sheltering income. Rental losses are passive: they offset passive income freely, and up to $25,000/yr can offset ordinary (W-2) income if you actively participate and your MAGI is under $100k (phasing out to $0 by $150k); unused losses carry forward. On sale, claimed depreciation is recaptured at up to 25%, and gains may owe capital-gains tax (a 1031 exchange can defer both). Figures are a year-1 estimate at your 24.0% rate — not tax advice; consult a CPA.
Schools (NCES district)
- District
- Merced Union High
- NCES district ID
- 0624660
- Math proficiency
- 20% ▲ 3.00%
- Reading proficiency
- 46% ▼ -1.00%
- Median HH income
- $44,977
- Composite
- 28.11/100
- National rank
- #6823
- State rank
- #301 of 517 in CA
Livability — Atwater
- Score
- 68/100
- State rank
- #295
- US rank
- #9893
Category grades
Schools grade is shown separately in the Schools card above.
Census & demographics
- Census place
- Atwater, CA
- County
- Merced County · 205,386 people
- City population
- 43,009
- Metro
- Merced, CA
- Population (ZIP)
- 43,009
- Household income
- $68,349
- Rent vs Own
- Severe rent burden
- 1477.0
Population outlook (Merced County) Hauer SSP2
- Today (2025)
- 285,501 people
- By 2030
- 293,437 · +2.8%
- By 2040
- 308,808 · +8.2%
- By 2050
- 321,011 · +12.4%
- By 2075
- 338,497 · +18.6%
- By 2100
- 330,493 · +15.8%
Race, ethnicity, and origin ACS 2023
- Neighborhood character
- Diverse neighborhood (Simpson 0.61)
- Race & ethnicity
- Hispanic / Latino 53% White 33% Two or more races 11% Asian 6% Black 4% Native American 1%
- Hispanic origin (detail)
- Mexican 50%
- Common ancestry
- Russian 7% Slovak 1% Iranian 1%
- Foreign-born
- 21% · Canada
- Languages at home
- 56% English-only · Spanish 37% Other Indo-European 3% Other Asian/Pacific 2%
Political lean MEDSL · Merced
- 2024 margin
- Toss-up / Even · D 46.5% · R 50.9% · Other 2.6%
- 2008→2024 swing
- -12.7pp toward R · 2008: 8.3pp · 2024: -4.4pp
- All cycles
- 2024: R+4.4 2020: D+10.6 2016: D+7.9 2012: D+5.4 2008: D+8.3
Not yet ingested
- Civics
- —
Market trends
- HPI YoY
- ▼ -365.43%
- Current HPI
- 281.52
- Rent YoY
- —
- Metro
- Merced, CA
- State GDP YoY
- ▲ 3.21%
- F500 in state
- 116
Industry mix (Fortune 500 HQ in CA)
| Industry | F500 HQs | Revenue |
|---|---|---|
| Technology | 27 | $1,492B |
|
||
| Financial Services | 3 | $174B |
|
||
| Retail | 3 | $44B |
|
||
| Insurance | 3 | $26B |
|
||
| Media / Entertainment | 2 | $115B |
|
||
| Pharmaceuticals / Biotech | 2 | $62B |
|
||
Property tax history
-0.2%/yrLatest (2020): $137 · -1.0% YoY. Source: county tax records.
Cash-flow waterfall
monthlySold comps — $/sqft
last 12 mo · ≤1 miLoading sold comps…