 Duplex
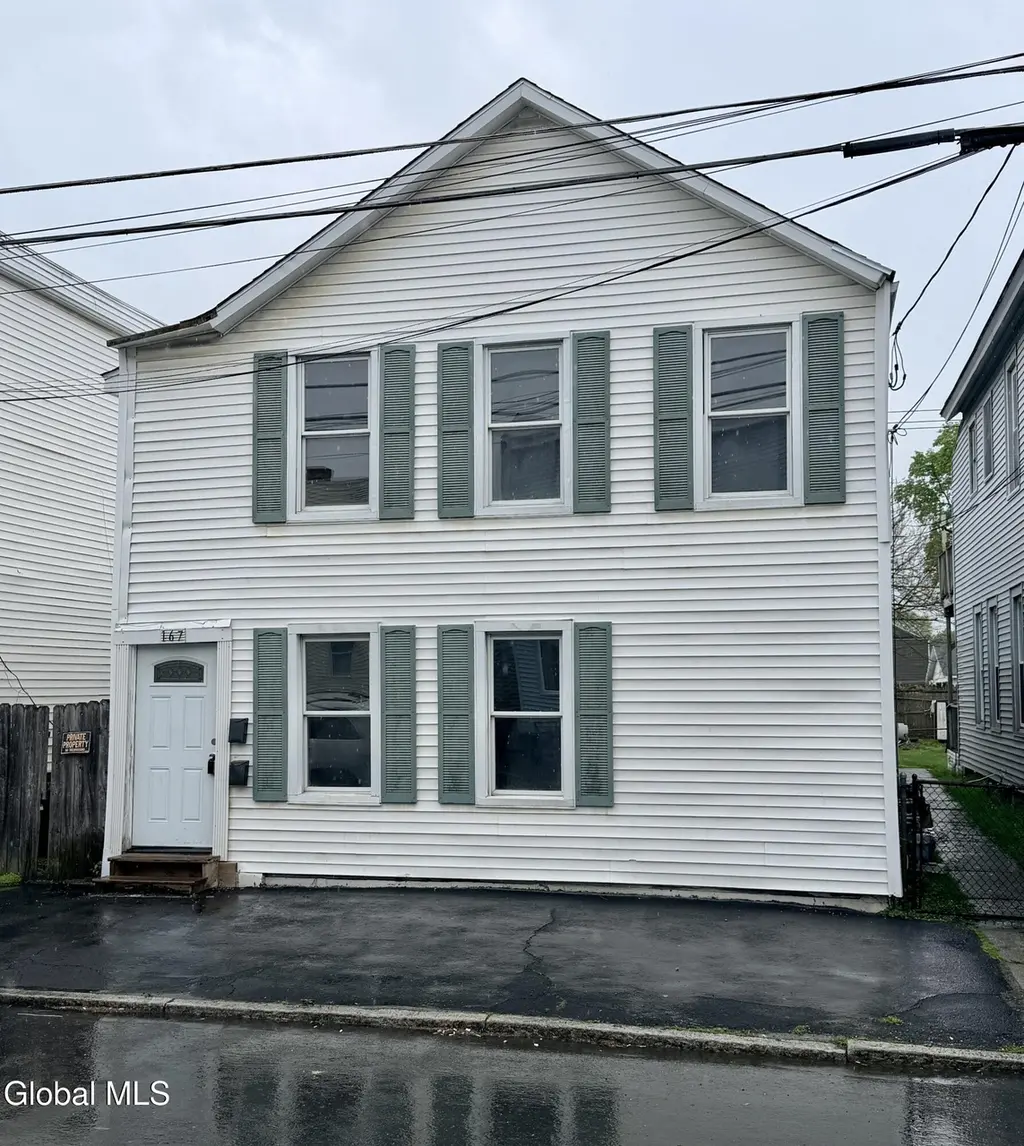
167 Paine St · Green Island, NY
Flood risk 9/10 · Severe
- FEMA flood zone
- AE
- Chance of flooding over 30 yrs
- 0.99%
- Est. flood insurance / yr
- $2,026 – $9,024
Fire risk 3/10 · Minor
- Est. fire insurance / yr
- $691 – $1,283
Heat risk 4/10 · Minor
- Hot days now (above 98°F)
- 7 days/yr
- Hot days in 30 yrs
- 17 days/yr
Wind risk 3/10 · Minor
- Chance of severe wind over 30 yrs
- 6.0%
Air-quality risk 2/10 · Minimal
- Unhealthy air days now
- 0 days/yr
- Unhealthy air days in 30 yrs
- 1 days/yr
Risk factors via First Street. Map © Google.
Why this score? — see what drove the B- grade
The composite is a weighted blend of 9 inputs, each scored 0–100. Each bar is that input's sub-score; the figure is the points it added to the 100-point composite (weight × sub-score).
- Cash flow +30.0/30.0
- 1% rule +10.0/10.0
- DSCR +10.0/10.0
- Livability +3.9/5.0
- Appreciation +3.6/10.0
- Rent growth +2.5/5.0
- Schools +2.5/10.0
- Condition / age +2.5/5.0
- ARV discount +0.0/15.0
$178,000
🖨 Deal sheet (PDF) 📄 Offer letter ✓ Due diligence
Multi-family units
County records classify this as Multi-Family (2-4 Unit). Listing-text estimate: 2 units. confirmed
Listing remarks MLS
Own it for less than you're paying in rent! If purchasing your 1st home a 2 family is the way to go. Excellent condition, great tenants, CHEAP Electricity as Green Island has their own power supply. New roof, new H2O tanks, low taxes, nice yard. Excellent Condition
Key facts
- Newer flooring
- Fresh paint
- Fenced-in backyard
Tags
Property features AI
Exterior
- Utilities: 150 amp electric service with circuit breakers; Public sewer; Public water
- Home design: Duplex; 2 total units
- Construction: Aluminum siding; Vinyl siding; Block foundation; Built using traditional construction materials
- Exterior features: Asphalt roof; Back yard with fencing; Fenced yard
Interior
- Kitchen: Each unit includes one kitchen
- Bedrooms: Unit 1: 3 bedrooms (all on 1st floor); Unit 2: 3 bedrooms (all on 2nd floor)
- Flooring: Vinyl flooring; Laminate flooring
- Bathrooms: Two full bathrooms (one on 1st floor, one on 2nd floor)
- Heating & cooling: Electric heating available; Natural gas heating available
- Interior features: Paddle fan
- Laundry & utility: Washer hookup; Electric dryer hookup
Neighborhood map
What this means for you Summary
Snapshot
- This is a 2 × 3-bed/1.0-bath units multifamily listed at $178k.
Deal economics
- At list price, monthly cash flow is $2k ($22k/yr) — positive. Per door: $934/mo.
- The deal already cash-flows at list — no discount required.
- Meets the 1% rule at list price ($5k rent vs $178k).
Location & tenants
- Location reads 77/100 on livability (#186 in NY, #2,758 nationally) — a middle-class / working-renter tenant base. Strengths: commute A+, housing A+, health & safety A+; Watch: employment D, schools F.
- Green Island Union Free School District (suburban): math 20% / reading 30% proficiency, ranked #740 of 755 in NY (top 98%) — low school quality limits family demand, transient renter base, plan for 1-2y turnover.
- Market conditions: 8 active listings in the ZIP; 33 comparable units currently listed for rent nearby; rentals at typical pace (median 20d on market — plan ~3-4 weeks tenant-placement turnaround); 675 units permitted in Albany County in 2024 (451 in 5+ unit buildings).
Forward outlook
- Local home prices are declining (-2.7%/yr); year-one equity from $1k of loan paydown is wiped out by about $5k of value loss. Plan a longer hold.
- Albany County population projected at +9% by 2050 — modest demand growth; plan on rents tracking national, not racing it.
- At projected returns (-2.7% appreciation + 3.0% rent growth), your $50k cash investment doubles in ~3 years — after that, you're playing with house money.
Negotiation context
- Only 3 days on market — expect competitive offers; lowballing is unlikely to land.
- 3 sale attempts since 18y ago with the ask held roughly flat each time — persistent listings suggest the price (not the market) is what's stuck; bring a comps-based counter.
- Current owner paid $104k; list at $178k implies a 71% gain — meaningful room to come down on a strong offer.
Risks & watch-outs
- Watch-outs: flood insurance adds $460/mo; built in 1920 — expect roof / HVAC / electrical / plumbing capex.
- Climate carrying-cost: in FEMA flood zone AE (mandatory federal flood insurance) — expect insurance premiums to compound above CPI over the hold.
Questions for the listing agent
- Can we see the unit-by-unit rent roll, current vacancy, and any below-market leases? What's the average tenancy length?
- What capital expenditures (roof, boiler, parking lot, exteriors) have been made in the last 5 years, and what's planned in the next 2?
- Built in 1920 — when were the roof, HVAC, electrical panel, plumbing, and water heater last replaced?
- What's the actual annual flood-insurance premium (NFIP or private), and is the property in a SFHA with mandatory coverage?
- Is there a deadline driving the sale (1031 exchange, divorce, estate, relocation)? That informs how much negotiation room exists.
- Schools are F-rated, which usually means shorter tenancies and higher turnover. Who's the typical renter profile here, and what's been the actual vacancy rate?
- What's the average days-on-market for RENTAL listings here right now (not sales)? A rising rental-DOM trend means longer vacancies and softer asking-rent achievability than the comps imply.
- What's the recent tenant-quality profile in this submarket — average credit score on applications, eviction rate, late-payment / NSF rate, and stable-employment percentage? A property-management company in the area should have these aggregated.
- How much new apartment / multifamily construction is in the pipeline within 1–3 miles? Heavy new supply (>2% of stock underway) typically softens rents 12–24 months out; light construction supports rent growth.
Investment metrics
- 1% rule
- 2.57% ✓
- Cap rate
- 21.99%
- Cash-on-cash
- 56.07%
- DSCR
- 3.49
- GRM
- 3.2
CMA / ARV
- ARV (on-the-fly)
- $129,184
- Comps found
- 3
Show comp detail 3 sales within ~0.75 mi
| Address | Dist | Beds/Ba | Sqft | Sold | Price | $/sf | Match |
|---|---|---|---|---|---|---|---|
| 172 Paine St | 0.03mi | 4/2.0 | 1,640 (+12%) | 4mo | $145,000 | $88 | 76 |
| 321 9th St | 0.66mi | 4/2.0 | 1,488 (+1%) | 18mo | $144,000 | $97 | 52 |
| 31 Bond St | 0.56mi | 5/2.0 (+1) | 1,676 (+14%) | 8mo | $140,000 | $84 | 39 |
Match score weights: distance 35% · size 25% · config 20% · recency 20%. Top-matched comps best support the ARV.
Projected returns pro-forma
-2.71% appreciation · 3.0% rent growth · sell at horizon
- IRR
- 42.6%
- Equity multiple
- 2.86×
- Total profit
- $92,739
- Equity at exit
- $28,873
- IRR
- 48.4%
- Equity multiple
- 5.76×
- Total profit
- $237,435
- Equity at exit
- $19,428
Cash invested: $49,840 (down + closing). Projections, not guarantees.
Landlord ↔ Tenant lean methodology
- Overall (STATE)
- 15 Strongly Tenant-Friendly
- State New York
- 15 Strongly Tenant-Friendly · D+10
- County
- — inherits STATE
- City
- — inherits STATE
ZIP-level market 12183
- Home prices YoY
- -1.5%
- Active inventory
- 8
- Price-to-rent
- 6.5×
Monthly cashflow live
- Estimated rent
- $4,568 high interval (Pro) →
- Mortgage (P&I)
- −$933
- Tax from tax record
- −$272 /mo · $3,266/yr
- Insurance
- −$74
- Flood insurance flood zone
- −$460 /mo · $5,525/yr
- HOA
- −$0
- Vacancy / Maint / Mgmt
- −$959
- Net cashflow
- $1,869
Break-even live
Sensitivity live
| Price | -10% $1,969 | -5% $1,919 | +0% $1,869 | +5% $1,818 | +10% $1,768 |
|---|---|---|---|---|---|
| Rent | -10% $1,508 | -5% $1,688 | +0% $1,869 | +5% $2,049 | +10% $2,229 |
| Rate | -1.0pp $1,958 | -0.5pp $1,914 | base $1,869 | +0.5pp $1,822 | +1.0pp $1,775 |
2-unit breakdown (identical units grouped — click to expand)
| Units | Beds | Baths | Est. rent |
|---|---|---|---|
| 2× units | 3 | 1 | $4,568 |
| #1 | 3 | 1 | $2,284 |
| #2 | 3 | 1 | $2,284 |
| Total (2 units) | $4,568 | ||
UW: 25.0% down · 7.5% · 30yr · 1.5% tax · 5.0% vac · 8.0% maint · 8.0% mgmt
Financing live
Cash to close
- Down payment
- $44,500
- Closing costs
- $5,340
- Reserves months
- —
- Total cash needed
- —
Loan-product check · same deal, 3 products live
Conventional
25% down · 7.5% · 30yr
- Down + closing
- —
- Monthly P&I
- —
- Monthly cashflow
- —
- DSCR
- —
- Eligible?
- —
Personal DTI + credit; lowest rate.
DSCR
20% down · 8.5% · 30yr
- Down + closing
- —
- Monthly P&I
- —
- Monthly cashflow
- —
- DSCR
- —
- Eligible?
- —
No personal income docs; deal must DSCR.
Hard money
10% down · 12.0% · 12mo
- Down + closing
- —
- Monthly P&I
- —
- Monthly cashflow
- —
- DSCR
- —
- Eligible?
- —
Short-term bridge; refi at stabilization.
Rent comps 33 comps
| Address | Beds | Baths | Sqft | Rent | $/sqft | DOM | Units | Dist |
|---|---|---|---|---|---|---|---|---|
| 143 President St Unit 2 Troy, NY | 4.0 | 1.0 | 1200 | $1,900 | $1.58 | 15d | 1 | 0.52mi |
| 3132-3134 6th Ave Troy, NY | 3.0 | 1.0 | 950 | $1,350 | $1.42 | 15d | 1 | 0.60mi |
| 362 9th St Unit 1st Floor Troy, NY | 3.0 | 1.0 | 1156 | $1,575 | $1.36 | 24d | 1 | 0.67mi |
| 362 9th St Unit 1st Floor Troy, NY | 3.0 | 1.0 | 1156 | $1,575 | $1.36 | 20d | 1 | 0.67mi |
| 195 9th St Troy, NY | 3.0 | 2.0 | 1500 | $750 | $0.50 | 20d | 1 | 0.76mi |
| 164 9th St Unit 1 Troy, NY | 4.0 | 2.0 | 1400 | $1,800 | $1.29 | 24d | 1 | 0.82mi |
| 238 8th St Troy, NY | 3.0 | 2.0 | 1200 | $2,200 | $1.83 | 24d | 1 | 0.84mi |
| 169 Hutton St Unit 1 Troy, NY | 3.0 | 1.0 | 1500 | $595 | $0.40 | 20d | 1 | 0.85mi |
| 136 9th St Unit 2 Troy, NY | 3.0 | 1.0 | 1500 | $600 | $0.40 | 20d | 1 | 0.87mi |
| 136 9th St Unit 1 Troy, NY | 3.0 | 1.0 | 1500 | $595 | $0.40 | 20d | 1 | 0.87mi |
| 136 9th St Unit 3 Troy, NY | 4.0 | 1.0 | 1500 | $595 | $0.40 | 20d | 1 | 0.87mi |
| 196 10th St Troy, NY | 3.0 | 1.0 | 1200 | $695 | $0.58 | 20d | 1 | 0.92mi |
| 2302 12th St Unit 1 Troy, NY | 3.0 | 1.0 | 1200 | $650 | $0.54 | 20d | 1 | 0.93mi |
| 2302 12th St Unit 2 Troy, NY | 3.0 | 1.0 | 1200 | $595 | $0.50 | 20d | 1 | 0.93mi |
| 904 Peoples Ave Troy, NY | 4.0 | 1.0 | 1800 | $645 | $0.36 | 20d | 1 | 0.97mi |
| 131 6th Ave Troy, NY | 4.0 | 1.0 | 1400 | $2,325 | $1.66 | 15d | 1 | 0.98mi |
| 140 5th Ave Unit 2 Troy, NY | 3.0 | 1.0 | 1200 | $1,395 | $1.16 | 24d | 1 | 0.99mi |
| 157 6th Ave Unit 2 Troy, NY | 3.0 | 1.0 | 1300 | $1,350 | $1.04 | 20d | 1 | 1.04mi |
| 2326 15th St Unit 1 Troy, NY | 4.0 | 1.5 | 1500 | $695 | $0.46 | 20d | 1 | 1.05mi |
| 17 State St Troy, NY | 4.0 | 1.0–1.5 | 1810 | $3,635 | $2.01 | 15d | 7 | 1.08mi |
| 2209 15th St Troy, NY | 3.0 | 1.0 | 950 | $2,595 | $2.73 | 24d | 1 | 1.12mi |
| 104 4th St Unit 2 Troy, NY | 3.0 | 1.0 | 950 | $1,800 | $1.89 | 15d | 1 | 1.14mi |
| 151 4th St Troy, NY | 4.0 | 1.0 | 1000 | $1,400 | $1.40 | 24d | 1 | 1.26mi |
| 1520 6th Ave Troy, NY | 2.0–4.0 | 2.0–4.0 | 1209 | $1,349 | $1.12 | 24d | 8 | 1.29mi |
| 288 Hoosick St Troy, NY | 3.0 | 1.0 | 1800 | $695 | $0.39 | 20d | 1 | 1.32mi |
| 124 Ferry St Troy, NY | 1.0–3.0 | 1.0–2.0 | 814 | $2,799 | $3.44 | 15d | 10 | 1.34mi |
| 338 Saratoga St Unit 2 Cohoes, NY | 3.0 | 1.5 | 1200 | $1,495 | $1.25 | 44d | 1 | 1.36mi |
| 290 2nd Ave Troy, NY | 3.0 | 1.0 | 1400 | $1,600 | $1.14 | 22d | 1 | 1.36mi |
| 1534 5th Ave #1 Watervliet, NY | 3.0 | 1.0 | 1200 | $1,595 | $1.33 | 44d | 1 | 1.44mi |
| 97 14th St Unit 2 Troy, NY | 5.0 | 2.0 | 1600 | $625 | $0.39 | 20d | 1 | 1.48mi |
| 97 14th St Troy, NY | 4.0 | 2.0 | 1500 | $650 | $0.43 | 20d | 1 | 1.48mi |
| 1513 5th Ave Unit 2 Watervliet, NY | 3.0 | 1.0 | 1200 | $1,550 | $1.29 | 15d | 1 | 1.49mi |
| 36 Farm St Troy, NY | 4.0 | 2.0 | 1100 | $695 | $0.63 | 15d | 1 | 1.50mi |
Listing history 12 events
-
2026-05-15status Pending
-
2026-05-11$178,000 Active
-
2009-07-30soldstatus $104,000
-
2009-07-13soldstatus $104,000 268-char remark
Show marketing remark (268 chars)
Own it for less than you're paying in rent! If purchasing your 1st home a 2 family is the way to go. Excellent condition, great tenants, CHEAP Electricity as Green Island has their own power supply. New roof, new H2O tanks, low taxes, nice yard. Excellent Condition
-
2009-05-08historical 268-char remark
Show marketing remark (268 chars)
Own it for less than you're paying in rent! If purchasing your 1st home a 2 family is the way to go. Excellent condition, great tenants, CHEAP Electricity as Green Island has their own power supply. New roof, new H2O tanks, low taxes, nice yard. Excellent Condition
-
2008-10-09$114,000 268-char remark
Show marketing remark (268 chars)
Own it for less than you're paying in rent! If purchasing your 1st home a 2 family is the way to go. Excellent condition, great tenants, CHEAP Electricity as Green Island has their own power supply. New roof, new H2O tanks, low taxes, nice yard. Excellent Condition
-
2008-10-08historical
-
2008-04-04$99,999
-
2006-09-18soldstatus $107,000
-
2006-06-22soldstatus $80,000
-
2003-10-22soldstatus $62,000
-
2003-10-08soldstatus $40,000
ⓘ Source: listings_history table (triggers on properties + properties_extension) + one-shot
backfill from property_details.listing_events for pre-trigger history.
Tax reassessment forecast NY · Partial reset (capped growth)
- Current annual tax
- $3,266 · $272/mo
- Projected year-2 tax
- $3,266 · $272/mo
- Expected delta
- $0/yr ($0/mo · 0.0%)
ⓘ Screening estimate from a state-policy table — verify with the county assessor before closing.
Climate risk First Street
- Flood 9/10 Extreme FEMA zone AE · 99% chance over 30 yrs
- Wildfire 3/10 Moderate
- Heat 4/10 Moderate 7 d/yr ≥98°F today · 17 d/yr by 30 yrs out
- Wind 3/10 Moderate 6% chance of damaging wind over 30 yrs
- Air quality 2/10 Low 0 unhealthy d/yr today · 1 by 30 yrs out
Nearby sold comps map
Loading sold comps map…
Walkable amenities ~0.75 mi
Loading nearby amenities…
Taxation est. · year 1
- Rental income
- $54,816
- − Mortgage interest
- −$9,971
- − Property taxes
- −$3,266
- − Insurance
- −$6,415
- − Repairs & maintenance
- −$4,385
- − Management
- −$4,385
- − Depreciation
- −$5,178
- Taxable income
- $21,216
- Est. tax owed @ 24.0%
- −$5,092
- After-tax cash flow
- $17,331/yr
For passive investors: Depreciation is non-cash, so a rental often shows a tax loss while cash-flowing — sheltering income. Rental losses are passive: they offset passive income freely, and up to $25,000/yr can offset ordinary (W-2) income if you actively participate and your MAGI is under $100k (phasing out to $0 by $150k); unused losses carry forward. On sale, claimed depreciation is recaptured at up to 25%, and gains may owe capital-gains tax (a 1031 exchange can defer both). Figures are a year-1 estimate at your 24.0% rate — not tax advice; consult a CPA.
Schools (NCES district)
- District
- Green Island Union Free School District
- NCES district ID
- 3612660
- Math proficiency
- 20% ▬ 0.00%
- Reading proficiency
- 30% ▲ 5.00%
- Median HH income
- $51,151
- Composite
- 25.19/100
- National rank
- #12922
- State rank
- #740 of 755 in NY
Livability — Green Island
- Score
- 77/100
- State rank
- #186
- US rank
- #2758
Category grades
Schools grade is shown separately in the Schools card above.
Census & demographics
- Census place
- Green Island, NY
- City population
- 2,966
- Population (ZIP)
- 2,966
Population outlook (Albany County) Hauer SSP2
- Today (2025)
- 320,794 people
- By 2030
- 327,401 · +2.1%
- By 2040
- 338,218 · +5.4%
- By 2050
- 348,467 · +8.6%
- By 2075
- 381,693 · +19.0%
- By 2100
- 393,809 · +22.8%
Race, ethnicity, and origin ACS 2023
- Neighborhood character
- Predominantly White (66%)
- Race & ethnicity
- White 66% Hispanic / Latino 16% Black 9% Two or more races 8% Asian 1%
- Hispanic origin (detail)
- Puerto Rican 15%
- Common ancestry
- Lithuanian 5% Romanian 3% Iranian 2%
- Foreign-born
- 2% · China, Canada
- Languages at home
- 94% English-only · Spanish 4% Chinese 1% Other Indo-European 1%
Political lean MEDSL · Albany
- 2024 margin
- Strong D (+25.8) · D 62.9% · R 37.1%
- 2008→2024 swing
- -3.6pp toward R · 2008: 29.4pp · 2024: 25.8pp
- All cycles
- 2024: D+25.8 2020: D+31.4 2016: D+24.3 2012: D+31.0 2008: D+29.4
Not yet ingested
- Civics
- —
Market trends
- HPI YoY
- ▼ -2.71%
- Current HPI
- 177.2848
- Rent YoY
- —
- Metro
- —
- State GDP YoY
- ▲ 2.60%
- F500 in state
- 92
Industry mix (Fortune 500 HQ in NY)
| Industry | F500 HQs | Revenue |
|---|---|---|
| Financial Services | 10 | $950B |
|
||
| Consumer Goods | 9 | $162B |
|
||
| Insurance | 4 | $225B |
|
||
| Telecommunications | 2 | $144B |
|
||
| Pharmaceuticals | 2 | $112B |
|
||
| Media / Entertainment | 2 | $69B |
|
||
Price history
+345.0% since first listed12 events — show timeline
- 2026-05-15 Pending — Global MLS
- 2026-05-11 Listed $178,000 Global MLS
- 2009-07-30 Sold (Public Records) $104,000 Public Records
- 2009-07-13 Sold (MLS) $104,000 Global MLS
- 2009-05-08 Listing Removed — Global MLS
- 2008-10-09 Listed $114,000 Global MLS
- 2008-10-08 Listing Removed — Global MLS
- 2008-04-04 Listed $99,999 Global MLS
- 2006-09-18 Sold (Public Records) $107,000 Public Records
- 2006-06-22 Sold (Public Records) $80,000 Public Records
- 2003-10-22 Sold (Public Records) $62,000 Public Records
- 2003-10-08 Sold (Public Records) $40,000 Public Records
Property tax history
+0.5%/yrLatest (2025): $3,266 · -1.0% YoY. Source: county tax records.
Cash-flow waterfall
monthlySold comps — $/sqft
last 12 mo · ≤1 miLoading sold comps…