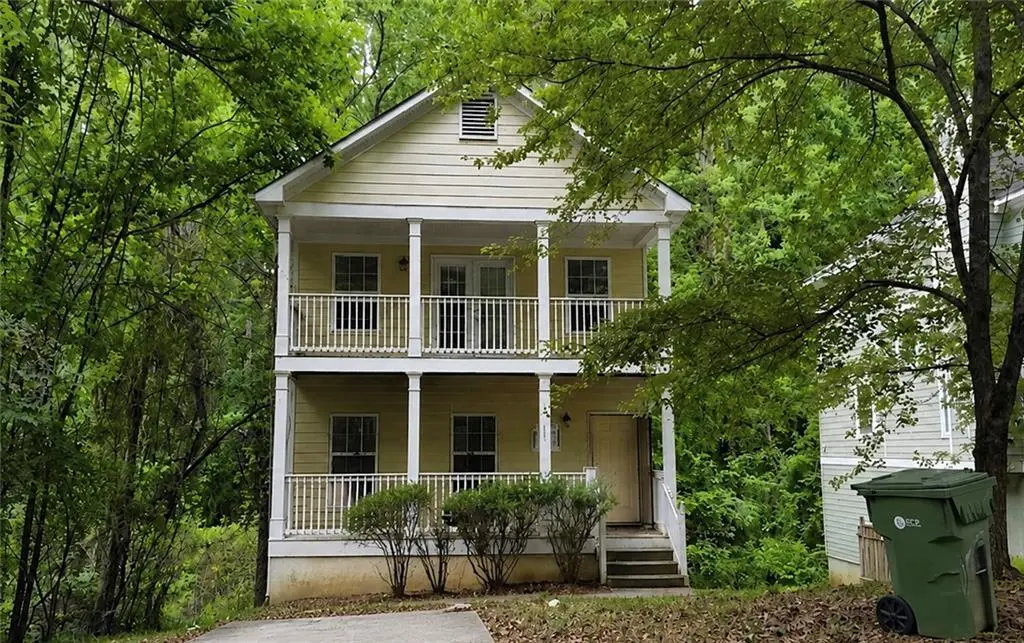
935 Hall St NW · Atlanta, GA
Flood risk 4/10 · Minor
- FEMA flood zone
- X (unshaded)
- Chance of flooding over 30 yrs
- 0.13%
- Est. flood insurance / yr
- $473 – $860
Fire risk 2/10 · Minimal
- Est. fire insurance / yr
- $963 – $1,789
Heat risk 5/10 · Moderate
- Hot days now (above 104°F)
- 7 days/yr
- Hot days in 30 yrs
- 16 days/yr
Wind risk 5/10 · Moderate
- Chance of severe wind over 30 yrs
- 25.0%
Air-quality risk 4/10 · Minor
- Unhealthy air days now
- 3 days/yr
- Unhealthy air days in 30 yrs
- 5 days/yr
Risk factors via First Street. Map © Google.
Why this score? — see what drove the C+ grade
The composite is a weighted blend of 9 inputs, each scored 0–100. Each bar is that input's sub-score; the figure is the points it added to the 100-point composite (weight × sub-score).
- Cash flow +21.3/30.0
- ARV discount +15.0/15.0
- 1% rule +7.5/10.0
- DSCR +6.8/10.0
- Livability +4.2/5.0
- Rent growth +3.3/5.0
- Schools +2.7/10.0
- Condition / age +2.5/5.0
- Appreciation +0.0/10.0
$185,000
🖨 Deal sheet 📄 Offer letter ✓ Due diligence
Listing remarks
4 bed, 3.5 bath home in NW Atlanta offering approx. 1,628 sq ft on a ~6,500 sq ft lot, built in 2006. No HOA. Features an open floor plan with spacious living area, fireplace, and access to a rear deck—ideal for entertaining or outdoor use. Property requires repairs and updates and is priced as a handyman/investor special. Sold as-is with strong upside potential for renovation, resale, or rental. Conveniently located near Downtown Atlanta, Mercedes-Benz Stadium, major highways, and rapidly developing Westside areas in an established neighborhood.
Key facts
- Open floor plan
- Spacious living area
- Rear deck
Tags
Property features AI
Finance
- HOA & community: Association fees billed annually
Exterior
- Parking: Two total parking spaces; On-street parking available; Open parking
- Utilities: Public water; Public sewer; 220-volt electric service; Cable available; Electricity available; Natural gas available; Underground utilities; Water available; Sewer available
- Home design: Two levels; Resale condition; Frame construction; Shingle roof
- Construction: Frame construction; Shingle roof
- Exterior features: Rear stairs; Deck
Interior
- Kitchen: Breakfast bar; Stained cabinets; Laminate counters; View to family room; Dishwasher; Electric oven; Range hood
- Bedrooms: Four upper-level bedrooms; Bedroom features: Other
- Flooring: Carpet; Hardwood
- Bathrooms: Three full bathrooms; One half bathroom (main level); Master bathroom with tub/shower combo
- Heating & cooling: Natural gas heating; Central air conditioning
- Interior features: One fireplace located in the family room; Open-concept dining area; Bonus room, computer room, exercise room, living room, and office
- Laundry & utility: Dedicated laundry room
Neighborhood map
What this means for you Summary
Snapshot
- This is a 4-bed/3.5-bath single-family listed at $185k.
Deal economics
- At list price, monthly cash flow is $273 ($3k/yr) — positive.
- The deal already cash-flows at list — no discount required.
- Meets the 1% rule at list price ($2k rent vs $185k).
- Recommended offer: $182k (1.5% below list) — sets the bar for market timing.
- Cap rate 8.1% vs local median 3.1% in Atlanta — top-decile yield for the area; either an underpriced asset or a hidden risk that comps aren't pricing in. Stress-test before assuming the spread holds.
Location & tenants
- Location reads 83/100 on livability (#6 in GA, #919 nationally) — a professional / high-income tenant draw. Strengths: amenities A+, commute A+, housing A+; Watch: cost of living C-.
- Atlanta Public Schools (urban): math 28% / reading 35% proficiency, ranked #80 of 174 in GA (top 46%) — families likely to look elsewhere, expect single-tenant / working-renter base with shorter leases; 71% free/reduced lunch — lower-income household profile, screen leases tightly.
- Zoned schools: John Lewis Invictus Academy (math 2% / reading 2%, grade F, #470 of 470 statewide, top 100%, 825 students, 100% FRL); Frederick Douglass High School (math 24%, 1,112 students, 100% FRL) — zoned schools average 100% FRL vs 71% district-wide (29 pts higher); higher-poverty schools than district average — tighter screening recommended.
- Zoned-school proficiency averages 2% at this address vs 32% district-wide (-29 pts) — the specific schools serving this property underperform the Atlanta Public Schools average; the district grade overstates school quality for this exact location.
- Market conditions: Rents rising (+3.3%/yr); 722 active listings in the ZIP; 40 comparable units currently listed for rent nearby; rentals at typical pace (median 24d on market — plan ~3-4 weeks tenant-placement turnaround); solid renter incomes; 11,565 units permitted in Fulton County in 2024 (8,159 in 5+ unit buildings).
- This rent runs 34% of the median local income ($83k/yr) — at the standard rent-burdened threshold; future hikes will face affordability resistance.
Forward outlook
- Local home prices are declining (-3.0%/yr); year-one equity from $1k of loan paydown is wiped out by about $6k of value loss. Plan a longer hold.
- Fulton County population projected at +38% by 2050 — long-run rental-demand tailwind backs the buy-and-hold thesis.
Negotiation context
- It's been on market 15 days — a 2% lower offer ($182k) is reasonable based on typical stale-listing flexibility.
Risks & watch-outs
- Watch-outs: property tax is 3.3% of price.
- Climate carrying-cost: moderate wind risk, 25% chance of damaging wind over 30y; extreme-heat days projected 7→16/yr by 2055 (HVAC capex compounding) — expect insurance premiums to compound above CPI over the hold.
Questions for the listing agent
- Property tax is high relative to price — has the assessment been appealed recently, and will the sale trigger a re-assessment?
- Is there a deadline driving the sale (1031 exchange, divorce, estate, relocation)? That informs how much negotiation room exists.
- What's the average days-on-market for RENTAL listings here right now (not sales)? A rising rental-DOM trend means longer vacancies and softer asking-rent achievability than the comps imply.
- What's the recent tenant-quality profile in this submarket — average credit score on applications, eviction rate, late-payment / NSF rate, and stable-employment percentage? A property-management company in the area should have these aggregated.
- How much new for-sale + rental construction is in the pipeline within 1–3 miles? Heavy new supply typically softens prices + rents 12–24 months out; constrained supply supports both.
Investment metrics
- 1% rule
- 1.25% ✓
- Cap rate
- 8.06%
- Cash-on-cash
- 6.31%
- DSCR
- 1.28
- GRM
- 6.6
CMA / ARV
- ARV (median comp)
- $360,958
- List price
- $185,000
- Delta
- -48.75%
- Verdict
- UNDERPRICED
- Comps
- 20 within 1.0 mi
Show comp detail 12 sales within ~0.75 mi
| Address | Dist | Beds/Ba | Sqft | Sold | Price | $/sf | Match |
|---|---|---|---|---|---|---|---|
| 2259 Sisk St NW | 0.21mi | 3/2.5 (-1) | 1,535 (-6%) | 4mo | $175,000 | $114 | 68 |
| 1135 4th St NW | 0.46mi | 3/2.5 (-1) | 1,649 (+1%) | 0mo | $355,000 | $215 | 67 |
| 1141 4th St NW | 0.46mi | 3/2.5 (-1) | 1,649 (+1%) | 1mo | $359,000 | $218 | 67 |
| 858 Hall St | 0.16mi | 3/2.0 (-1) | 1,500 (-8%) | 3mo | $295,000 | $197 | 66 |
| 2222 Hill St NW | 0.19mi | 4/2.0 | 1,442 (-11%) | 3mo | $260,000 | $180 | 63 |
| 848 Capitol View Ave NW | 0.20mi | 4/2.0 | 1,456 (-11%) | 6mo | $287,000 | $197 | 62 |
| 2548 Bellview Ave NW | 0.43mi | 4/2.5 | 1,792 (+10%) | 6mo | $200,000 | $112 | 54 |
| 793 Ayrshire Cir NW | 0.69mi | 4/2.0 | 1,710 (+5%) | 0mo | $299,900 | $175 | 53 |
| 631 Church St NW | 0.58mi | 4/3.0 | 1,810 (+11%) | 1mo | $357,000 | $197 | 51 |
| 671 Center Hill Ave NW | 0.52mi | 3/2.0 (-1) | 1,510 (-7%) | 5mo | $275,000 | $182 | 49 |
| 2470 Saint Paul Ave NW | 0.64mi | 3/2.0 (-1) | 1,395 (-14%) | 2mo | $305,000 | $219 | 34 |
| 581 Woods Dr NW | 0.68mi | 3/2.0 (-1) | 1,400 (-14%) | 5mo | $363,000 | $259 | 30 |
Match score weights: distance 35% · size 25% · config 20% · recency 20%. Top-matched comps best support the ARV.
Projected returns pro-forma
-3.0% appreciation · 3.26% rent growth · sell at horizon
- IRR
- -6.1%
- Equity multiple
- 0.77×
- Total profit
- $-11,804
- Equity at exit
- $27,584
- IRR
- 4.0%
- Equity multiple
- 1.30×
- Total profit
- $15,428
- Equity at exit
- $15,995
Cash invested: $51,800 (down + closing). Projections, not guarantees.
Landlord ↔ Tenant lean methodology
- Overall (STATE)
- 90 Strongly Landlord-Friendly
- State Georgia
- 90 Strongly Landlord-Friendly · R+3
- County
- — inherits STATE
- City
- — inherits STATE
ZIP-level market 30318
- Rents YoY
- 3.3%
- Active inventory
- 722
- Price-to-rent
- 6.6×
Monthly cashflow live
- Estimated rent
- $2,320 high interval (Pro) →
- Mortgage (P&I)
- −$970
- Tax from tax record
- −$513 /mo · $6,161/yr
- Insurance
- −$77
- HOA
- −$0
- Vacancy / Maint / Mgmt
- −$487
- Net cashflow
- $273
Break-even live
UW: 25.0% down · 7.5% · 30yr · 1.5% tax · 5.0% vac · 8.0% maint · 8.0% mgmt
Financing live
Cash to close
- Down payment
- $46,250
- Closing costs
- $5,550
- Reserves months
- —
- Total cash needed
- —
Loan-product check · same deal, 3 products live
Conventional
25% down · 7.5% · 30yr
- Down + closing
- —
- Monthly P&I
- —
- Monthly cashflow
- —
- DSCR
- —
- Eligible?
- —
Personal DTI + credit; lowest rate.
DSCR
20% down · 8.5% · 30yr
- Down + closing
- —
- Monthly P&I
- —
- Monthly cashflow
- —
- DSCR
- —
- Eligible?
- —
No personal income docs; deal must DSCR.
Hard money
10% down · 12.0% · 12mo
- Down + closing
- —
- Monthly P&I
- —
- Monthly cashflow
- —
- DSCR
- —
- Eligible?
- —
Short-term bridge; refi at stabilization.
Rent comps 40 comps
| Address | Beds | Baths | Sqft | Rent | $/sqft | DOM | Units | Dist |
|---|---|---|---|---|---|---|---|---|
| 991 Ada Ave NW Atlanta, GA | 4.0 | 2.0 | 1458 | $2,450 | $1.68 | 24d | 1 | 0.07mi |
| 2355 Hill St NW Atlanta, GA | 3.0 | 3.0 | 1320 | $1,700 | $1.29 | 24d | 1 | 0.08mi |
| 874 Center Hill Ave NW Atlanta, GA | 3.0 | 2.0 | 1176 | $1,695 | $1.44 | 24d | 1 | 0.16mi |
| 2367 Summit Ave NW Atlanta, GA | 4.0 | 2.5 | 1887 | $2,800 | $1.48 | 2d | 1 | 0.20mi |
| 929 N Grand Ave NW Atlanta, GA | 3.0 | 2.0 | 1100 | $2,500 | $2.27 | 24d | 1 | 0.23mi |
| 960 N Grand Ave NW Atlanta, GA | 3.0 | 2.5 | 1510 | $1,950 | $1.29 | 24d | 1 | 0.24mi |
| 841 Ridge Ave NW Atlanta, GA | 5.0 | 3.0 | 2196 | $2,423 | $1.10 | 20d | 1 | 0.24mi |
| 848 Ridge Ave NW Unit A Atlanta, GA | 3.0 | 2.5 | 1410 | $1,875 | $1.33 | 24d | 1 | 0.25mi |
| 854 N Grand Ave NW Atlanta, GA | 4.0 | 2.5 | 1436 | $1,824 | $1.27 | 24d | 1 | 0.27mi |
| 838 Ridge Ave NW Atlanta, GA | 3.0 | 2.5 | 1452 | $1,953 | $1.35 | 24d | 1 | 0.27mi |
| 1127 2nd NW Atlanta, GA | 4.0 | 2.5 | 2000 | $3,240 | $1.62 | 15d | 1 | 0.34mi |
| 1127 2nd NW Atlanta, GA | 4.0 | 2.5 | 2000 | $3,240 | $1.62 | 24d | 1 | 0.34mi |
| 753 Prince Pl NW Atlanta, GA | 4.0 | 2.0 | 1785 | $2,200 | $1.23 | 24d | 1 | 0.35mi |
| 751 Prince Pl NW Atlanta, GA | 4.0 | 2.0 | 1785 | $2,200 | $1.23 | 24d | 1 | 0.35mi |
| 739 Prince Pl NW Atlanta, GA | 4.0 | 2.0 | 1903 | $2,200 | $1.16 | 24d | 1 | 0.37mi |
| 740 Prince Pl NW Atlanta, GA | 4.0 | 2.0 | 1903 | $2,200 | $1.16 | 24d | 1 | 0.38mi |
| 738 Prince Pl NW Atlanta, GA | 4.0 | 2.5 | 1903 | $2,250 | $1.18 | 24d | 1 | 0.39mi |
| 2595 Elliott St NW Atlanta, GA | 4.0 | 2.0 | 1101 | $1,900 | $1.73 | 11d | 1 | 0.42mi |
| 717 Church St NW Atlanta, GA | 4.0 | 2.0 | 1328 | $2,000 | $1.51 | 24d | 1 | 0.44mi |
| 1006 Hightower Rd NW Atlanta, GA | 3.0 | 2.0 | 1320 | $2,065 | $1.56 | 14d | 1 | 0.46mi |
| 2456 Spring St NW Apt A Atlanta, GA | 4.0 | 2.5 | 1650 | $1,450 | $0.88 | 24d | 1 | 0.47mi |
| 38 Hollywood Dr NW Atlanta, GA | 4.0 | 2.0 | 1400 | $2,200 | $1.57 | 24d | 1 | 0.51mi |
| 2364 Cross St NW Atlanta, GA | 3.0 | 1.0 | 1168 | $1,500 | $1.28 | 17d | 1 | 0.56mi |
| 2431 Saint Paul Ave NW Atlanta, GA | 3.0 | 2.0 | 1134 | $2,045 | $1.80 | 2d | 1 | 0.64mi |
| 1110 Cato St NW Atlanta, GA | 3.0 | 1.0 | 1050 | $1,400 | $1.33 | 24d | 1 | 0.65mi |
| 1120 Wedgewood Dr NW Atlanta, GA | 4.0 | 2.5 | 1904 | $3,100 | $1.63 | 7d | 1 | 0.67mi |
| 646 Robert St NW Atlanta, GA | 3.0 | 2.0 | 1374 | $2,400 | $1.75 | 18d | 1 | 0.69mi |
| 624 Robert St NW Atlanta, GA | 3.0 | 2.0 | 1221 | $3,000 | $2.46 | 24d | 1 | 0.70mi |
| 2045 Lois Pl NW Unit A Atlanta, GA | 5.0 | 3.0 | 1344 | $3,450 | $2.57 | 18d | 1 | 0.71mi |
| 562 Gary Rd NW Atlanta, GA | 4.0 | 2.0 | 1700 | $2,400 | $1.41 | 24d | 1 | 0.77mi |
| 1026 Sims Ave NW Unit B Atlanta, GA | 4.0 | 3.0 | 1492 | $2,842 | $1.90 | 24d | 1 | 0.77mi |
| 1212 James Jackson Pkwy NW Atlanta, GA | 3.0 | 2.0 | 1211 | $1,782 | $1.47 | 14d | 1 | 0.83mi |
| 24 S Eugenia Pl NW Atlanta, GA | 4.0 | 2.5 | 1410 | $1,725 | $1.22 | 24d | 1 | 0.84mi |
| 2662 Hood Ave NW Atlanta, GA | 3.0 | 2.0 | 1450 | $2,000 | $1.38 | 24d | 1 | 0.86mi |
| 2705 Lincoln Ct NW Atlanta, GA | 3.0 | 2.0 | 1134 | $2,050 | $1.81 | 18d | 1 | 0.87mi |
| 1955 East Ave NW Unit A Atlanta, GA | 4.0 | 3.0 | 1800 | $1,990 | $1.11 | 15d | 1 | 0.88mi |
| 714 Emily Pl NW Atlanta, GA | 3.0 | 2.0 | 1492 | $2,700 | $1.81 | 3d | 1 | 0.90mi |
| 971 Colquitt Pl NW Unit A Atlanta, GA | 4.0 | 3.0 | 1750 | $800 | $0.46 | 24d | 1 | 0.90mi |
| 438 Hamilton E Holmes Dr NW Atlanta, GA | 4.0 | 3.0 | 2200 | $5,500 | $2.50 | 24d | 1 | 0.97mi |
| 1359 Creek View Ln NW Atlanta, GA | 3.0 | 2.5 | 2129 | $3,000 | $1.41 | 24d | 1 | 0.97mi |
Listing history 6 events
-
2026-05-07$185,000 Active 558-char remark
-
2006-11-07soldstatus $260,000
-
2005-04-21soldstatus $84,000
-
2004-07-23soldstatus $80,000
-
2003-11-04soldstatus $86,615
-
2003-03-25soldstatus $77,900
ⓘ Source: listings_history table (triggers on properties + properties_extension) + one-shot
backfill from property_details.listing_events for pre-trigger history.
Tax reassessment forecast GA · Resets to sale price
- Current annual tax
- $6,161 · $513/mo
- Projected year-2 tax
- $6,161 · $513/mo
- Expected delta
- $0/yr ($0/mo · 0.0%)
ⓘ Screening estimate from a state-policy table — verify with the county assessor before closing.
Climate risk First Street
- Flood 4/10 Moderate FEMA zone X (unshaded) · 13% chance over 30 yrs
- Wildfire 2/10 Low
- Heat 5/10 Major 7 d/yr ≥104°F today · 16 d/yr by 30 yrs out
- Wind 5/10 Major 25% chance of damaging wind over 30 yrs
- Air quality 4/10 Moderate 3 unhealthy d/yr today · 5 by 30 yrs out
Nearby sold comps map
Loading sold comps map…
Walkable amenities ~0.75 mi
Loading nearby amenities…
Taxation est. · year 1
- Rental income
- $27,846
- − Mortgage interest
- −$10,363
- − Property taxes
- −$6,161
- − Insurance
- −$925
- − Repairs & maintenance
- −$2,228
- − Management
- −$2,228
- − Depreciation
- −$5,382
- Taxable income
- $560
- Est. tax owed @ 24.0%
- −$134
- After-tax cash flow
- $3,136/yr
For passive investors: Depreciation is non-cash, so a rental often shows a tax loss while cash-flowing — sheltering income. Rental losses are passive: they offset passive income freely, and up to $25,000/yr can offset ordinary (W-2) income if you actively participate and your MAGI is under $100k (phasing out to $0 by $150k); unused losses carry forward. On sale, claimed depreciation is recaptured at up to 25%, and gains may owe capital-gains tax (a 1031 exchange can defer both). Figures are a year-1 estimate at your 24.0% rate — not tax advice; consult a CPA.
Schools (NCES district)
- District
- Atlanta Public Schools
- NCES district ID
- 1300120
- Math proficiency
- 28% ▼ -6.00%
- Reading proficiency
- 35% ▼ -2.00%
- Median HH income
- $48,306
- Composite
- 27.27/100
- National rank
- #7006
- State rank
- #80 of 174 in GA
Livability — Atlanta
- Score
- 83/100
- State rank
- #6
- US rank
- #919
Category grades
Schools grade is shown separately in the Schools card above.
Census & demographics
- Census place
- Atlanta, GA
- County
- Fulton County · 1,094,430 people
- City population
- 629,525
- Metro
- Atlanta-Sandy Springs-Alpharetta, GA
- Population (ZIP)
- 59,609
- Household income
- $83,116
- Rent vs Own
- Severe rent burden
- 4182.0
Population outlook (Fulton County) Hauer SSP2
- Today (2025)
- 1,203,707 people
- By 2030
- 1,299,706 · +8.0%
- By 2040
- 1,488,256 · +23.6%
- By 2050
- 1,664,580 · +38.3%
- By 2075
- 2,036,072 · +69.2%
- By 2100
- 2,222,402 · +84.6%
Race, ethnicity, and origin ACS 2023
- Neighborhood character
- Diverse neighborhood (Simpson 0.63)
- Race & ethnicity
- Black 49% White 35% Hispanic / Latino 7% Two or more races 6% Asian 5%
- Hispanic origin (detail)
- Mexican 2% Puerto Rican 1%
- Common ancestry
- Lithuanian 2% Slovak 2% Romanian 1%
- Foreign-born
- 8% · Canada, China, South Korea
- Languages at home
- 88% English-only · Spanish 4% Other Indo-European 2% Other Asian/Pacific 1%
Political lean MEDSL · Fulton
- 2024 margin
- Solid D (+44.9) · D 71.9% · R 27.0% · Other 1.1%
- 2008→2024 swing
- +9.8pp toward D · 2008: 35.0pp · 2024: 44.9pp
- All cycles
- 2024: D+44.9 2020: D+46.4 2016: D+42.1 2012: D+29.6 2008: D+35.0
Not yet ingested
- Civics
- —
Market trends
- HPI YoY
- ▼ -470.82%
- Current HPI
- 224.1493
- Rent YoY
- ▲ 3.26%
- Metro
- Atlanta-Sandy Springs-Alpharetta, GA
- State GDP YoY
- ▲ 2.66%
- F500 in state
- 28
Industry mix (Fortune 500 HQ in GA)
| Industry | F500 HQs | Revenue |
|---|---|---|
| Paper / Packaging | 2 | $29B |
|
||
| Retail | 1 | $160B |
|
||
| Transportation / Logistics | 1 | $91B |
|
||
| Airlines | 1 | $62B |
|
||
| Consumer Goods | 1 | $47B |
|
||
| Utilities | 1 | $25B |
|
||
Price history
+137.5% since first listed7 events — show timeline
- 2026-05-22 Pending — FMLS
- 2026-05-07 Listed $185,000 FMLS
- 2006-11-07 Sold (Public Records) $260,000 Public Records
- 2005-04-21 Sold (Public Records) $84,000 Public Records
- 2004-07-23 Sold (Public Records) $80,000 Public Records
- 2003-11-04 Sold (Public Records) $86,615 Public Records
- 2003-03-25 Sold (Public Records) $77,900 Public Records
Property tax history
+7.9%/yrLatest (2025): $6,161 · +228.2% YoY. Source: county tax records.
Cash-flow waterfall
monthlySold comps — $/sqft
last 12 mo · ≤1 miLoading sold comps…