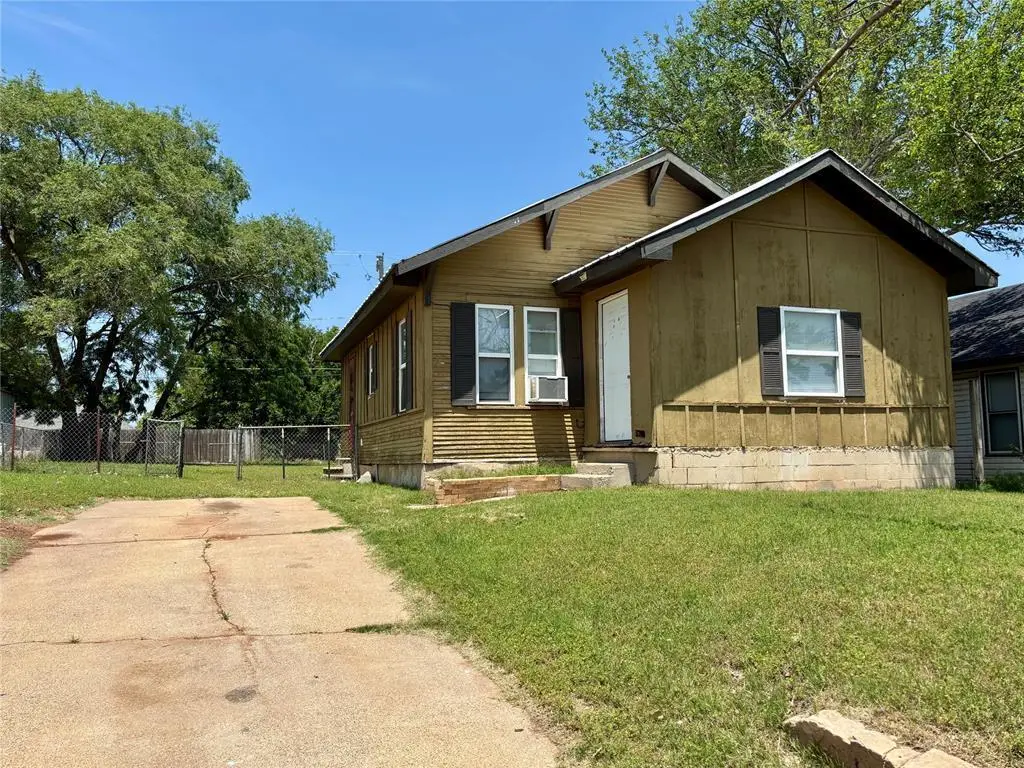
703 W B Ave · Elk City, OK
Flood risk 1/10 · Minimal
- FEMA flood zone
- X
- Chance of flooding over 30 yrs
- 0.0%
- Est. flood insurance / yr
- $435 – $905
Fire risk 3/10 · Minor
- Est. fire insurance / yr
- $2,463 – $4,575
Heat risk 6/10 · Moderate
- Hot days now (above threshold)
- 7 days/yr
- Hot days in 30 yrs
- 20 days/yr
Wind risk No data
- Chance of severe wind over 30 yrs
- —
Air-quality risk No data
- Unhealthy air days now
- —
- Unhealthy air days in 30 yrs
- —
Risk factors via First Street. Map © Google.
Why this score? — see what drove the B grade
The composite is a weighted blend of 9 inputs, each scored 0–100. Each bar is that input's sub-score; the figure is the points it added to the 100-point composite (weight × sub-score).
- Cash flow +30.0/30.0
- ARV discount +15.0/15.0
- 1% rule +10.0/10.0
- DSCR +10.0/10.0
- Livability +3.2/5.0
- Rent growth +2.5/5.0
- Condition / age +2.5/5.0
- Schools +1.3/10.0
- Appreciation +0.0/10.0
$55,000
🖨 Deal sheet 📄 Offer letter ✓ Due diligence
Listing remarks MLS
Great investment property. “AS IS WHERE IS”
Key facts
- Metal roof
- Foundation repaired
- New flooring
Tags
Property features AI
Finance
- Other: Located in Northwest addition; No storm shelter; Homestead not claimed
- Financial info: Sold as-is; eligible for cash or conventional financing; Not assumable
- HOA & community: No mandatory association dues
Exterior
- Home design: Single family residence; Single-story; Existing property; Entry level: One
- Construction: Metal roof; Other construction materials; Slab foundation; Built (existing)
- Exterior features: Interior lot; No exterior features listed
Interior
- Bedrooms: 2 bedrooms
- Bathrooms: 1 full bathroom
- Heating & cooling: Other heating; Window unit cooling
- Interior features: One living area; No fireplace
Neighborhood map
What this means for you Summary
Snapshot
- This is a 1-bed/1.0-bath single-family listed at $55k.
Deal economics
- At list price, monthly cash flow is $296 ($4k/yr) — positive.
- The deal already cash-flows at list — no discount required.
- Meets the 1% rule at list price ($823 rent vs $55k).
- Cap rate 12.8% vs local median 4.1% in Elk City — top-decile yield for the area; either an underpriced asset or a hidden risk that comps aren't pricing in. Stress-test before assuming the spread holds.
Location & tenants
- Location reads 65/100 on livability (#141 in OK) — a middle-class / working-renter tenant base. Strengths: cost of living A+, housing A, crime B+; Watch: employment D+, schools F, amenities F.
- Elk City (town): math 14% / reading 15% proficiency, ranked #218 of 270 in OK (top 81%) — low school quality limits family demand, transient renter base, plan for 1-2y turnover.
- Market conditions: 122 active listings in the ZIP; 16 units permitted in Beckham County in 2024 (0 in 5+ unit buildings).
Forward outlook
- Local home prices are declining (-3.0%/yr); year-one equity from $380 of loan paydown is wiped out by about $2k of value loss. Plan a longer hold.
- Beckham County population projected at +35% by 2050 — long-run rental-demand tailwind backs the buy-and-hold thesis.
- At projected returns (-3.0% appreciation + 3.0% rent growth), your $15k cash investment doubles in ~6 years — after that, you're playing with house money.
Negotiation context
- Only 14 days on market — expect competitive offers; lowballing is unlikely to land.
- 6 sale attempts since 8y ago with the ask held roughly flat each time — persistent listings suggest the price (not the market) is what's stuck; bring a comps-based counter.
- Current owner paid $34k; list at $55k implies a 62% gain — meaningful room to come down on a strong offer.
Risks & watch-outs
- Watch-outs: built in 1935 — expect roof / HVAC / electrical / plumbing capex.
- Climate carrying-cost: extreme-heat days projected 7→20/yr by 2055 (HVAC capex compounding) — expect insurance premiums to compound above CPI over the hold.
Questions for the listing agent
- Built in 1935 — when were the roof, HVAC, electrical panel, plumbing, and water heater last replaced?
- Is there a deadline driving the sale (1031 exchange, divorce, estate, relocation)? That informs how much negotiation room exists.
- Schools are F-rated, which usually means shorter tenancies and higher turnover. Who's the typical renter profile here, and what's been the actual vacancy rate?
- What's the average days-on-market for RENTAL listings here right now (not sales)? A rising rental-DOM trend means longer vacancies and softer asking-rent achievability than the comps imply.
- What's the recent tenant-quality profile in this submarket — average credit score on applications, eviction rate, late-payment / NSF rate, and stable-employment percentage? A property-management company in the area should have these aggregated.
- How much new for-sale + rental construction is in the pipeline within 1–3 miles? Heavy new supply typically softens prices + rents 12–24 months out; constrained supply supports both.
Investment metrics
- 1% rule
- 1.50% ✓
- Cap rate
- 12.75%
- Cash-on-cash
- 23.07%
- DSCR
- 2.03
- GRM
- 5.6
CMA / ARV
- ARV (on-the-fly)
- $76,048
- Comps found
- 11
Show comp detail 11 sales within ~0.75 mi
| Address | Dist | Beds/Ba | Sqft | Sold | Price | $/sf | Match |
|---|---|---|---|---|---|---|---|
| 719 N Walker Ave | 0.17mi | 2/1.0 (+1) | 760 (-3%) | 22mo | $35,150 | $46 | 64 |
| 1322 W Broadway Ave | 0.59mi | 2/1.0 (+1) | 812 (+4%) | 5mo | $23,000 | $28 | 58 |
| 1217 W 6th St | 0.61mi | 2/1.0 (+1) | 710 (-9%) | 3mo | $99,000 | $139 | 48 |
| 418 W 8th St | 0.68mi | 2/1.0 (+1) | 712 (-9%) | 4mo | $48,100 | $68 | 45 |
| 503 S Washington Ave | 0.69mi | 2/1.0 (+1) | 720 (-8%) | 6mo | $70,000 | $97 | 44 |
| 1010 N Washington Ave | 0.37mi | 2/1.0 (+1) | 900 (+15%) | 15mo | $115,000 | $128 | 41 |
| 114 Blackburn Blvd | 0.71mi | 2/1.0 (+1) | 728 (-7%) | 11mo | $78,000 | $107 | 40 |
| 414 W 8th St | 0.68mi | 2/1.0 (+1) | 720 (-8%) | 12mo | $40,000 | $56 | 40 |
| 601 S Howard Ave | 0.74mi | 2/1.0 (+1) | 720 (-8%) | 11mo | $97,500 | $135 | 38 |
| 412 W 8th St | 0.69mi | 2/1.0 (+1) | 864 (+10%) | 11mo | $28,000 | $32 | 37 |
| 305 S Elk Ave | 0.63mi | 2/1.0 (+1) | 832 (+6%) | 23mo | $86,000 | $103 | 37 |
Match score weights: distance 35% · size 25% · config 20% · recency 20%. Top-matched comps best support the ARV.
Projected returns pro-forma
-3.0% appreciation · 3.0% rent growth · sell at horizon
- IRR
- 16.1%
- Equity multiple
- 1.65×
- Total profit
- $9,945
- Equity at exit
- $8,201
- IRR
- 24.7%
- Equity multiple
- 3.14×
- Total profit
- $32,931
- Equity at exit
- $4,755
Cash invested: $15,400 (down + closing). Projections, not guarantees.
Landlord ↔ Tenant lean methodology
- Overall (STATE)
- 83 Strongly Landlord-Friendly
- State Oklahoma
- 83 Strongly Landlord-Friendly · R+20
- County
- — inherits STATE
- City
- — inherits STATE
ZIP-level market 73644
- Home prices YoY
- -24.0%
- Active inventory
- 122
- Price-to-rent
- 5.6×
Monthly cashflow live
- Estimated rent
- $823 medium interval (Pro) →
- Mortgage (P&I)
- −$288
- Tax from tax record
- −$43 /mo · $514/yr
- Insurance
- −$23
- HOA
- −$0
- Vacancy / Maint / Mgmt
- −$173
- Net cashflow
- $296
Break-even live
UW: 25.0% down · 7.5% · 30yr · 1.5% tax · 5.0% vac · 8.0% maint · 8.0% mgmt
Financing live
Cash to close
- Down payment
- $13,750
- Closing costs
- $1,650
- Reserves months
- —
- Total cash needed
- —
Loan-product check · same deal, 3 products live
Conventional
25% down · 7.5% · 30yr
- Down + closing
- —
- Monthly P&I
- —
- Monthly cashflow
- —
- DSCR
- —
- Eligible?
- —
Personal DTI + credit; lowest rate.
DSCR
20% down · 8.5% · 30yr
- Down + closing
- —
- Monthly P&I
- —
- Monthly cashflow
- —
- DSCR
- —
- Eligible?
- —
No personal income docs; deal must DSCR.
Hard money
10% down · 12.0% · 12mo
- Down + closing
- —
- Monthly P&I
- —
- Monthly cashflow
- —
- DSCR
- —
- Eligible?
- —
Short-term bridge; refi at stabilization.
Listing history 27 events
-
2026-06-15statusdays on market $55,000 Pending 14 DOM
-
2026-06-13days on market $55,000 Active 13 DOM
-
2026-06-12days on market $55,000 Active 12 DOM
-
2026-06-09days on market $55,000 Active 9 DOM
-
2026-06-08days on market $55,000 Active 8 DOM
-
2026-06-08days on market $55,000 Active 7 DOM
-
2026-06-07days on market $55,000 Active 6 DOM
-
2026-06-04days on market $55,000 Active 3 DOM
-
2026-06-02days on market $55,000 Active 2 DOM
-
2026-06-01pricedays on market $55,000 Active 1 DOM
-
2026-05-25historical
-
2026-04-16status Active
-
2026-03-24status Pending
-
2026-02-07status Active
-
2026-01-29status Pending
-
2026-01-02price $45,000
-
2025-09-04price $49,999
-
2025-05-21$55,000 Active
-
2025-05-21historical
-
2025-05-09$55,000 Active
-
2023-03-17soldstatus $34,000 Closed 56-char remark
Show marketing remark (56 chars)
Great investment property. “AS IS WHERE IS”
-
2023-02-22status Pending 56-char remark
Show marketing remark (56 chars)
Great investment property. “AS IS WHERE IS”
-
2022-06-27price $34,900 56-char remark
Show marketing remark (56 chars)
Great investment property. “AS IS WHERE IS”
-
2022-03-21$39,000 Active 56-char remark
Show marketing remark (56 chars)
Great investment property. “AS IS WHERE IS”
-
2019-05-03historical
-
2018-02-14$34,900
-
2012-09-26soldstatus $35,000
ⓘ Source: listings_history table (triggers on properties + properties_extension) + one-shot
backfill from property_details.listing_events for pre-trigger history.
Tax reassessment forecast OK · Resets to sale price
- Current annual tax
- $514 · $43/mo
- Projected year-2 tax
- $514 · $43/mo
- Expected delta
- $0/yr ($0/mo · 0.0%)
ⓘ Screening estimate from a state-policy table — verify with the county assessor before closing.
Climate risk First Street
- Flood 1/10 Low FEMA zone X · 0% chance over 30 yrs
- Wildfire 3/10 Moderate
- Heat 6/10 Major
Nearby sold comps map
Loading sold comps map…
Walkable amenities ~0.75 mi
Loading nearby amenities…
Taxation est. · year 1
- Rental income
- $9,878
- − Mortgage interest
- −$3,081
- − Property taxes
- −$514
- − Insurance
- −$275
- − Repairs & maintenance
- −$790
- − Management
- −$790
- − Depreciation
- −$1,600
- Taxable income
- $2,828
- Est. tax owed @ 24.0%
- −$679
- After-tax cash flow
- $2,875/yr
For passive investors: Depreciation is non-cash, so a rental often shows a tax loss while cash-flowing — sheltering income. Rental losses are passive: they offset passive income freely, and up to $25,000/yr can offset ordinary (W-2) income if you actively participate and your MAGI is under $100k (phasing out to $0 by $150k); unused losses carry forward. On sale, claimed depreciation is recaptured at up to 25%, and gains may owe capital-gains tax (a 1031 exchange can defer both). Figures are a year-1 estimate at your 24.0% rate — not tax advice; consult a CPA.
Schools (NCES district)
- District
- Elk City
- NCES district ID
- 4010740
- Math proficiency
- 14% ▼ -11.00%
- Reading proficiency
- 15% ▼ -14.00%
- Median HH income
- $49,040
- Composite
- 13.26/100
- National rank
- #9547
- State rank
- #218 of 270 in OK
Livability — Elk City
- Score
- 65/100
- State rank
- #141
- US rank
- #13090
Category grades
Schools grade is shown separately in the Schools card above.
Census & demographics
- Census place
- Elk City, OK
- City population
- 13,687
- Population (ZIP)
- 13,687
Population outlook (Beckham County) Hauer SSP2
- Today (2025)
- 26,564 people
- By 2030
- 28,217 · +6.2%
- By 2040
- 31,865 · +20.0%
- By 2050
- 35,862 · +35.0%
- By 2075
- 47,189 · +77.6%
- By 2100
- 55,622 · +109.4%
Race, ethnicity, and origin ACS 2023
- Neighborhood character
- Predominantly White (80%)
- Race & ethnicity
- White 80% Hispanic / Latino 15% Two or more races 6% Black 1% Asian 1%
- Hispanic origin (detail)
- Mexican 13%
- Common ancestry
- Iranian 2% Lithuanian 2% Italian 2%
- Foreign-born
- 4% · Canada, China
- Languages at home
- 89% English-only · Spanish 10%
Political lean MEDSL · Beckham
- 2024 margin
- Solid R (+70.1) · D 14.2% · R 84.3% · Other 1.4%
- 2008→2024 swing
- -14.0pp toward R · 2008: -56.1pp · 2024: -70.1pp
- All cycles
- 2024: R+70.1 2020: R+72.0 2016: R+70.8 2012: R+59.1 2008: R+56.1
Not yet ingested
- Civics
- —
Market trends
- HPI YoY
- ▼ -56.11%
- Current HPI
- 178.0217
- Rent YoY
- —
- Metro
- —
- State GDP YoY
- ▲ 1.55%
- F500 in state
- 6
Industry mix (Fortune 500 HQ in OK)
| Industry | F500 HQs | Revenue |
|---|---|---|
| Energy | 3 | $48B |
|
||
Price history
+28.6% since first listed17 events — show timeline
- 2026-05-25 Listing Removed — MLSOK
- 2026-04-16 Relisted — MLSOK
- 2026-03-24 Pending — MLSOK
- 2026-02-07 Relisted — MLSOK
- 2026-01-29 Pending — MLSOK
- 2026-01-02 Price Changed $45,000 MLSOK
- 2025-09-04 Price Changed $49,999 MLSOK
- 2025-05-21 Listing Removed — MLSOK
- 2025-05-21 Listed $55,000 MLSOK
- 2025-05-09 Listed $55,000 MLSOK
- 2023-03-17 Sold (MLS) $34,000 MLSOK
- 2023-02-22 Pending — MLSOK
- 2022-06-27 Price Changed $34,900 MLSOK
- 2022-03-21 Listed $39,000 MLSOK
- 2019-05-03 Listing Removed — MLSOK
- 2018-02-14 Listed $34,900 MLSOK
- 2012-09-26 Sold (Public Records) $35,000 Public Records
Property tax history
+7.9%/yrLatest (2025): $514 · +4.9% YoY. Source: county tax records.
Cash-flow waterfall
monthlySold comps — $/sqft
last 12 mo · ≤1 miLoading sold comps…