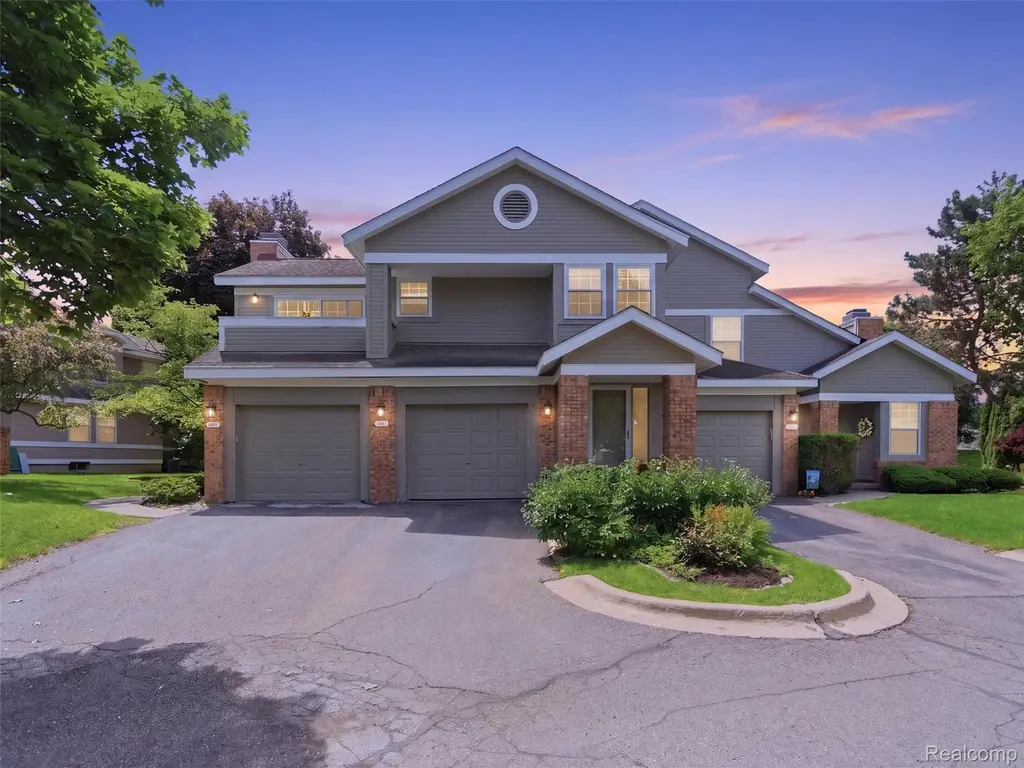
6605 Firestone Ct · Farmington Hills, MI
Flood risk 4/10 · Minor
- FEMA flood zone
- X (unshaded)
- Chance of flooding over 30 yrs
- 0.22%
- Est. flood insurance / yr
- $473 – $860
Fire risk 1/10 · Minimal
- Est. fire insurance / yr
- $784 – $1,456
Heat risk 2/10 · Minimal
- Hot days now (above 96°F)
- 7 days/yr
- Hot days in 30 yrs
- 15 days/yr
Wind risk 2/10 · Minimal
- Chance of severe wind over 30 yrs
- —
Air-quality risk 3/10 · Minor
- Unhealthy air days now
- 2 days/yr
- Unhealthy air days in 30 yrs
- 4 days/yr
Risk factors via First Street. Map © Google.
Why this score? — see what drove the F grade
The composite is a weighted blend of 9 inputs, each scored 0–100. Each bar is that input's sub-score; the figure is the points it added to the 100-point composite (weight × sub-score).
- ARV discount +7.5/15.0
- Cash flow +4.8/30.0
- Schools +4.5/10.0
- Livability +4.0/5.0
- 1% rule +3.1/10.0
- Condition / age +2.5/5.0
- Rent growth +2.4/5.0
- DSCR +0.0/10.0
- Appreciation +0.0/10.0
$249,900
🖨 Deal sheet (PDF) 📄 Offer letter ✓ Due diligence
Listing remarks MLS
Perfectly situated in the heart of West Bloomfield, this beautiful condo is walking distance to premier shopping, dining, and entertainment. Residents enjoy exceptional community amenities including a clubhouse, pool, and tennis courts, creating a resort-style experience right at home. Step inside to an inviting open floor plan filled with an abundance of natural light. The updated kitchen features shaker-style full overlay cabinetry, stainless steel appliances, and a custom spalted wood countertop with overhang seating, perfect for casual dining. A cozy breakfast nook adds charm and functionality to the space. The spacious family room showcases soaring vaulted ceilings, a stunning fireplace with stone surround and hearth, and a large door wall leading to a private balcony - the perfect place to unwind or enjoy morning coffee. The generous primary suite features a walk-in closet and a private bath complete with a relaxing jetted tub. An additional spacious second bedroom provides flexibility for guests, family, or a home office. The finished lower level offers exceptional additional living and entertaining space along with abundant storage options. Completing the home is a convenient 1-car attached garage. Offering an unbeatable location, outstanding amenities, and stylish updates throughout, this move-in ready condo is the perfect place to call home.
Key facts
- Open floor plan
- Clubhouse
- Community amenities
Tags
Property features AI
Finance
- Other: Pets allowed
- HOA & community: Homeowners association with monthly fee of $489; Community clubhouse; Tennis courts; Community pool
Exterior
- Parking: Attached garage with direct access (1 car)
- Utilities: Public water; Public sewer
- Home design: Residential condominium; One level; Ground-level entry; Brick and vinyl siding
- Construction: Brick and vinyl siding construction
- Exterior features: Balcony; Porch; Terrace; Community in-ground outdoor pool
Interior
- Kitchen: Dishwasher; Free-standing electric range; Microwave; Free-standing refrigerator
- Bathrooms: 2 full bathrooms
- Heating & cooling: Central air conditioning; Forced air heating; Natural gas heat
- Interior features: Gas water heater; Fireplace in family room; Partially finished basement; 7 total rooms
- Laundry & utility: Washer; Dryer
Neighborhood map
What this means for you Summary
Snapshot
- This is a 2-bed/2.0-bath condo listed at $250k.
Deal economics
- At list price, monthly cash flow is $-610 ($-7k/yr) — negative.
- To cash-flow at today's rent, offer at most $142k (43.1% below list).
- To meet the 1% rule (rent ≥ 1% of price), the offer needs to be $202k (19.1% below list).
- Recommended offer: $142k (43.1% below list) — sets the bar for cash-flow.
Location & tenants
- Location reads 81/100 on livability (#64 in MI, #1,364 nationally) — a professional / high-income tenant draw. Strengths: employment A+, housing A+, crime A; Watch: amenities D, health & safety F.
- West Bloomfield School District (suburban): math 42% / reading 55% proficiency, ranked #83 of 540 in MI (top 15%) — families likely to look elsewhere, expect single-tenant / working-renter base with shorter leases.
- Zoned schools: Doherty Elementary School (479 students, 36% FRL); West Bloomfield Middle School (math 46% / reading 55%, grade C, #110 of 493 statewide, top 23%, 941 students, 42% FRL); West Bloomfield High School (math 40% / reading 61%, grade D+, #146 of 713 statewide, top 21%, 1,652 students, 34% FRL).
- Market conditions: Rents soft (-0.4%/yr); 185 active listings in the ZIP; 9 comparable units currently listed for rent nearby; rentals leasing fast (median 0d on market — plan ~1-2 weeks tenant-placement turnaround); high-income renter base; 2,614 units permitted in Oakland County in 2024 (721 in 5+ unit buildings).
Forward outlook
- Local home prices are declining (-3.0%/yr); year-one equity from $2k of loan paydown is wiped out by about $7k of value loss. Plan a longer hold.
- Oakland County population projected at +10% by 2050 — modest demand growth; plan on rents tracking national, not racing it.
Negotiation context
- Only 13 days on market — expect competitive offers; lowballing is unlikely to land.
- 5 sale attempts since 10y ago; this cycle's ask has dropped $15k (6%) from the opening price — seller is motivated, your offer sets the floor, not the list.
- Current owner paid $130k; list at $250k implies a 92% gain — meaningful room to come down on a strong offer.
Risks & watch-outs
- Watch-outs: HOA is 24% of rent.
Questions for the listing agent
- What do current leases actually rent for vs. the listed asking? Can we see a recent rent roll and the last 12 months of T-12 income?
- What does the HOA fee cover, when was the last increase, and are there any pending special assessments or reserve-fund shortfalls?
- Any open or pending special assessments — roof, HVAC, plumbing, elevator, façade? What's the per-unit balance and payoff schedule, and is the seller paying it off at close or rolling it to the buyer?
- Is there a deadline driving the sale (1031 exchange, divorce, estate, relocation)? That informs how much negotiation room exists.
- Schools are B-rated — typically a magnet for longer-tenancy family renters. What's the average tenant stay here, and is there a school-zone premium baked into asking?
- The area grade is low — what's the realistic commute time and amenity access for the typical tenant pool here? Any planned neighborhood developments (good or bad) we should know about?
- What's the average days-on-market for RENTAL listings here right now (not sales)? A rising rental-DOM trend means longer vacancies and softer asking-rent achievability than the comps imply.
- What's the recent tenant-quality profile in this submarket — average credit score on applications, eviction rate, late-payment / NSF rate, and stable-employment percentage? A property-management company in the area should have these aggregated.
- How much new apartment / multifamily construction is in the pipeline within 1–3 miles? Heavy new supply (>2% of stock underway) typically softens rents 12–24 months out; light construction supports rent growth.
Investment metrics
- 1% rule
- 0.81% ✗
- Cap rate
- 3.37%
- Cash-on-cash
- -10.45%
- DSCR
- 0.53
- GRM
- 10.3
CMA / ARV
No comps found within radius.
Projected returns pro-forma
-3.0% appreciation · 0.0% rent growth · sell at horizon
- IRR
- -39.7%
- Equity multiple
- -0.21×
- Total profit
- $-84,912
- Equity at exit
- $37,261
- IRR
- -94.5%
- Equity multiple
- -1.08×
- Total profit
- $-145,494
- Equity at exit
- $21,607
Cash invested: $69,972 (down + closing). Projections, not guarantees.
Landlord ↔ Tenant lean methodology
- Overall (STATE)
- 62 Landlord-Friendly
- State Michigan
- 62 Landlord-Friendly · EVEN
- County
- — inherits STATE
- City
- — inherits STATE
ZIP-level market 48322
- Rents YoY
- -0.4%
- Active inventory
- 185
- Price-to-rent
- 10.3×
Monthly cashflow live
- Estimated rent
- $2,021 high interval (Pro) →
- Mortgage (P&I)
- −$1,311
- Tax from tax record
- −$302 /mo · $3,626/yr
- Insurance
- −$104
- HOA
- −$489
- Vacancy / Maint / Mgmt
- −$424
- Net cashflow
- $-610
Break-even live
Sensitivity live
| Price | -10% $-468 | -5% $-539 | +0% $-610 | +5% $-680 | +10% $-751 |
|---|---|---|---|---|---|
| Rent | -10% $-769 | -5% $-689 | +0% $-610 | +5% $-530 | +10% $-450 |
| Rate | -1.0pp $-484 | -0.5pp $-546 | base $-610 | +0.5pp $-674 | +1.0pp $-740 |
UW: 25.0% down · 7.5% · 30yr · 1.5% tax · 5.0% vac · 8.0% maint · 8.0% mgmt
Financing live
Cash to close
- Down payment
- $62,475
- Closing costs
- $7,497
- Reserves months
- —
- Total cash needed
- —
Loan-product check · same deal, 3 products live
Conventional
25% down · 7.5% · 30yr
- Down + closing
- —
- Monthly P&I
- —
- Monthly cashflow
- —
- DSCR
- —
- Eligible?
- —
Personal DTI + credit; lowest rate.
DSCR
20% down · 8.5% · 30yr
- Down + closing
- —
- Monthly P&I
- —
- Monthly cashflow
- —
- DSCR
- —
- Eligible?
- —
No personal income docs; deal must DSCR.
Hard money
10% down · 12.0% · 12mo
- Down + closing
- —
- Monthly P&I
- —
- Monthly cashflow
- —
- DSCR
- —
- Eligible?
- —
Short-term bridge; refi at stabilization.
Rent comps 9 comps
| Address | Beds | Baths | Sqft | Rent | $/sqft | DOM | Units | Dist |
|---|---|---|---|---|---|---|---|---|
| 6834 Chimney Hill Dr West Bloomfield, MI | 2.0 | 1.5–2.0 | 1085 | $1,888 | $1.74 | 0d | 19 | 0.07mi |
| 6616 Embers Ct West Bloomfield, MI | 2.0 | 2.0 | 1059 | $1,800 | $1.70 | 45d | 1 | 0.11mi |
| 6600 Bellows Ct West Bloomfield, MI | 2.0 | 2.0 | 1059 | $2,100 | $1.98 | 14d | 1 | 0.12mi |
| 6625 Fireside Ct West Bloomfield Township, MI | 2.0 | 2.0 | 1450 | $2,000 | $1.38 | 26d | 1 | 0.14mi |
| 7020 Orchard Lake Rd West Bloomfield, MI | 1.0–2.0 | 1.0–2.0 | 1103 | $4,470 | $4.05 | 0d | 28 | 0.38mi |
| 7110 Orchard Lake Rd West Bloomfield Township, MI | 1.0–2.0 | 1.0–2.0 | 1020 | $2,619 | $2.57 | 0d | 14 | 0.43mi |
| 31200 Hunters Dr Farmington Hills, MI | 1.0–3.0 | 1.0–2.5 | 1520 | $1,834 | $1.21 | 0d | 15 | 0.87mi |
| 5202 Richard Run West Bloomfield, MI | 3.0 | 2.5 | 1650 | $2,500 | $1.52 | 18d | 1 | 1.00mi |
| 5460 Bentley Rd West Bloomfield, MI | 2.0 | 1.0–2.0 | 1102 | $1,875 | $1.70 | 0d | 10 | 1.06mi |
HOA detail condo
- Monthly dues
- $489 · $5,868/yr
- Likely covers
- pool
- Assessments
- None detected in remarks — confirm with the listing agent.
Listing history 13 events
-
2026-06-21days on market $249,900 Active 13 DOM
-
2026-06-18days on market $249,900 Active 10 DOM
-
2026-06-17days on market $249,900 Active 9 DOM
-
2026-06-16days on market $249,900 Active 8 DOM
-
2026-06-15days on market $249,900 Active 7 DOM
-
2026-06-13days on market $249,900 Active 5 DOM
-
2026-06-08pricedays on market $249,900 Active 1 DOM
-
2026-06-07days on market $265,000 Active 9 DOM
-
2026-06-04days on market $265,000 Active 6 DOM
-
2026-06-03days on market $265,000 Active 5 DOM
-
2026-06-02days on market $265,000 Active 4 DOM
-
2026-06-01days on market $265,000 Active 3 DOM
-
2026-05-31days on market $265,000 Active 2 DOM
ⓘ Source: listings_history table (triggers on properties + properties_extension) + one-shot
backfill from property_details.listing_events for pre-trigger history.
Tax reassessment forecast MI · Partial reset (capped growth)
- Current annual tax
- $3,626 · $302/mo
- Projected year-2 tax
- $3,737 · $311/mo
- Expected delta
- +$111/yr (+$9/mo · 3.1%)
ⓘ Screening estimate from a state-policy table — verify with the county assessor before closing.
Climate risk First Street
- Flood 4/10 Moderate FEMA zone X (unshaded) · 22% chance over 30 yrs
- Wildfire 1/10 Low
- Heat 2/10 Low 7 d/yr ≥96°F today · 15 d/yr by 30 yrs out
- Wind 2/10 Low
- Air quality 3/10 Moderate 2 unhealthy d/yr today · 4 by 30 yrs out
Nearby sold comps map
Loading sold comps map…
Walkable amenities ~0.75 mi
Loading nearby amenities…
Taxation est. · year 1
- Rental income
- $24,247
- − Mortgage interest
- −$13,998
- − Property taxes
- −$3,626
- − Insurance
- −$1,250
- − Repairs & maintenance
- −$1,940
- − Management
- −$1,940
- − HOA
- −$5,868
- − Depreciation
- −$7,270
- Taxable loss
- −$11,644
- Est. tax savings @ 24.0%
- +$2,795
- After-tax cash flow
- $-4,520/yr
For passive investors: Depreciation is non-cash, so a rental often shows a tax loss while cash-flowing — sheltering income. Rental losses are passive: they offset passive income freely, and up to $25,000/yr can offset ordinary (W-2) income if you actively participate and your MAGI is under $100k (phasing out to $0 by $150k); unused losses carry forward. On sale, claimed depreciation is recaptured at up to 25%, and gains may owe capital-gains tax (a 1031 exchange can defer both). Figures are a year-1 estimate at your 24.0% rate — not tax advice; consult a CPA.
Schools (NCES district)
- District
- West Bloomfield School District
- NCES district ID
- 2635820
- Math proficiency
- 42% ▼ -6.00%
- Reading proficiency
- 55% ▼ -2.00%
- Median HH income
- $89,668
- Composite
- 45.28/100
- National rank
- #2653
- State rank
- #83 of 540 in MI
Livability — Farmington Hills
- Score
- 81/100
- State rank
- #64
- US rank
- #1364
Category grades
Schools grade is shown separately in the Schools card above.
Census & demographics
- County
- Oakland County · 1,009,092 people
- City population
- 67,612
- Metro
- Detroit-Warren-Dearborn, MI
- Population (ZIP)
- 32,885
- Household income
- $113,865
- Rent vs Own
- Severe rent burden
- 911.0
Population outlook (Oakland County) Hauer SSP2
- Today (2025)
- 1,335,747 people
- By 2030
- 1,375,100 · +2.9%
- By 2040
- 1,435,385 · +7.5%
- By 2050
- 1,469,250 · +10.0%
- By 2075
- 1,531,946 · +14.7%
- By 2100
- 1,450,485 · +8.6%
Race, ethnicity, and origin ACS 2023
- Neighborhood character
- Majority White (64%)
- Race & ethnicity
- White 64% Black 20% Asian 10% Two or more races 5% Hispanic / Latino 3%
- Common ancestry
- Arab 9% Romanian 5% Scotch-Irish 4%
- Foreign-born
- 25% · Canada, China
- Languages at home
- 71% English-only · Arabic 8% Other Indo-European 5% Other Asian/Pacific 3%
Political lean MEDSL · Oakland
- 2024 margin
- D (+10.6) · D 54.4% · R 43.8% · Other 1.9%
- 2008→2024 swing
- -3.9pp toward R · 2008: 14.5pp · 2024: 10.6pp
- All cycles
- 2024: D+10.6 2020: D+14.1 2016: D+8.1 2012: D+8.1 2008: D+14.5
Not yet ingested
- Civics
- —
Market trends
- HPI YoY
- ▼ -220.52%
- Current HPI
- 149.0523
- Rent YoY
- ▼ -0.43%
- Metro
- Detroit-Warren-Dearborn, MI
- State GDP YoY
- ▲ 1.37%
- F500 in state
- 28
Industry mix (Fortune 500 HQ in MI)
| Industry | F500 HQs | Revenue |
|---|---|---|
| Automotive Parts | 3 | $48B |
|
||
| Automotive | 2 | $372B |
|
||
| Chemicals | 1 | $45B |
|
||
| Automotive Retail | 1 | $29B |
|
||
| Healthcare / Medical Devices | 1 | $23B |
|
||
| Automotive Technology | 1 | $20B |
|
||
Price history
+89.4% since first listed13 events — show timeline
- 2026-05-29 Listed $265,000 MiRealSource-MiMLS
- 2026-05-29 Listed $265,000 REALCOMP
- 2016-05-17 Sold (Public Records) $130,000 Public Records
- 2016-05-05 Sold (MLS) $130,000 MiRealSource-MiMLS
- 2016-05-05 Sold (MLS) $130,000 REALCOMP
- 2016-04-07 Pending — MiRealSource-MiMLS
- 2016-04-01 Pending — REALCOMP
- 2016-03-22 Relisted — REALCOMP
- 2016-03-07 Pending — REALCOMP
- 2016-03-02 Listing Removed — MiRealSource-MiMLS
- 2016-03-01 Listed $133,900 MiRealSource-MiMLS
- 2016-02-04 Price Changed $133,900 REALCOMP
- 2016-02-04 Listed $139,900 REALCOMP
Property tax history
+2.7%/yrLatest (2025): $3,626 · +2.4% YoY. Source: county tax records.
Cash-flow waterfall
monthlySold comps — $/sqft
last 12 mo · ≤1 miLoading sold comps…