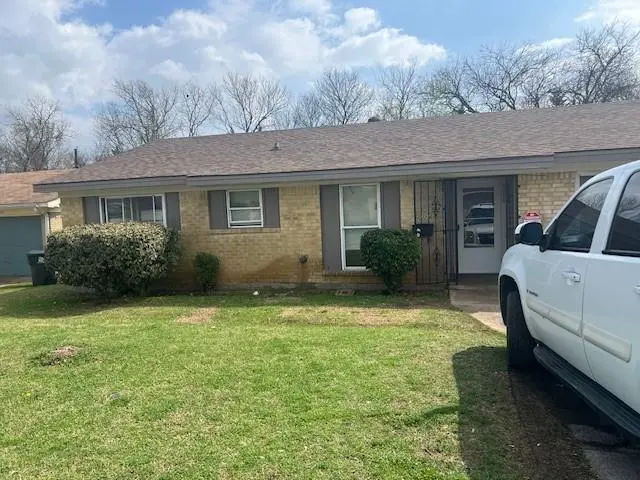
4026 Tioga St · Dallas, TX
Flood risk 1/10 · Minimal
- FEMA flood zone
- X (unshaded)
- Chance of flooding over 30 yrs
- 0.0%
- Est. flood insurance / yr
- $507 – $1,088
Fire risk 3/10 · Minor
- Est. fire insurance / yr
- $1,222 – $2,270
Heat risk 7/10 · Major
- Hot days now (above 110°F)
- 7 days/yr
- Hot days in 30 yrs
- 24 days/yr
Wind risk 6/10 · Moderate
- Chance of severe wind over 30 yrs
- 27.0%
Air-quality risk 2/10 · Minimal
- Unhealthy air days now
- 1 days/yr
- Unhealthy air days in 30 yrs
- 2 days/yr
Risk factors via First Street. Map © Google.
Why this score? — see what drove the C+ grade
The composite is a weighted blend of 9 inputs, each scored 0–100. Each bar is that input's sub-score; the figure is the points it added to the 100-point composite (weight × sub-score).
- Cash flow +20.7/30.0
- ARV discount +15.0/15.0
- 1% rule +7.0/10.0
- DSCR +6.6/10.0
- Livability +4.0/5.0
- Schools +2.8/10.0
- Condition / age +2.5/5.0
- Rent growth +1.8/5.0
- Appreciation +0.0/10.0
$179,580
🖨 Deal sheet (PDF) 📄 Offer letter ✓ Due diligence
Listing remarks MLS
Multiple Offers. Please submit highest and best by 5 pm Monday, May 5, 2026. Price adjustment for this 5 bedroom 2 bth income producing property located in an established neighborhood with recent updates (roof 2025, water heater 2025 etc.). Currently has 8 tenants. Ideal for those wanting extra bedrooms. Owner will assist with some closing cost and or repairs. Buyer and or agent to verify all information contained herein.
Key facts
- 6,316 sq ft lot
- Garage
- Built 1971
Neighborhood map
What this means for you Summary
Snapshot
- This is a 5-bed/1.5-bath single-family listed at $180k.
Deal economics
- At list price, monthly cash flow is $244 ($3k/yr) — positive.
- The deal already cash-flows at list — no discount required.
- Meets the 1% rule at list price ($2k rent vs $180k).
- Recommended offer: $163k (9.0% below list) — sets the bar for market timing.
- Cap rate 7.9% vs local median 2.3% in Dallas — top-decile yield for the area; either an underpriced asset or a hidden risk that comps aren't pricing in. Stress-test before assuming the spread holds.
Location & tenants
- Location reads 81/100 on livability (#24 in TX, #1,380 nationally) — a professional / high-income tenant draw. Strengths: amenities A+, commute A+, housing A+; Watch: crime F.
- Dallas ISD (urban): math 31% / reading 36% proficiency, ranked #559 of 826 in TX (top 68%) — families likely to look elsewhere, expect single-tenant / working-renter base with shorter leases; 83% free/reduced lunch — lower-income household profile, screen leases tightly.
- Zoned schools: J N Ervin El (math 17% / reading 20%, grade F, #3,759 of 4,322 statewide, top 88%, 646 students, 98% FRL); Kennedy-Curry Middle (math 29% / reading 20%, grade F, #1,279 of 1,662 statewide, top 78%, 626 students, 100% FRL); Wilmer-Hutchins H S (math 14% / reading 29%, grade F, #1,377 of 1,632 statewide, top 85%, 1,020 students, 73% FRL).
- Zoned-school proficiency averages 22% at this address vs 34% district-wide (-12 pts) — the specific schools serving this property underperform the Dallas ISD average; the district grade overstates school quality for this exact location.
- Market conditions: Rents soft (-2.8%/yr); 218 active listings in the ZIP; 15 comparable units currently listed for rent nearby; rentals leasing fast (median 9d on market — plan ~1-2 weeks tenant-placement turnaround); 12,577 units permitted in Dallas County in 2024 (6,829 in 5+ unit buildings).
- At $2,155/mo this rent would consume 48% of the median local household income ($54k/yr) (locally 1076% of renters already pay >50% of income on rent) — very limited rent-growth headroom before tenants either downsize or default.
Forward outlook
- Local home prices are declining (-3.0%/yr); year-one equity from $1k of loan paydown is wiped out by about $5k of value loss. Plan a longer hold.
- Dallas County population projected at +35% by 2050 — long-run rental-demand tailwind backs the buy-and-hold thesis.
Negotiation context
- It's been on market 97 days — a 9% lower offer ($163k) is reasonable based on typical stale-listing flexibility.
Risks & watch-outs
- Watch-outs: property tax is 3.0% of price.
- Climate carrying-cost: major wind risk, 27% chance of damaging wind over 30y; extreme-heat days projected 7→24/yr by 2055 (HVAC capex compounding) — expect insurance premiums to compound above CPI over the hold.
Questions for the listing agent
- It's been on market 97 days. Have you received any prior offers? Is the seller open to a 9% concession, seller financing, or rate buy-down credit?
- Built in 1971 — when were the roof, HVAC, electrical panel, plumbing, and water heater last replaced?
- Property tax is high relative to price — has the assessment been appealed recently, and will the sale trigger a re-assessment?
- Why hasn't it sold? Are there any deal-killer items the seller is aware of (foundation, flood, title, zoning, code violations)?
- Is there a deadline driving the sale (1031 exchange, divorce, estate, relocation)? That informs how much negotiation room exists.
- Crime grade is F in this area — have there been break-ins, vandalism, or insurance claims at this property in the last 3 years? What carrier currently insures it and at what premium?
- What's the average days-on-market for RENTAL listings here right now (not sales)? A rising rental-DOM trend means longer vacancies and softer asking-rent achievability than the comps imply.
- What's the recent tenant-quality profile in this submarket — average credit score on applications, eviction rate, late-payment / NSF rate, and stable-employment percentage? A property-management company in the area should have these aggregated.
- How much new for-sale + rental construction is in the pipeline within 1–3 miles? Heavy new supply typically softens prices + rents 12–24 months out; constrained supply supports both.
Investment metrics
- 1% rule
- 1.20% ✓
- Cap rate
- 7.92%
- Cash-on-cash
- 5.82%
- DSCR
- 1.26
- GRM
- 6.9
CMA / ARV
- ARV (median comp)
- $301,633
- List price
- $179,580
- Delta
- -40.46%
- Verdict
- UNDERPRICED
- Comps
- 20 within 1.0 mi
Show comp detail 12 sales within ~0.75 mi
| Address | Dist | Beds/Ba | Sqft | Sold | Price | $/sf | Match |
|---|---|---|---|---|---|---|---|
| 3606 Judge Dupree Dr | 0.48mi | 4/1.5 (-1) | 1,523 (+2%) | 3mo | $179,000 | $118 | 68 |
| 3617 Tioga St | 0.41mi | 4/2.0 (-1) | 1,600 (+7%) | 3mo | $275,000 | $172 | 60 |
| 3727 Pacesetter Dr | 0.45mi | 4/2.5 (-1) | 1,450 (-3%) | 8mo | $259,000 | $179 | 58 |
| 3817 Pinebrook Dr | 0.47mi | 4/2.0 (-1) | 1,380 (-8%) | 2mo | $237,400 | $172 | 56 |
| 4260 Wilshire Blvd | 0.56mi | 5/2.0 | 1,425 (-5%) | 11mo | $255,900 | $180 | 55 |
| 3771 Stagecoach Trl | 0.44mi | 4/2.0 (-1) | 1,336 (-11%) | 2mo | $215,000 | $161 | 53 |
| 3505 Pacesetter Dr | 0.64mi | 4/2.5 (-1) | 1,444 (-4%) | 6mo | $239,999 | $166 | 50 |
| 3760 Soft Wind Dr | 0.44mi | 4/2.0 (-1) | 1,641 (+9%) | 10mo | $275,000 | $168 | 48 |
| 4259 Clark College Dr | 0.60mi | 4/2.0 (-1) | 1,330 (-11%) | 9mo | $249,900 | $188 | 39 |
| 6010 Park Manor Dr | 0.68mi | 4/2.0 (-1) | 1,330 (-11%) | 8mo | $229,000 | $172 | 36 |
| 3520 Softcloud Dr | 0.52mi | 4/2.5 (-1) | 1,300 (-13%) | 10mo | $250,000 | $192 | 36 |
| 6011 Park Manor Dr | 0.69mi | 4/2.0 (-1) | 1,300 (-13%) | 9mo | $229,900 | $177 | 32 |
Match score weights: distance 35% · size 25% · config 20% · recency 20%. Top-matched comps best support the ARV.
Projected returns pro-forma
-3.0% appreciation · 0.0% rent growth · sell at horizon
- IRR
- -11.2%
- Equity multiple
- 0.61×
- Total profit
- $-19,712
- Equity at exit
- $26,776
- IRR
- -7.8%
- Equity multiple
- 0.58×
- Total profit
- $-20,890
- Equity at exit
- $15,527
Cash invested: $50,282 (down + closing). Projections, not guarantees.
Landlord ↔ Tenant lean methodology
- Overall (STATE)
- 87 Strongly Landlord-Friendly
- State Texas
- 87 Strongly Landlord-Friendly · R+5
- County
- — inherits STATE
- City
- — inherits STATE
ZIP-level market 75241
- Home prices YoY
- -16.9%
- Rents YoY
- -2.8%
- Active inventory
- 218
- Price-to-rent
- 6.9×
Monthly cashflow live
- Estimated rent
- $2,155 high interval (Pro) →
- Mortgage (P&I)
- −$942
- Tax from tax record
- −$442 /mo · $5,305/yr
- Insurance
- −$75
- HOA
- −$0
- Vacancy / Maint / Mgmt
- −$453
- Net cashflow
- $244
Break-even live
Sensitivity live
| Price | -10% $346 | -5% $295 | +0% $244 | +5% $193 | +10% $142 |
|---|---|---|---|---|---|
| Rent | -10% $74 | -5% $159 | +0% $244 | +5% $329 | +10% $414 |
| Rate | -1.0pp $334 | -0.5pp $290 | base $244 | +0.5pp $197 | +1.0pp $150 |
UW: 25.0% down · 7.5% · 30yr · 1.5% tax · 5.0% vac · 8.0% maint · 8.0% mgmt
Financing live
Cash to close
- Down payment
- $44,895
- Closing costs
- $5,387
- Reserves months
- —
- Total cash needed
- —
Loan-product check · same deal, 3 products live
Conventional
25% down · 7.5% · 30yr
- Down + closing
- —
- Monthly P&I
- —
- Monthly cashflow
- —
- DSCR
- —
- Eligible?
- —
Personal DTI + credit; lowest rate.
DSCR
20% down · 8.5% · 30yr
- Down + closing
- —
- Monthly P&I
- —
- Monthly cashflow
- —
- DSCR
- —
- Eligible?
- —
No personal income docs; deal must DSCR.
Hard money
10% down · 12.0% · 12mo
- Down + closing
- —
- Monthly P&I
- —
- Monthly cashflow
- —
- DSCR
- —
- Eligible?
- —
Short-term bridge; refi at stabilization.
Rent comps 15 comps
| Address | Beds | Baths | Sqft | Rent | $/sqft | DOM | Units | Dist |
|---|---|---|---|---|---|---|---|---|
| 6445 Baraboo Dr Dallas, TX | 4.0 | 1.5 | 1218 | $1,650 | $1.35 | 45d | 1 | 0.10mi |
| 3522 Tioga St Dallas, TX | 4.0 | 3.0 | 1438 | $2,095 | $1.46 | 5d | 1 | 0.62mi |
| 3522 Tioga St Dallas, TX | 4.0 | 3.0 | 1438 | $2,095 | $1.46 | 0d | 1 | 0.62mi |
| 4281 Lava Forest Dr Dallas, TX | 3.0–5.0 | 2.0–2.5 | 1840 | $2,550 | $1.39 | 0d | 1 | 0.65mi |
| 6436 Moonhill Dr Dallas, TX | 4.0 | 2.0 | 1200 | $1,961 | $1.63 | 3d | 1 | 0.75mi |
| 6520 Warm Moon Ln Dallas, TX | 4.0 | 2.0 | 1237 | $1,995 | $1.61 | 5d | 1 | 0.85mi |
| 5850 Highland Hills Dr Dallas, TX | 2.0–4.0 | 1.0–2.0 | 910 | $1,314 | $1.44 | 0d | 8 | 0.93mi |
| 6152 Balcony Ln Dallas, TX | 4.0 | 2.5 | 1670 | $1,800 | $1.08 | 19d | 1 | 0.93mi |
| 6233 Balcony Ln Dallas, TX | 5.0 | 3.0 | 2080 | $2,695 | $1.30 | 23d | 1 | 0.95mi |
| 6213 Balcony Ln Dallas, TX | 5.0 | 3.0 | 2100 | $2,675 | $1.27 | 25d | 1 | 0.95mi |
| 3806 Castle Hills Dr Dallas, TX | 4.0 | 2.0 | 1422 | $1,900 | $1.34 | 18d | 1 | 0.97mi |
| 2919 N El Centro Way Dallas, TX | 4.0 | 2.0 | 1294 | $1,800 | $1.39 | 9d | 1 | 1.35mi |
| 2842 Pall Mall Ave Dallas, TX | 4.0 | 2.0 | 1584 | $2,095 | $1.32 | 25d | 1 | 1.36mi |
| 2809 Gooch St Dallas, TX | 4.0 | 2.0 | 1816 | $2,650 | $1.46 | 9d | 1 | 1.39mi |
| 2918 Morgan Dr Dallas, TX | 4.0 | 2.0 | 1610 | $2,500 | $1.55 | 25d | 1 | 1.48mi |
Listing history 17 events
-
2026-06-21days on market $179,580 Active 97 DOM
-
2026-06-18days on market $179,580 Active 94 DOM
-
2026-06-17days on market $179,580 Active 93 DOM
-
2026-06-16days on market $179,580 Active 92 DOM
-
2026-06-15days on market $179,580 Active 91 DOM
-
2026-06-13days on market $179,580 Active 89 DOM
-
2026-06-09days on market $179,580 Active 85 DOM
-
2026-06-08days on market $179,580 Active 84 DOM
-
2026-06-07pricestatusdays on market $179,580 Active 83 DOM
-
2026-06-04days on market $199,580 Active Option Contract 80 DOM
-
2026-06-03days on market $199,580 Active Option Contract 79 DOM
-
2026-06-02days on market $199,580 Active Option Contract 78 DOM
-
2026-06-02days on market $199,580 Active Option Contract 77 DOM
-
2026-05-31days on market $199,580 Active Option Contract 76 DOM
-
2026-05-10historical Active Option Contract 432-char remark
Show marketing remark (432 chars)
Multiple Offers. Please submit highest and best by 5 pm Monday, May 5, 2026. Price adjustment for this 5 bedroom 2 bth income producing property located in an established neighborhood with recent updates (roof 2025, water heater 2025 etc.). Currently has 8 tenants. Ideal for those wanting extra bedrooms. Owner will assist with some closing cost and or repairs. Buyer and or agent to verify all information contained herein.
-
2026-04-01price $199,580 432-char remark
Show marketing remark (432 chars)
Multiple Offers. Please submit highest and best by 5 pm Monday, May 5, 2026. Price adjustment for this 5 bedroom 2 bth income producing property located in an established neighborhood with recent updates (roof 2025, water heater 2025 etc.). Currently has 8 tenants. Ideal for those wanting extra bedrooms. Owner will assist with some closing cost and or repairs. Buyer and or agent to verify all information contained herein.
-
2026-03-16$239,580 Active 432-char remark
Show marketing remark (432 chars)
Multiple Offers. Please submit highest and best by 5 pm Monday, May 5, 2026. Price adjustment for this 5 bedroom 2 bth income producing property located in an established neighborhood with recent updates (roof 2025, water heater 2025 etc.). Currently has 8 tenants. Ideal for those wanting extra bedrooms. Owner will assist with some closing cost and or repairs. Buyer and or agent to verify all information contained herein.
ⓘ Source: listings_history table (triggers on properties + properties_extension) + one-shot
backfill from property_details.listing_events for pre-trigger history.
Tax reassessment forecast TX · Resets to sale price
- Current annual tax
- $5,305 · $442/mo
- Projected year-2 tax
- $5,305 · $442/mo
- Expected delta
- $0/yr ($0/mo · 0.0%)
ⓘ Screening estimate from a state-policy table — verify with the county assessor before closing.
Climate risk First Street
- Flood 1/10 Low FEMA zone X (unshaded) · 0% chance over 30 yrs
- Wildfire 3/10 Moderate
- Heat 7/10 Severe 7 d/yr ≥110°F today · 24 d/yr by 30 yrs out
- Wind 6/10 Major 27% chance of damaging wind over 30 yrs
- Air quality 2/10 Low 1 unhealthy d/yr today · 2 by 30 yrs out
Nearby sold comps map
Loading sold comps map…
Walkable amenities ~0.75 mi
Loading nearby amenities…
Taxation est. · year 1
- Rental income
- $25,862
- − Mortgage interest
- −$10,059
- − Property taxes
- −$5,305
- − Insurance
- −$898
- − Repairs & maintenance
- −$2,069
- − Management
- −$2,069
- − Depreciation
- −$5,224
- Taxable income
- $238
- Est. tax owed @ 24.0%
- −$57
- After-tax cash flow
- $2,870/yr
For passive investors: Depreciation is non-cash, so a rental often shows a tax loss while cash-flowing — sheltering income. Rental losses are passive: they offset passive income freely, and up to $25,000/yr can offset ordinary (W-2) income if you actively participate and your MAGI is under $100k (phasing out to $0 by $150k); unused losses carry forward. On sale, claimed depreciation is recaptured at up to 25%, and gains may owe capital-gains tax (a 1031 exchange can defer both). Figures are a year-1 estimate at your 24.0% rate — not tax advice; consult a CPA.
Schools (NCES district)
- District
- Dallas ISD
- NCES district ID
- 4816230
- Math proficiency
- 31% ▼ -16.00%
- Reading proficiency
- 36% ▼ -4.00%
- Median HH income
- $42,881
- Composite
- 28.41/100
- National rank
- #6763
- State rank
- #559 of 826 in TX
Livability — Dallas
- Score
- 81/100
- State rank
- #24
- US rank
- #1380
Category grades
Schools grade is shown separately in the Schools card above.
Census & demographics
- Census place
- Dallas, TX
- County
- Dallas County · 2,612,404 people
- City population
- 1,168,437
- Metro
- Dallas-Fort Worth-Arlington, TX
- Population (ZIP)
- 33,840
- Household income
- $53,998
- Rent vs Own
- Severe rent burden
- 1076.0
Population outlook (Dallas County) Hauer SSP2
- Today (2025)
- 2,979,839 people
- By 2030
- 3,191,823 · +7.1%
- By 2040
- 3,619,611 · +21.5%
- By 2050
- 4,026,915 · +35.1%
- By 2075
- 4,957,073 · +66.4%
- By 2100
- 5,508,725 · +84.9%
Race, ethnicity, and origin ACS 2023
- Neighborhood character
- Majority Black (62%)
- Race & ethnicity
- Black 62% Hispanic / Latino 30% Two or more races 8% White 5% Native American 2%
- Hispanic origin (detail)
- Mexican 24%
- Foreign-born
- 13% · Canada
- Languages at home
- 73% English-only · Spanish 25%
Political lean MEDSL · Dallas
- 2024 margin
- Strong D (+22.2) · D 60.2% · R 38.0% · Other 1.8%
- 2008→2024 swing
- +6.9pp toward D · 2008: 15.3pp · 2024: 22.2pp
- All cycles
- 2024: D+22.2 2020: D+31.6 2016: D+26.2 2012: D+15.4 2008: D+15.3
Not yet ingested
- Civics
- —
Market trends
- HPI YoY
- ▼ -72.36%
- Current HPI
- 356.2348
- Rent YoY
- ▼ -2.75%
- Metro
- Dallas-Fort Worth-Arlington, TX
- State GDP YoY
- ▲ 3.95%
- F500 in state
- 110
Industry mix (Fortune 500 HQ in TX)
| Industry | F500 HQs | Revenue |
|---|---|---|
| Energy | 16 | $1,198B |
|
||
| Technology | 5 | $198B |
|
||
| Engineering / Construction | 4 | $72B |
|
||
| Energy Services | 3 | $60B |
|
||
| Utilities | 3 | $41B |
|
||
| Healthcare | 2 | $330B |
|
||
Price history
-16.7% since first listed3 events — show timeline
- 2026-05-10 Contingent — NTREIS
- 2026-04-01 Price Changed $199,580 NTREIS
- 2026-03-16 Listed $239,580 NTREIS
Property tax history
+9.4%/yrLatest (2025): $5,305 · -0.4% YoY. Source: county tax records.
Cash-flow waterfall
monthlySold comps — $/sqft
last 12 mo · ≤1 miLoading sold comps…