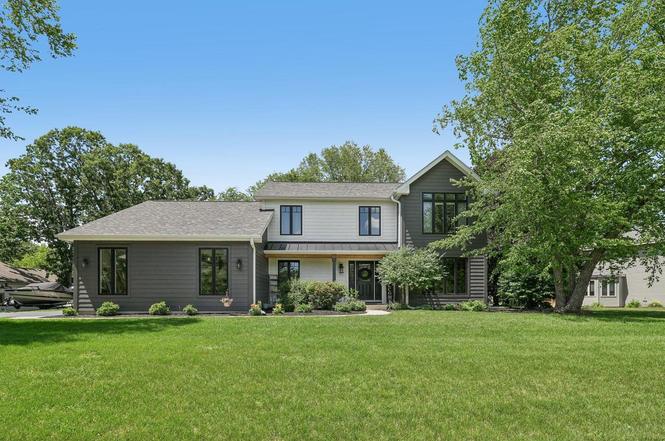
9608 400th Ave · Randall, WI
Flood risk 1/10 · Minimal
- FEMA flood zone
- X (unshaded)
- Chance of flooding over 30 yrs
- 0.0%
- Est. flood insurance / yr
- $473 – $860
Fire risk 1/10 · Minimal
- Est. fire insurance / yr
- $636 – $1,182
Heat risk 2/10 · Minimal
- Hot days now (above 102°F)
- 7 days/yr
- Hot days in 30 yrs
- 13 days/yr
Wind risk 2/10 · Minimal
- Chance of severe wind over 30 yrs
- —
Air-quality risk 2/10 · Minimal
- Unhealthy air days now
- 1 days/yr
- Unhealthy air days in 30 yrs
- 1 days/yr
Risk factors via First Street. Map © Google.
Why this score? — see what drove the D grade
The composite is a weighted blend of 9 inputs, each scored 0–100. Each bar is that input's sub-score; the figure is the points it added to the 100-point composite (weight × sub-score).
- Cash flow +21.8/30.0
- DSCR +7.0/10.0
- 1% rule +5.1/10.0
- Schools +3.6/10.0
- Rent growth +2.5/5.0
- Livability +2.5/5.0
- Condition / age +2.5/5.0
- ARV discount +0.0/15.0
- Appreciation +0.0/10.0
$625,000
🖨 Deal sheet (PDF) 📄 Offer letter ✓ Due diligence
Listing remarks MLS
This beautiful 3 bedroom, 2.5 bath home sits on over a half an acre located near the Nippersink Country Club. Many new updates in the last few years include; Whirlpool Stainless steel appliances, Hardwood floors Exterior paint, mechanicals, roof, radon mediation and much more! Inside features new carpet and paint. Plus the finished basement, 4 Season room, and the heated garage provide even more living space! This home is well maintained and ready for you to move right in. Great Location - in the Randall School district, close to Lake Benedict & Powers Lake
Key facts
- 0.6 acre lot
- 2 garage spots
- Built 1992
Property features AI
Finance
- Other: Zoning: R-5; Subdivision: Nippersink Estates; Lot size approximately 0.6 acres (about 1/2 to 1 acre)
Exterior
- Parking: Attached heated garage with opener; Garage accommodates 2 cars (2.5 total garage parking spaces listed)
- Utilities: Well water; Private septic system
- Home design: Single-family, 2-story home; Estimated 2,501+ square feet
- Construction: Assessor/public record year built; Poured concrete foundation
- Exterior features: Wood exterior; Wooded lot; Garden shed / outbuilding
Interior
- Kitchen: Dishwasher; Oven/Range; Microwave; Refrigerator; Garbage disposal
- Bedrooms: Master bedroom on upper level; Second bedroom on upper level; Third bedroom on upper level
- Flooring: Wood floors; Ceramic tile in bath areas
- Bathrooms: Master bath with walk-in shower; Ceramic tile bath; Tub-only bath; Two full bathrooms and one half bathroom
- Heating & cooling: Forced air heating (natural gas); Central air conditioning
- Interior features: Water softener (seller leased); Cable/satellite available; High-speed internet; Walk-in closets; Wood floors; Finished full basement with poured concrete and sump pump
- Laundry & utility: Washer; Dryer
Neighborhood map
What this means for you Summary
Snapshot
- This is a 3-bed/2.5-bath single-family listed at $625k.
Deal economics
- At list price, monthly cash flow is $973 ($12k/yr) — positive.
- The deal already cash-flows at list — no discount required.
- Meets the 1% rule at list price ($6k rent vs $625k).
Location & tenants
- Location reads: area grade D — affects rentability + tenant quality, not the cash-flow math above.
- Wilmot Uhs School District (rural): math 32% / reading 48% proficiency, ranked #138 of 342 in WI (top 40%) — families likely to look elsewhere, expect single-tenant / working-renter base with shorter leases.
- Zoned schools: Randall Consolidated School (math 39% / reading 36%, grade F, #560 of 1,041 statewide, top 54%, 625 students, 28% FRL); Wilmot High (math 32% / reading 48%, grade F, #92 of 483 statewide, top 19%, 949 students, 0% FRL).
- Market conditions: 41 active listings in the ZIP; 1 comparable units currently listed for rent nearby; 259 units permitted in Kenosha County in 2024 (8 in 5+ unit buildings).
Forward outlook
- Local home prices are declining (-3.0%/yr); year-one equity from $4k of loan paydown is wiped out by about $19k of value loss. Plan a longer hold.
Negotiation context
- Only 8 days on market — expect competitive offers; lowballing is unlikely to land.
- 7 sale attempts since 13y ago with the ask held roughly flat each time — persistent listings suggest the price (not the market) is what's stuck; bring a comps-based counter.
- Current owner paid $289k; list at $625k implies a 116% gain — meaningful room to come down on a strong offer.
Questions for the listing agent
- Is there a deadline driving the sale (1031 exchange, divorce, estate, relocation)? That informs how much negotiation room exists.
- The area grade is low — what's the realistic commute time and amenity access for the typical tenant pool here? Any planned neighborhood developments (good or bad) we should know about?
- What's the average days-on-market for RENTAL listings here right now (not sales)? A rising rental-DOM trend means longer vacancies and softer asking-rent achievability than the comps imply.
- What's the recent tenant-quality profile in this submarket — average credit score on applications, eviction rate, late-payment / NSF rate, and stable-employment percentage? A property-management company in the area should have these aggregated.
- How much new for-sale + rental construction is in the pipeline within 1–3 miles? Heavy new supply typically softens prices + rents 12–24 months out; constrained supply supports both.
Investment metrics
- 1% rule
- 1.01% ✓
- Cap rate
- 8.16%
- Cash-on-cash
- 6.67%
- DSCR
- 1.30
- GRM
- 8.3
CMA / ARV
- ARV (on-the-fly)
- $515,780
- Comps found
- 5
Show comp detail 5 sales within ~0.75 mi
| Address | Dist | Beds/Ba | Sqft | Sold | Price | $/sf | Match |
|---|---|---|---|---|---|---|---|
| 9435 402nd Ave | 0.21mi | 3/2.0 | 2,715 (-3%) | 10mo | $575,000 | $212 | 75 |
| 39910 97th St | 0.11mi | 4/3.0 (+1) | 2,705 (-3%) | 14mo | $210,000 | $78 | 71 |
| 9499 402nd Ave | 0.15mi | 4/2.0 (+1) | 2,508 (-10%) | 2mo | $425,000 | $169 | 68 |
| 9111 400th Ct | 0.57mi | 3/2.0 | 2,684 (-4%) | 10mo | $735,000 | $274 | 57 |
| 9612 401st Ave | 0.09mi | 3/3.0 | 2,430 (-13%) | 20mo | $450,000 | $185 | 56 |
Match score weights: distance 35% · size 25% · config 20% · recency 20%. Top-matched comps best support the ARV.
Projected returns pro-forma
-3.0% appreciation · 3.0% rent growth · sell at horizon
- IRR
- -6.1%
- Equity multiple
- 0.77×
- Total profit
- $-39,383
- Equity at exit
- $93,190
- IRR
- 3.6%
- Equity multiple
- 1.26×
- Total profit
- $45,139
- Equity at exit
- $54,039
Cash invested: $175,000 (down + closing). Projections, not guarantees.
Landlord ↔ Tenant lean methodology
- Overall (STATE)
- 73 Landlord-Friendly
- State Wisconsin
- 73 Landlord-Friendly · R+2
- County
- — inherits STATE
- City
- — inherits STATE
ZIP-level market 53128
- Home prices YoY
- -6.8%
- Active inventory
- 41
- Price-to-rent
- 8.3×
Monthly cashflow live
- Estimated rent
- $6,307 medium interval (Pro) →
- Mortgage (P&I)
- −$3,278
- Tax from tax record
- −$471 /mo · $5,655/yr
- Insurance
- −$260
- HOA
- −$0
- Vacancy / Maint / Mgmt
- −$1,324
- Net cashflow
- $973
Break-even live
Sensitivity live
| Price | -10% $1,327 | -5% $1,150 | +0% $973 | +5% $796 | +10% $619 |
|---|---|---|---|---|---|
| Rent | -10% $475 | -5% $724 | +0% $973 | +5% $1,222 | +10% $1,472 |
| Rate | -1.0pp $1,288 | -0.5pp $1,132 | base $973 | +0.5pp $811 | +1.0pp $647 |
UW: 25.0% down · 7.5% · 30yr · 1.5% tax · 5.0% vac · 8.0% maint · 8.0% mgmt
Financing live
Cash to close
- Down payment
- $156,250
- Closing costs
- $18,750
- Reserves months
- —
- Total cash needed
- —
Loan-product check · same deal, 3 products live
Conventional
25% down · 7.5% · 30yr
- Down + closing
- —
- Monthly P&I
- —
- Monthly cashflow
- —
- DSCR
- —
- Eligible?
- —
Personal DTI + credit; lowest rate.
DSCR
20% down · 8.5% · 30yr
- Down + closing
- —
- Monthly P&I
- —
- Monthly cashflow
- —
- DSCR
- —
- Eligible?
- —
No personal income docs; deal must DSCR.
Hard money
10% down · 12.0% · 12mo
- Down + closing
- —
- Monthly P&I
- —
- Monthly cashflow
- —
- DSCR
- —
- Eligible?
- —
Short-term bridge; refi at stabilization.
Rent comps 1 comps
| Address | Beds | Baths | Sqft | Rent | $/sqft | DOM | Units | Dist |
|---|---|---|---|---|---|---|---|---|
| 40608 102nd Pl Unit 1374783P Genoa City, WI | 3.0 | 2.0 | 1991 | $6,307 | $3.17 | 14d | 1 | 0.59mi |
Listing history 8 events
-
2026-06-21days on market $625,000 Contingent 8 DOM
-
2026-06-21statusdays on market $625,000 Contingent 7 DOM
-
2026-06-18days on market $625,000 Active 5 DOM
-
2026-06-17days on market $625,000 Active 4 DOM
-
2026-06-16days on market $625,000 Active 3 DOM
-
2026-06-15days on market $625,000 Active 2 DOM
-
2026-06-15remarks 699-char remark
-
2026-06-15$625,000 Active 1 DOM
ⓘ Source: listings_history table (triggers on properties + properties_extension) + one-shot
backfill from property_details.listing_events for pre-trigger history.
Tax reassessment forecast WI · Partial reset (capped growth)
- Current annual tax
- $5,655 · $471/mo
- Projected year-2 tax
- $8,609 · $717/mo
- Expected delta
- +$2,954/yr (+$246/mo · 52.2%)
ⓘ Screening estimate from a state-policy table — verify with the county assessor before closing.
Climate risk First Street
- Flood 1/10 Low FEMA zone X (unshaded) · 0% chance over 30 yrs
- Wildfire 1/10 Low
- Heat 2/10 Low 7 d/yr ≥102°F today · 13 d/yr by 30 yrs out
- Wind 2/10 Low
- Air quality 2/10 Low 1 unhealthy d/yr today · 1 by 30 yrs out
Nearby sold comps map
Loading sold comps map…
Walkable amenities ~0.75 mi
Loading nearby amenities…
Taxation est. · year 1
- Rental income
- $75,684
- − Mortgage interest
- −$35,010
- − Property taxes
- −$5,655
- − Insurance
- −$3,125
- − Repairs & maintenance
- −$6,055
- − Management
- −$6,055
- − Depreciation
- −$18,182
- Taxable income
- $1,603
- Est. tax owed @ 24.0%
- −$385
- After-tax cash flow
- $11,295/yr
For passive investors: Depreciation is non-cash, so a rental often shows a tax loss while cash-flowing — sheltering income. Rental losses are passive: they offset passive income freely, and up to $25,000/yr can offset ordinary (W-2) income if you actively participate and your MAGI is under $100k (phasing out to $0 by $150k); unused losses carry forward. On sale, claimed depreciation is recaptured at up to 25%, and gains may owe capital-gains tax (a 1031 exchange can defer both). Figures are a year-1 estimate at your 24.0% rate — not tax advice; consult a CPA.
Schools (NCES district)
- District
- Wilmot Uhs School District
- NCES district ID
- 5516770
- Math proficiency
- 32% ▲ 2.00%
- Reading proficiency
- 48% ▲ 6.00%
- Median HH income
- $62,783
- Composite
- 35.65/100
- National rank
- #4881
- State rank
- #138 of 342 in WI
Livability — Randall
No livability data for this city. (Only ~50 U.S. cities are tracked.)
Census & demographics
- Census place
- Powers Lake, WI
- Population (ZIP)
- 8,985
Population outlook (Kenosha County) Hauer SSP2
- Today (2025)
- 174,032 people
- By 2030
- 174,923 · +0.5%
- By 2040
- 173,895 · -0.1%
- By 2050
- 170,102 · -2.3%
- By 2075
- 162,952 · -6.4%
- By 2100
- 154,781 · -11.1%
Race, ethnicity, and origin ACS 2023
- Neighborhood character
- Predominantly White (83%)
- Race & ethnicity
- White 83% Hispanic / Latino 14% Two or more races 7%
- Hispanic origin (detail)
- Mexican 12% Cuban 2%
- Common ancestry
- Romanian 9% Slovak 2% Iranian 2%
- Foreign-born
- 6% · Canada
- Languages at home
- 88% English-only · Spanish 10% Russian/Polish/Slavic 2%
Political lean MEDSL · Kenosha
- 2024 margin
- Lean R (+6.2) · D 46.2% · R 52.5% · Other 1.3%
- 2008→2024 swing
- -24.3pp toward R · 2008: 18.1pp · 2024: -6.2pp
- All cycles
- 2024: R+6.2 2020: R+3.1 2016: R+0.3 2012: D+12.3 2008: D+18.1
Not yet ingested
- Civics
- —
Market trends
- HPI YoY
- ▼ -22.26%
- Current HPI
- 307.4105
- Rent YoY
- —
- Metro
- —
- State GDP YoY
- ▲ 2.10%
- F500 in state
- 20
Industry mix (Fortune 500 HQ in WI)
| Industry | F500 HQs | Revenue |
|---|---|---|
| Industrial Machinery | 4 | $23B |
|
||
| Industrial Technology | 2 | $36B |
|
||
| Insurance | 1 | $36B |
|
||
| Professional Services | 1 | $19B |
|
||
| Utilities | 1 | $9B |
|
||
| Consumer Goods | 1 | $3B |
|
||
Price history
+222.2% since first listed22 events — show timeline
- 2026-06-13 Listed $625,000 METROMLS
- 2019-03-27 Sold (Public Records) $289,000 Public Records
- 2019-03-15 Sold (MLS) $299,000 METROMLS
- 2019-01-13 Contingent — METROMLS
- 2019-01-01 Listed $299,000 METROMLS
- 2018-12-19 Listing Removed — METROMLS
- 2018-12-19 Listing Removed — MRED as Distributed by MLS Grid
- 2018-10-28 Price Changed — MRED as Distributed by MLS Grid
- 2018-10-18 Price Changed $299,900 METROMLS
- 2018-09-27 Listed — MRED as Distributed by MLS Grid
- 2018-09-25 Listed $314,900 METROMLS
- 2018-09-24 Listing Removed — METROMLS
- 2018-09-23 Listing Removed — MRED as Distributed by MLS Grid
- 2018-08-09 Price Changed — MRED as Distributed by MLS Grid
- 2018-08-08 Price Changed $314,900 METROMLS
- 2018-06-07 Listed $324,900 METROMLS
- 2018-06-07 Listed — MRED as Distributed by MLS Grid
- 2013-12-18 Listing Removed — METROMLS
- 2013-12-18 Listed $269,900 METROMLS
- 2013-12-13 Sold (Public Records) $267,000 Public Records
- 2013-12-13 Sold (MLS) $267,000 METROMLS
- 2001-08-02 Sold (Public Records) $194,000 Public Records
Property tax history
+1.9%/yrLatest (2025): $5,655 · +9.9% YoY. Source: county tax records.
Cash-flow waterfall
monthlySold comps — $/sqft
last 12 mo · ≤1 miLoading sold comps…