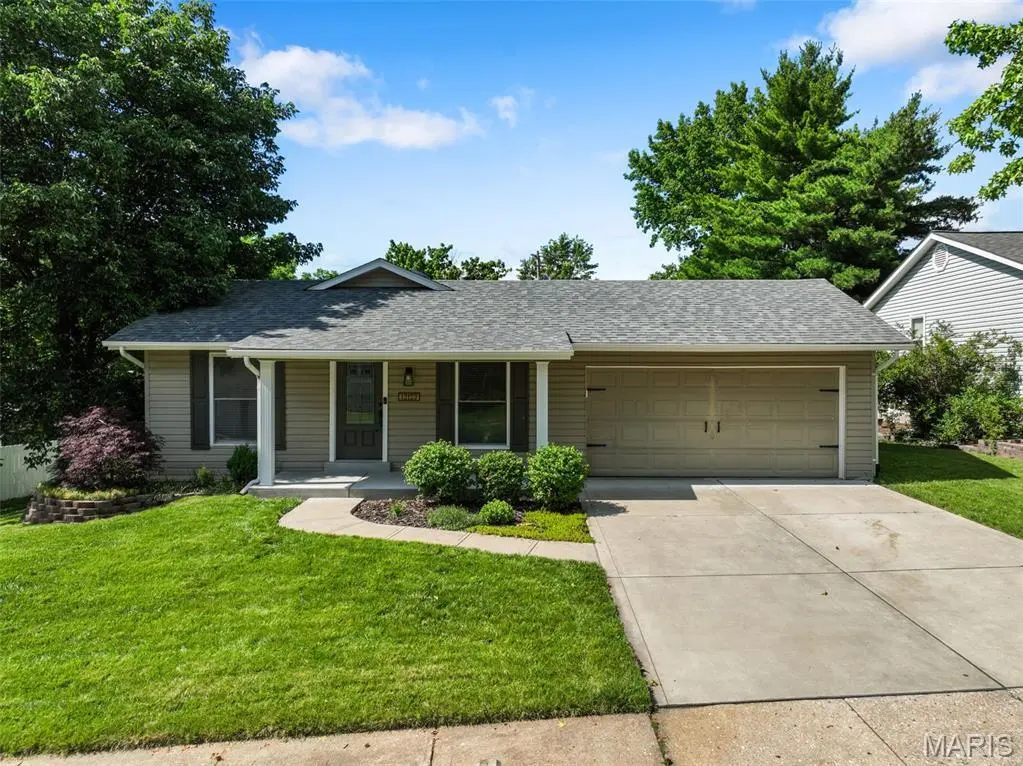
12123 Prestonpark Ln · Maryland Heights, MO
Flood risk 1/10 · Minimal
- FEMA flood zone
- X (unshaded)
- Chance of flooding over 30 yrs
- 0.0%
- Est. flood insurance / yr
- $473 – $860
Fire risk 1/10 · Minimal
- Est. fire insurance / yr
- $1,054 – $1,958
Heat risk 5/10 · Moderate
- Hot days now (above 106°F)
- 7 days/yr
- Hot days in 30 yrs
- 21 days/yr
Wind risk 2/10 · Minimal
- Chance of severe wind over 30 yrs
- 1.0%
Air-quality risk 2/10 · Minimal
- Unhealthy air days now
- 1 days/yr
- Unhealthy air days in 30 yrs
- 3 days/yr
Risk factors via First Street. Map © Google.
Why this score? — see what drove the D- grade
The composite is a weighted blend of 9 inputs, each scored 0–100. Each bar is that input's sub-score; the figure is the points it added to the 100-point composite (weight × sub-score).
- Appreciation +10.0/10.0
- Cash flow +8.2/30.0
- Schools +5.1/10.0
- ARV discount +3.9/15.0
- Livability +3.6/5.0
- Condition / age +2.5/5.0
- DSCR +2.2/10.0
- 1% rule +2.1/10.0
- Rent growth +1.8/5.0
$325,000
🖨 Deal sheet (PDF) 📄 Offer letter ✓ Due diligence
Listing remarks MLS
Welcome to 12123 Prestonpark Ln, this beautiful 3 bedroom, 2 full & 1 half bathroom ranch is move-in ready! Hardwood flooring in the living room which flows into the updated kitchen with ample custom cabinetry, spacious granite counter tops, with all appliances included; skylight in breakfast room really brightens up the space! Stunning master bedroom suite with double sinks, whirlpool tub, separate shower with huge walk-in closet! Main level also boasts 2 other good sized bedrooms with updated full bathroom. The finished lower level offers a large family room, bonus room, full bath and storage in the unfinished area. Just off the breakfast room is a lovely deck which leads to large partially fenced in backyard with shed for storage. Updated double-hung vinyl tilt-in windows, updated light fixtures and modern paint tones throughout. New roof 2019. Parkway North Schools and close to shopping and highways! Don't dream a dream, buy one; schedule your showing today!
Key facts
- 0.26 acre lot
- 2 garage spots
- Built 1975
Property features AI
Finance
- Other: Basement: full, partially finished, 9+ ft pour, includes bathroom and sleeping area; Room count: 7 rooms (8 listed in some sources); Below-grade finished area reported by owner
- HOA & community: Meadow Parkway HOA with an annual fee of $200 covering common area maintenance; Association amenities: None listed
Exterior
- Parking: 2-car attached garage (total 2 parking spaces)
- Utilities: Public water; Public sewer; Ameren electric; Cable available; Electricity available; Natural gas available; Water available; Sewer available
- Home design: Single family residence; Private ownership; One level; Living area reported from public records
- Construction: Vinyl siding
- Exterior features: Deck; Front porch; Patio; Fenced front and back yard; Back yard
Interior
- Kitchen: Stainless steel appliances; Electric cooktop; Wall oven and oven; Microwave; Dishwasher; Kitchen and dining combined layout
- Bedrooms: 3 bedrooms on the main level
- Flooring: Carpet; Hardwood
- Bathrooms: 2 full bathrooms; 1 half bathroom
- Heating & cooling: Forced air heating (natural gas); Central air conditioning (electric)
- Interior features: Ceiling fans; Double vanity; Kitchen/dining room combo; Walk-in closets; Insulated windows; Stainless steel appliances; Electric cooktop; Dishwasher; Microwave; Wall oven / Oven; Carpet flooring; Hardwood flooring; Has fireplace in basement
- Laundry & utility: Laundry in basement
Neighborhood map
What this means for you Summary
Snapshot
- This is a 3-bed/2.5-bath single-family listed at $325k.
Deal economics
- At list price, monthly cash flow is $-307 ($-4k/yr) — negative.
- To cash-flow at today's rent, offer at most $271k (16.7% below list).
- To meet the 1% rule (rent ≥ 1% of price), the offer needs to be $230k (29.1% below list).
- Recommended offer: $230k (29.1% below list) — sets the bar for 1% rule.
- Cap rate 5.2% vs local median 4.2% in Maryland Heights — meaningfully above typical; check what's discounted (condition, days-on-market, listing class) to confirm the premium yield is real.
Location & tenants
- Location reads 71/100 on livability (#101 in MO) — a middle-class / working-renter tenant base. Strengths: cost of living A+, housing A+, crime A-; Watch: health & safety C-, amenities F, commute F.
- Parkway C-2 (suburban): math 49% / reading 62% proficiency, ranked #18 of 324 in MO (top 6%) — acceptable for families but not a draw, mixed tenant base, ~2y average lease; only 14% free/reduced lunch — higher-income household profile.
- Zoned schools: Craig Elem. (math 42% / reading 57%, grade D, #284 of 1,115 statewide, top 30%, 389 students, 17% FRL); Northeast Middle (math 33% / reading 47%, grade F, #185 of 391 statewide, top 48%, 703 students, 24% FRL); North High (math 35% / reading 70%, grade C-, #89 of 521 statewide, top 17%, 1,074 students, 34% FRL).
- Market conditions: Rents soft (-3.0%/yr); 173 active listings in the ZIP; 17 comparable units currently listed for rent nearby; rentals leasing fast (median 1d on market — plan ~1-2 weeks tenant-placement turnaround); solid renter incomes; 920 units permitted in St. Louis County in 2024 (250 in 5+ unit buildings).
- This rent runs 33% of the median local income ($85k/yr) — at the standard rent-burdened threshold; future hikes will face affordability resistance.
Forward outlook
- In year one you build about $35k of equity ($2k loan paydown + $32k appreciation (10.0% local appreciation)).
- By year 2, paydown + projected appreciation supports a ~$56k cash-out refi (75% LTV) — recoverable capital for the next deal without selling this one.
Negotiation context
- Only 5 days on market — expect competitive offers; lowballing is unlikely to land.
- 3 sale attempts since 11y ago; this cycle's ask is 38% above the opening price — seller raised mid-cycle; expect resistance to lowballs.
- Current owner paid $233k; 39% above their basis — modest negotiation headroom, anchor on the comps not their cost.
Risks & watch-outs
- Climate carrying-cost: extreme-heat days projected 7→21/yr by 2055 (HVAC capex compounding) — expect insurance premiums to compound above CPI over the hold.
Questions for the listing agent
- What do current leases actually rent for vs. the listed asking? Can we see a recent rent roll and the last 12 months of T-12 income?
- Built in 1975 — when were the roof, HVAC, electrical panel, plumbing, and water heater last replaced?
- What does the HOA fee cover, when was the last increase, and are there any pending special assessments or reserve-fund shortfalls?
- Is there a deadline driving the sale (1031 exchange, divorce, estate, relocation)? That informs how much negotiation room exists.
- Schools are B-rated — typically a magnet for longer-tenancy family renters. What's the average tenant stay here, and is there a school-zone premium baked into asking?
- The area grade is low — what's the realistic commute time and amenity access for the typical tenant pool here? Any planned neighborhood developments (good or bad) we should know about?
- What's the average days-on-market for RENTAL listings here right now (not sales)? A rising rental-DOM trend means longer vacancies and softer asking-rent achievability than the comps imply.
- What's the recent tenant-quality profile in this submarket — average credit score on applications, eviction rate, late-payment / NSF rate, and stable-employment percentage? A property-management company in the area should have these aggregated.
- How much new for-sale + rental construction is in the pipeline within 1–3 miles? Heavy new supply typically softens prices + rents 12–24 months out; constrained supply supports both.
Investment metrics
- 1% rule
- 0.71% ✗
- Cap rate
- 5.16%
- Cash-on-cash
- -4.05%
- DSCR
- 0.82
- GRM
- 11.8
CMA / ARV
- ARV (on-the-fly)
- $300,664
- Comps found
- 12
Show comp detail 12 sales within ~0.75 mi
| Address | Dist | Beds/Ba | Sqft | Sold | Price | $/sf | Match |
|---|---|---|---|---|---|---|---|
| 1639 Prestonpark Ln | 0.15mi | 3/2.5 | 1,395 (+10%) | 3mo | $330,000 | $237 | 74 |
| 1517 Gold Leaf Dr | 0.41mi | 3/2.0 | 1,260 (-1%) | 13mo | $299,900 | $238 | 66 |
| 12167 Plainsman Dr | 0.29mi | 3/2.0 | 1,396 (+10%) | 7mo | $325,000 | $233 | 63 |
| 11827 Gold Leaf Dr | 0.48mi | 3/2.0 | 1,332 (+5%) | 16mo | $315,000 | $236 | 54 |
| 11816 Spruce Haven Dr | 0.57mi | 3/2.0 | 1,290 (+1%) | 18mo | $319,900 | $248 | 54 |
| 11981 Villa Dorado Dr | 0.31mi | 3/2.5 | 1,368 (+7%) | 23mo | $190,000 | $139 | 54 |
| 1642 Ross Ave | 0.52mi | 3/2.0 | 1,336 (+5%) | 18mo | $189,000 | $141 | 51 |
| 11773 Chandellay Dr | 0.51mi | 3/2.5 | 1,416 (+11%) | 8mo | $349,000 | $246 | 51 |
| 12420 Larkwood Dr | 0.67mi | 3/2.5 | 1,240 (-3%) | 22mo | $300,000 | $242 | 46 |
| 1348 Jeanne Hills Dr | 0.69mi | 2/1.5 (-1) | 1,238 (-3%) | 17mo | $270,000 | $218 | 40 |
| 12219 Belwyn Dr | 0.58mi | 3/2.0 | 1,441 (+13%) | 14mo | $329,900 | $229 | 37 |
| 1416 Jaywood Dr | 0.62mi | 3/2.0 | 1,426 (+12%) | 24mo | $290,000 | $203 | 30 |
Match score weights: distance 35% · size 25% · config 20% · recency 20%. Top-matched comps best support the ARV.
Projected returns pro-forma
10.0% appreciation · 0.0% rent growth · sell at horizon
- IRR
- 20.6%
- Equity multiple
- 2.66×
- Total profit
- $150,644
- Equity at exit
- $292,786
- IRR
- 18.2%
- Equity multiple
- 5.91×
- Total profit
- $446,842
- Equity at exit
- $631,404
Cash invested: $91,000 (down + closing). Projections, not guarantees.
Landlord ↔ Tenant lean methodology
- Overall (STATE)
- 81 Strongly Landlord-Friendly
- State Missouri
- 81 Strongly Landlord-Friendly · R+10
- County
- — inherits STATE
- City
- — inherits STATE
ZIP-level market 63146
- Home prices YoY
- 4.9%
- Rents YoY
- -3.0%
- Active inventory
- 173
- Price-to-rent
- 11.8×
Monthly cashflow live
- Estimated rent
- $2,304 high interval (Pro) →
- Mortgage (P&I)
- −$1,704
- Tax from tax record
- −$271 /mo · $3,251/yr
- Insurance
- −$135
- HOA
- −$17
- Vacancy / Maint / Mgmt
- −$484
- Net cashflow
- $-307
Break-even live
Sensitivity live
| Price | -10% $-123 | -5% $-215 | +0% $-307 | +5% $-399 | +10% $-491 |
|---|---|---|---|---|---|
| Rent | -10% $-489 | -5% $-398 | +0% $-307 | +5% $-216 | +10% $-125 |
| Rate | -1.0pp $-144 | -0.5pp $-225 | base $-307 | +0.5pp $-391 | +1.0pp $-477 |
UW: 25.0% down · 7.5% · 30yr · 1.5% tax · 5.0% vac · 8.0% maint · 8.0% mgmt
Financing live
Cash to close
- Down payment
- $81,250
- Closing costs
- $9,750
- Reserves months
- —
- Total cash needed
- —
Loan-product check · same deal, 3 products live
Conventional
25% down · 7.5% · 30yr
- Down + closing
- —
- Monthly P&I
- —
- Monthly cashflow
- —
- DSCR
- —
- Eligible?
- —
Personal DTI + credit; lowest rate.
DSCR
20% down · 8.5% · 30yr
- Down + closing
- —
- Monthly P&I
- —
- Monthly cashflow
- —
- DSCR
- —
- Eligible?
- —
No personal income docs; deal must DSCR.
Hard money
10% down · 12.0% · 12mo
- Down + closing
- —
- Monthly P&I
- —
- Monthly cashflow
- —
- DSCR
- —
- Eligible?
- —
Short-term bridge; refi at stabilization.
Rent comps 17 comps
| Address | Beds | Baths | Sqft | Rent | $/sqft | DOM | Units | Dist |
|---|---|---|---|---|---|---|---|---|
| 1638 Prestonpark Ln Saint Louis, MO | 3.0 | 2.5 | 1734 | $2,610 | $1.51 | 45d | 1 | 0.11mi |
| 11864 Featherwood Dr Saint Louis, MO | 3.0 | 3.0 | 1460 | $2,600 | $1.78 | 0d | 1 | 0.45mi |
| 12401 Boulder Springs Pkwy St. Louis, MO | 1.0–3.0 | 1.0–2.0 | 1006 | $2,867 | $2.85 | 0d | 10 | 0.47mi |
| 1895 Boulder Springs Dr St. Louis, MO | 1.0–3.0 | 1.0–2.5 | 1083 | $3,091 | $2.85 | 0d | 6 | 0.53mi |
| 12465 Larkwood Dr Saint Louis, MO | 3.0 | 2.0 | 1563 | $2,131 | $1.36 | 0d | 1 | 0.69mi |
| 11752 Russet Meadow Dr Saint Louis, MO | 3.0 | 2.5 | 1578 | $2,000 | $1.27 | 6d | 1 | 0.78mi |
| 1145 Mackinac Dr Saint Louis, MO | 4.0 | 2.5 | 1588 | $2,490 | $1.57 | 0d | 1 | 0.78mi |
| 1951 Oberlin Dr St. Louis, MO | 1.0–3.0 | 1.0–2.5 | 993 | $2,128 | $2.14 | 0d | 24 | 0.96mi |
| 12545 Markaire Dr St. Louis, MO | 1.0–3.0 | 1.0–4.0 | 1420 | $2,695 | $1.90 | 12d | 5 | 1.09mi |
| 1007 E Rue De La Banque Creve Coeur, MO | 1.0–2.0 | 1.0 | 800 | $1,425 | $1.78 | 0d | 4 | 1.10mi |
| 2207 Summerhouse Dr St. Louis, MO | 1.0–3.0 | 1.0–2.0 | 804 | $1,573 | $1.96 | 0d | 20 | 1.12mi |
| 1432 Glenmeade Dr Maryland Heights, MO | 3.0 | 2.0 | 1090 | $2,176 | $2.00 | 12d | 1 | 1.15mi |
| 11164 De Malle Dr Saint Louis, MO | 3.0 | 2.5 | 1146 | $2,475 | $2.16 | 13d | 1 | 1.21mi |
| 1308 Palm Ridge Ct Saint Louis, MO | 3.0 | 2.0 | 1652 | $2,400 | $1.45 | 0d | 1 | 1.23mi |
| 12806 Willowyck Dr Saint Louis, MO | 3.0 | 2.0 | 1456 | $2,500 | $1.72 | 45d | 1 | 1.25mi |
| 2037 Chablis Dr Saint Louis, MO | 1.0–2.0 | 1.0–1.5 | 780 | $1,588 | $2.04 | 0d | 67 | 1.25mi |
| 807 Cross Creek Dr Creve Coeur, MO | 3.0 | 1.0–2.5 | 1066 | $1,989 | $1.86 | 0d | 35 | 1.36mi |
HOA detail
- Monthly dues
- $17 · $204/yr
- Likely covers
- pool
Listing history 6 events
-
2026-06-16status $325,000 Pending 5 DOM
-
2026-06-15days on market $325,000 Active 5 DOM
-
2026-06-13days on market $325,000 Active 3 DOM
-
2026-06-13statusdays on market $325,000 Active 2 DOM
-
2026-06-08remarks 699-char remark
-
2026-06-08$325,000 Coming Soon 1 DOM
ⓘ Source: listings_history table (triggers on properties + properties_extension) + one-shot
backfill from property_details.listing_events for pre-trigger history.
Tax reassessment forecast MO · Resets to sale price
- Current annual tax
- $3,251 · $271/mo
- Projected year-2 tax
- $3,251 · $271/mo
- Expected delta
- $0/yr ($0/mo · 0.0%)
ⓘ Screening estimate from a state-policy table — verify with the county assessor before closing.
Climate risk First Street
- Flood 1/10 Low FEMA zone X (unshaded) · 0% chance over 30 yrs
- Wildfire 1/10 Low
- Heat 5/10 Major 7 d/yr ≥106°F today · 21 d/yr by 30 yrs out
- Wind 2/10 Low 100% chance of damaging wind over 30 yrs
- Air quality 2/10 Low 1 unhealthy d/yr today · 3 by 30 yrs out
Nearby sold comps map
Loading sold comps map…
Walkable amenities ~0.75 mi
Loading nearby amenities…
Taxation est. · year 1
- Rental income
- $27,652
- − Mortgage interest
- −$18,205
- − Property taxes
- −$3,251
- − Insurance
- −$1,625
- − Repairs & maintenance
- −$2,212
- − Management
- −$2,212
- − HOA
- −$204
- − Depreciation
- −$9,455
- Taxable loss
- −$9,512
- Est. tax savings @ 24.0%
- +$2,283
- After-tax cash flow
- $-1,404/yr
For passive investors: Depreciation is non-cash, so a rental often shows a tax loss while cash-flowing — sheltering income. Rental losses are passive: they offset passive income freely, and up to $25,000/yr can offset ordinary (W-2) income if you actively participate and your MAGI is under $100k (phasing out to $0 by $150k); unused losses carry forward. On sale, claimed depreciation is recaptured at up to 25%, and gains may owe capital-gains tax (a 1031 exchange can defer both). Figures are a year-1 estimate at your 24.0% rate — not tax advice; consult a CPA.
Schools (NCES district)
- District
- Parkway C-2
- NCES district ID
- 2923580
- Math proficiency
- 49% ▼ -11.00%
- Reading proficiency
- 62% ▼ -2.00%
- Median HH income
- $83,551
- Composite
- 50.5/100
- National rank
- #1851
- State rank
- #18 of 324 in MO
Livability — Maryland Heights
- Score
- 71/100
- State rank
- #101
- US rank
- #6808
Category grades
Schools grade is shown separately in the Schools card above.
Census & demographics
- County
- Saint Louis County · 888,823 people
- City population
- 21,924
- Metro
- St. Louis, MO-IL
- Population (ZIP)
- 30,678
- Household income
- $84,756
- Rent vs Own
- Severe rent burden
- 1156.0
Population outlook (St. Louis County) Hauer SSP2
- Today (2025)
- 1,025,227 people
- By 2030
- 1,028,023 · +0.3%
- By 2040
- 1,020,940 · -0.4%
- By 2050
- 1,007,280 · -1.8%
- By 2075
- 987,277 · -3.7%
- By 2100
- 921,984 · -10.1%
Race, ethnicity, and origin ACS 2023
- Neighborhood character
- Diverse neighborhood (Simpson 0.56)
- Race & ethnicity
- White 63% Asian 17% Black 13% Two or more races 4% Hispanic / Latino 3%
- Common ancestry
- Scotch-Irish 3% Romanian 3% Italian 2%
- Foreign-born
- 19% · China, South Korea, Canada
- Languages at home
- 79% English-only · Other Asian/Pacific 7% Other Indo-European 4% Chinese 3%
Political lean MEDSL · St. Louis
- 2024 margin
- Strong D (+23.4) · D 60.8% · R 37.4% · Other 1.7%
- 2008→2024 swing
- +3.5pp toward D · 2008: 19.9pp · 2024: 23.4pp
- All cycles
- 2024: D+23.4 2020: D+24.0 2016: D+16.2 2012: D+13.7 2008: D+19.9
Not yet ingested
- Civics
- —
Market trends
- HPI YoY
- ▲ 33.10%
- Current HPI
- 711.49
- Rent YoY
- ▼ -2.96%
- Metro
- St. Louis, MO-IL
- State GDP YoY
- ▲ 1.84%
- F500 in state
- 20
Industry mix (Fortune 500 HQ in MO)
| Industry | F500 HQs | Revenue |
|---|---|---|
| Healthcare | 1 | $163B |
|
||
| Insurance | 1 | $21B |
|
||
| Industrial Technology | 1 | $17B |
|
||
| Retail | 1 | $16B |
|
||
| Industrial Distribution | 1 | $10B |
|
||
| Utilities | 1 | $9B |
|
||
Price history
+284.6% since first listed20 events — show timeline
- 2026-06-08 Coming Soon $325,000 MARIS as Distributed by MLS Grid
- 2020-03-25 Sold (Public Records) $233,000 Public Records
- 2020-03-16 Sold (MLS) — MARIS as Distributed by MLS Grid
- 2020-03-03 Pending — MARIS as Distributed by MLS Grid
- 2020-02-01 Contingent — MARIS as Distributed by MLS Grid
- 2020-01-30 Listed $235,000 MARIS as Distributed by MLS Grid
- 2019-09-12 Sold (Public Records) $215,000 Public Records
- 2019-09-09 Sold (MLS) — MARIS as Distributed by MLS Grid
- 2019-08-17 Pending — MARIS as Distributed by MLS Grid
- 2019-08-15 Listed $215,000 MARIS as Distributed by MLS Grid
- 2016-02-05 Sold (Public Records) $190,000 Public Records
- 2016-02-02 Sold (MLS) — MARIS as Distributed by MLS Grid
- 2016-01-02 Contingent — MARIS as Distributed by MLS Grid
- 2015-12-04 Listed $198,000 MARIS as Distributed by MLS Grid
- 2006-09-12 Sold (Public Records) $226,000 Public Records
- 2000-03-15 Sold (Public Records) — Public Records
- 1999-12-30 Sold (Public Records) — Public Records
- 1997-09-09 Sold (Public Records) $116,000 Public Records
- 1989-07-01 Sold (Public Records) $86,900 Public Records
- 1987-11-01 Sold (Public Records) $84,500 Public Records
Property tax history
+2.4%/yrLatest (2022): $3,251 · +0.7% YoY. Source: county tax records.
Cash-flow waterfall
monthlySold comps — $/sqft
last 12 mo · ≤1 miLoading sold comps…