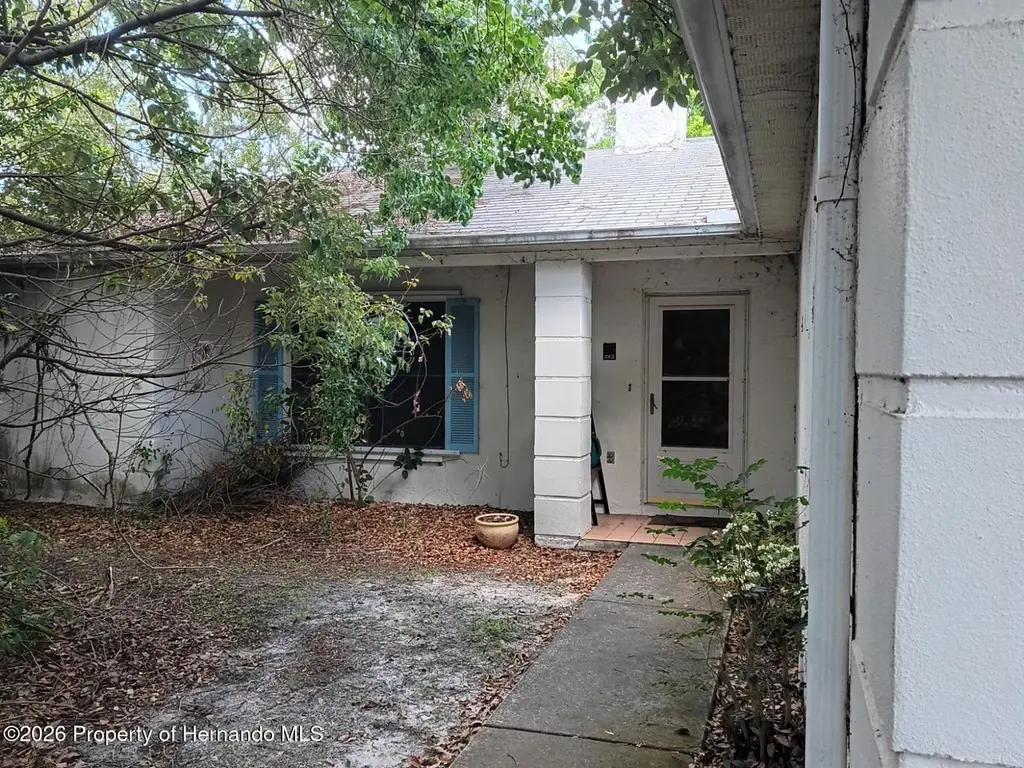
7346 Philatelic Dr · Spring Hill, FL
Flood risk 1/10 · Minimal
- FEMA flood zone
- X (unshaded)
- Chance of flooding over 30 yrs
- 0.0%
- Est. flood insurance / yr
- $507 – $1,088
Fire risk 4/10 · Minor
- Est. fire insurance / yr
- $947 – $1,759
Heat risk 10/10 · Severe
- Hot days now (above 110°F)
- 7 days/yr
- Hot days in 30 yrs
- 25 days/yr
Wind risk 10/10 · Severe
- Chance of severe wind over 30 yrs
- 99.0%
Air-quality risk 3/10 · Minor
- Unhealthy air days now
- 1 days/yr
- Unhealthy air days in 30 yrs
- 4 days/yr
Risk factors via First Street. Map © Google.
Why this score? — see what drove the D+ grade
The composite is a weighted blend of 9 inputs, each scored 0–100. Each bar is that input's sub-score; the figure is the points it added to the 100-point composite (weight × sub-score).
- ARV discount +15.0/15.0
- Cash flow +12.8/30.0
- Schools +4.2/10.0
- DSCR +3.8/10.0
- 1% rule +3.6/10.0
- Livability +3.2/5.0
- Condition / age +2.5/5.0
- Rent growth +2.3/5.0
- Appreciation +0.0/10.0
$219,000
🖨 Deal sheet 📄 Offer letter ✓ Due diligence
Listing remarks MLS
Home needs some TLC, paint & flooring. This a 2-bedroom 2 bath home, Master bedroom has an attached room perfect for a home office, nursery or reading room. Has a wood burning fireplace in the Living Room, eat-in kitchen with an additional breakfast bar and a screen porch for some you time to relax & unwind. Hurricane shutters are included for all window. Inside laundry room & a two car garage with automatic door opener.
Key facts
- Eat in kitchen
- Attached office
- Indoor laundry room
Tags
Property features AI
Finance
- Other: Zoning: RO81; Property type: Residential — Single Family Residence; Listed as unfurnished; Home warranty not included
- HOA & community: No HOA/association indicated
Exterior
- Parking: Attached 2-car garage (20 x 22) with garage door opener; Driveway
- Utilities: Well water; Septic tank; Electricity connected; Cable available; Private utilities; water available
- Home design: Single-family residence; One story; East-facing; Property listed as fixer
- Construction: Block and stucco construction; Shingle roof; Slab foundation; Building area approximately 2,094 total (1,417 living area)
- Exterior features: Paved road access; Sliding doors; Lot approximately 0.26 acres
Interior
- Kitchen: Dishwasher; Range; Range hood; Refrigerator
- Bedrooms: 2 bedrooms
- Flooring: Carpet; Vinyl
- Bathrooms: 2 full bathrooms
- Heating & cooling: Electric heating; Heat pump; Central air conditioning; Wood-burning fireplace in family room
- Interior features: Ceiling fans; Eat-in kitchen; High ceilings; Split bedroom layout; Walk-in closets; Sliding doors (exterior-interior access); Bonus room; Inside utility
- Laundry & utility: Laundry room with washer and electric dryer hookups; Inside laundry
Neighborhood map
What this means for you Summary
Snapshot
- This is a 2-bed/2.0-bath single-family listed at $219k.
Deal economics
- At list price, monthly cash flow is $-19 ($-226/yr) — negative.
- To cash-flow at today's rent, offer at most $216k (1.5% below list).
- To meet the 1% rule (rent ≥ 1% of price), the offer needs to be $189k (13.7% below list).
- Recommended offer: $189k (13.7% below list) — sets the bar for 1% rule.
- Cap rate 6.2% vs local median 4.4% in Spring Hill — top-decile yield for the area; either an underpriced asset or a hidden risk that comps aren't pricing in. Stress-test before assuming the spread holds.
Location & tenants
- Location reads 63/100 on livability (#738 in FL) — a middle-class / working-renter tenant base. Strengths: cost of living A+, housing A+; Watch: health & safety C-, employment D+, amenities F.
- Hernando (suburban): math 50% / reading 50% proficiency, ranked #38 of 73 in FL (top 52%) — acceptable for families but not a draw, mixed tenant base, ~2y average lease.
- Market conditions: Rents soft (-0.9%/yr); 386 active listings in the ZIP; 20 comparable units currently listed for rent nearby; rentals at typical pace (median 18d on market — plan ~3-4 weeks tenant-placement turnaround); 2,505 units permitted in Hernando County in 2024 (318 in 5+ unit buildings).
- This rent runs 40% of the median local income ($57k/yr) — at the standard rent-burdened threshold; future hikes will face affordability resistance.
Forward outlook
- Local home prices are declining (-3.0%/yr); year-one equity from $2k of loan paydown is wiped out by about $7k of value loss. Plan a longer hold.
- Hernando County population projected at +11% by 2050 — modest demand growth; plan on rents tracking national, not racing it.
Negotiation context
- Only 12 days on market — expect competitive offers; lowballing is unlikely to land.
- 5 sale attempts since 12y ago with the ask held roughly flat each time — persistent listings suggest the price (not the market) is what's stuck; bring a comps-based counter.
- Current owner paid $70k; list at $219k implies a 213% gain — meaningful room to come down on a strong offer.
Risks & watch-outs
- Climate carrying-cost: severe wind risk, 99% chance of damaging wind over 30y; extreme-heat days projected 7→25/yr by 2055 (HVAC capex compounding) — expect insurance premiums to compound above CPI over the hold.
Questions for the listing agent
- What do current leases actually rent for vs. the listed asking? Can we see a recent rent roll and the last 12 months of T-12 income?
- Is there a deadline driving the sale (1031 exchange, divorce, estate, relocation)? That informs how much negotiation room exists.
- The area grade is low — what's the realistic commute time and amenity access for the typical tenant pool here? Any planned neighborhood developments (good or bad) we should know about?
- What's the average days-on-market for RENTAL listings here right now (not sales)? A rising rental-DOM trend means longer vacancies and softer asking-rent achievability than the comps imply.
- What's the recent tenant-quality profile in this submarket — average credit score on applications, eviction rate, late-payment / NSF rate, and stable-employment percentage? A property-management company in the area should have these aggregated.
- How much new for-sale + rental construction is in the pipeline within 1–3 miles? Heavy new supply typically softens prices + rents 12–24 months out; constrained supply supports both.
Investment metrics
- 1% rule
- 0.86% ✗
- Cap rate
- 6.19%
- Cash-on-cash
- -0.37%
- DSCR
- 0.98
- GRM
- 9.7
CMA / ARV
- ARV (on-the-fly)
- $273,481
- Comps found
- 12
Show comp detail 12 sales within ~0.75 mi
| Address | Dist | Beds/Ba | Sqft | Sold | Price | $/sf | Match |
|---|---|---|---|---|---|---|---|
| 7376 Philatelic Dr | 0.07mi | 3/2.0 (+1) | 1,350 (-5%) | 1mo | $250,000 | $185 | 83 |
| 8082 Pagoda Dr | 0.32mi | 3/2.0 (+1) | 1,368 (-4%) | 3mo | $305,000 | $223 | 72 |
| 4076 Monona Ave | 0.51mi | 3/2.0 (+1) | 1,408 (-1%) | 1mo | $304,990 | $217 | 69 |
| 8448 Foxboro Ln | 0.59mi | 2/2.0 | 1,385 (-2%) | 1mo | $267,900 | $193 | 68 |
| 8040 Cessna Dr | 0.40mi | 3/2.0 (+1) | 1,304 (-8%) | 1mo | $194,900 | $149 | 62 |
| 3250 Painters St | 0.61mi | 3/2.0 (+1) | 1,382 (-2%) | 0mo | $250,000 | $181 | 62 |
| 8264 Goodrich St | 0.42mi | 2/2.0 | 1,230 (-13%) | 3mo | $268,500 | $218 | 56 |
| 8447 Elgrove St | 0.63mi | 2/2.0 | 1,288 (-9%) | 2mo | $254,000 | $197 | 54 |
| 4236 Bayridge Ct | 0.60mi | 3/2.0 (+1) | 1,533 (+8%) | 3mo | $270,000 | $176 | 51 |
| 3394 Memory Ln | 0.60mi | 2/2.0 | 1,215 (-14%) | 0mo | $215,000 | $177 | 48 |
| 7452 Wabash Trl | 0.64mi | 3/2.0 (+1) | 1,267 (-11%) | 1mo | $260,000 | $205 | 47 |
| 4342 Las Palmas Ave | 0.69mi | 2/2.0 | 1,606 (+13%) | 2mo | $195,000 | $121 | 44 |
Match score weights: distance 35% · size 25% · config 20% · recency 20%. Top-matched comps best support the ARV.
Projected returns pro-forma
-3.0% appreciation · 0.0% rent growth · sell at horizon
- IRR
- -20.3%
- Equity multiple
- 0.31×
- Total profit
- $-42,200
- Equity at exit
- $32,654
- IRR
- -21.9%
- Equity multiple
- 0.03×
- Total profit
- $-59,592
- Equity at exit
- $18,935
Cash invested: $61,320 (down + closing). Projections, not guarantees.
Landlord ↔ Tenant lean methodology
- Overall (STATE)
- 87 Strongly Landlord-Friendly
- State Florida
- 87 Strongly Landlord-Friendly · R+3
- County
- — inherits STATE
- City
- — inherits STATE
ZIP-level market 34606
- Home prices YoY
- -24.7%
- Rents YoY
- -0.9%
- Active inventory
- 386
- Price-to-rent
- 9.7×
Monthly cashflow live
- Estimated rent
- $1,891 high interval (Pro) →
- Mortgage (P&I)
- −$1,148
- Tax from tax record
- −$273 /mo · $3,274/yr
- Insurance
- −$91
- HOA
- −$0
- Vacancy / Maint / Mgmt
- −$397
- Net cashflow
- $-19
Break-even live
UW: 25.0% down · 7.5% · 30yr · 1.5% tax · 5.0% vac · 8.0% maint · 8.0% mgmt
Financing live
Cash to close
- Down payment
- $54,750
- Closing costs
- $6,570
- Reserves months
- —
- Total cash needed
- —
Loan-product check · same deal, 3 products live
Conventional
25% down · 7.5% · 30yr
- Down + closing
- —
- Monthly P&I
- —
- Monthly cashflow
- —
- DSCR
- —
- Eligible?
- —
Personal DTI + credit; lowest rate.
DSCR
20% down · 8.5% · 30yr
- Down + closing
- —
- Monthly P&I
- —
- Monthly cashflow
- —
- DSCR
- —
- Eligible?
- —
No personal income docs; deal must DSCR.
Hard money
10% down · 12.0% · 12mo
- Down + closing
- —
- Monthly P&I
- —
- Monthly cashflow
- —
- DSCR
- —
- Eligible?
- —
Short-term bridge; refi at stabilization.
Rent comps 20 comps
| Address | Beds | Baths | Sqft | Rent | $/sqft | DOM | Units | Dist |
|---|---|---|---|---|---|---|---|---|
| 7483 Apache Trl Spring Hill, FL | 3.0 | 2.0 | 1587 | $1,795 | $1.13 | 5d | 1 | 0.47mi |
| 3191 Deltona Blvd Spring Hill, FL | 3.0 | 2.0 | 1366 | $1,815 | $1.33 | 24d | 1 | 0.52mi |
| 4108 Monona Ave Spring Hill, FL | 3.0 | 2.0 | 1508 | $1,900 | $1.26 | 24d | 1 | 0.56mi |
| 7423 Apache Trl Spring Hill, FL | 3.0 | 2.0 | 1711 | $2,200 | $1.29 | 24d | 1 | 0.60mi |
| 7423 Mohawk Trl Spring Hill, FL | 3.0 | 2.0 | 1114 | $1,795 | $1.61 | 18d | 1 | 0.61mi |
| 8316 Nevada St Spring Hill, FL | 2.0 | 1.0 | 1722 | $2,100 | $1.22 | 24d | 1 | 0.62mi |
| 7410 Cherokee Trl Spring Hill, FL | 3.0 | 2.0 | 1196 | $1,725 | $1.44 | 12d | 1 | 0.63mi |
| 8397 Coral St Spring Hill, FL | 3.0 | 2.0 | 1202 | $1,689 | $1.41 | 3d | 1 | 0.67mi |
| 8513 Beach Rd Spring Hill, FL | 3.0 | 2.0 | 1378 | $1,990 | $1.44 | 18d | 1 | 0.71mi |
| 7369 Sealawn Dr Spring Hill, FL | 2.0 | 2.0 | 1154 | $2,500 | $2.17 | 3d | 1 | 0.86mi |
| 7272 Apache Trl Spring Hill, FL | 3.0 | 2.0 | 1408 | $2,650 | $1.88 | 24d | 1 | 0.88mi |
| 4628 Bayridge Ct Spring Hill, FL | 3.0 | 2.0 | 1756 | $1,995 | $1.14 | 4d | 1 | 0.90mi |
| 9483 Bayside Ct Spring Hill, FL | 3.0 | 2.0 | 1788 | $1,911 | $1.07 | 5d | 1 | 1.07mi |
| 4300 Bridgewater Club Loop Spring Hill, FL | 2.0–4.0 | 2.0–3.0 | 1214 | $1,268 | $1.04 | 2d | 13 | 1.09mi |
| 4470 Cynthia Ln Spring Hill, FL | 2.0 | 1.0 | 1016 | $1,400 | $1.38 | 20d | 1 | 1.19mi |
| 9156 Century Dr Spring Hill, FL | 2.0 | 2.0 | 1170 | $1,500 | $1.28 | 5d | 1 | 1.21mi |
| 4398 Plumosa St Spring Hill, FL | 3.0 | 2.0 | 1646 | $1,985 | $1.21 | 24d | 1 | 1.24mi |
| 4514 Cynthia Ln Spring Hill, FL | 2.0 | 2.0 | 1280 | $1,550 | $1.21 | 18d | 1 | 1.26mi |
| 3933 Antigua Way Spring Hill, FL | 3.0–5.0 | 2.0–3.0 | 1975 | $2,109 | $1.07 | 5d | 1 | 1.27mi |
| 4335 Pallas Ave Spring Hill, FL | 3.0 | 2.0 | 1248 | $1,685 | $1.35 | 24d | 1 | 1.35mi |
Listing history 11 events
-
2026-06-17remarks 506-char remark
-
2026-06-17status $219,000 Pending 12 DOM
-
2026-06-17days on market $219,000 Active 12 DOM
-
2026-06-16days on market $219,000 Active 11 DOM
-
2026-06-15days on market $219,000 Active 10 DOM
-
2026-06-13days on market $219,000 Active 8 DOM
-
2026-06-13days on market $219,000 Active 7 DOM
-
2026-06-09days on market $219,000 Active 4 DOM
-
2026-06-08days on market $219,000 Active 3 DOM
-
2026-06-07remarks 466-char remark
-
2026-06-07$219,000 Active 2 DOM
ⓘ Source: listings_history table (triggers on properties + properties_extension) + one-shot
backfill from property_details.listing_events for pre-trigger history.
Tax reassessment forecast FL · Resets to sale price
- Current annual tax
- $3,274 · $273/mo
- Projected year-2 tax
- $3,274 · $273/mo
- Expected delta
- $0/yr ($0/mo · 0.0%)
ⓘ Screening estimate from a state-policy table — verify with the county assessor before closing.
Climate risk First Street
- Flood 1/10 Low FEMA zone X (unshaded) · 0% chance over 30 yrs
- Wildfire 4/10 Moderate
- Heat 10/10 Extreme 7 d/yr ≥110°F today · 25 d/yr by 30 yrs out
- Wind 10/10 Extreme 99% chance of damaging wind over 30 yrs
- Air quality 3/10 Moderate 1 unhealthy d/yr today · 4 by 30 yrs out
Nearby sold comps map
Loading sold comps map…
Walkable amenities ~0.75 mi
Loading nearby amenities…
Taxation est. · year 1
- Rental income
- $22,690
- − Mortgage interest
- −$12,267
- − Property taxes
- −$3,274
- − Insurance
- −$1,095
- − Repairs & maintenance
- −$1,815
- − Management
- −$1,815
- − Depreciation
- −$6,371
- Taxable loss
- −$3,948
- Est. tax savings @ 24.0%
- +$948
- After-tax cash flow
- $722/yr
For passive investors: Depreciation is non-cash, so a rental often shows a tax loss while cash-flowing — sheltering income. Rental losses are passive: they offset passive income freely, and up to $25,000/yr can offset ordinary (W-2) income if you actively participate and your MAGI is under $100k (phasing out to $0 by $150k); unused losses carry forward. On sale, claimed depreciation is recaptured at up to 25%, and gains may owe capital-gains tax (a 1031 exchange can defer both). Figures are a year-1 estimate at your 24.0% rate — not tax advice; consult a CPA.
Schools (NCES district)
- District
- Hernando
- NCES district ID
- 1200810
- Math proficiency
- 50% ▼ -8.00%
- Reading proficiency
- 50% ▼ -4.00%
- Median HH income
- $41,985
- Composite
- 42.03/100
- National rank
- #3329
- State rank
- #38 of 73 in FL
Livability — Spring Hill
- Score
- 63/100
- State rank
- #738
- US rank
- #15937
Category grades
Schools grade is shown separately in the Schools card above.
Census & demographics
- Census place
- Spring Hill, FL
- County
- Hernando County · 169,677 people
- City population
- 83,915
- Metro
- Tampa-St. Petersburg-Clearwater, FL
- Population (ZIP)
- 28,668
- Household income
- $57,337
- Rent vs Own
- Severe rent burden
- 733.0
Population outlook (Hernando County) Hauer SSP2
- Today (2025)
- 189,218 people
- By 2030
- 194,367 · +2.7%
- By 2040
- 203,398 · +7.5%
- By 2050
- 209,589 · +10.8%
- By 2075
- 218,452 · +15.4%
- By 2100
- 205,923 · +8.8%
Race, ethnicity, and origin ACS 2023
- Neighborhood character
- Predominantly White (74%)
- Race & ethnicity
- White 74% Hispanic / Latino 16% Two or more races 13% Black 4%
- Hispanic origin (detail)
- Mexican 1% Puerto Rican 10% Cuban 2%
- Common ancestry
- Romanian 4% Lithuanian 3% Slovak 2%
- Foreign-born
- 8% · Canada, Jamaica
- Languages at home
- 87% English-only · Spanish 11% German/W. Germanic 1%
Political lean MEDSL · Hernando
- 2024 margin
- Solid R (+37.0) · D 31.1% · R 68.2%
- 2008→2024 swing
- -33.5pp toward R · 2008: -3.6pp · 2024: -37.0pp
- All cycles
- 2024: R+37.0 2020: R+30.2 2016: R+29.0 2012: R+8.5 2008: R+3.6
Not yet ingested
- Civics
- —
Market trends
- HPI YoY
- ▼ -98.11%
- Current HPI
- 298.5201
- Rent YoY
- ▼ -0.89%
- Metro
- Tampa-St. Petersburg-Clearwater, FL
- State GDP YoY
- ▲ 3.28%
- F500 in state
- 36
Industry mix (Fortune 500 HQ in FL)
| Industry | F500 HQs | Revenue |
|---|---|---|
| Industrial Technology | 2 | $29B |
|
||
| Insurance | 2 | $17B |
|
||
| Retail | 1 | $60B |
|
||
| Technology Distribution | 1 | $58B |
|
||
| Homebuilding | 1 | $35B |
|
||
| Technology Manufacturing | 1 | $35B |
|
||
Price history
+1522.2% since first listed10 events — show timeline
- 2026-06-06 Listed $219,000 HCAR
- 2026-06-05 Listed $219,000 Stellar MLS as Distributed by MLS Grid
- 2014-05-20 Sold (Public Records) $70,000 Public Records
- 2014-05-09 Sold (MLS) $70,000 St. Augustine and St. Johns County Board of REALTORS®
- 2014-05-09 Sold (MLS) $70,000 HCAR
- 2014-05-09 Sold (MLS) $70,000 Stellar MLS as Distributed by MLS Grid
- 2014-04-30 Listed $74,500 St. Augustine and St. Johns County Board of REALTORS®
- 2014-04-30 Listed $74,500 HCAR
- 2014-04-24 Listed $74,500 Stellar MLS as Distributed by MLS Grid
- 1986-06-01 Sold (Public Records) $13,500 Public Records
Property tax history
+14.2%/yrLatest (2025): $3,274 · -0.4% YoY. Source: county tax records.
Cash-flow waterfall
monthlySold comps — $/sqft
last 12 mo · ≤1 miLoading sold comps…