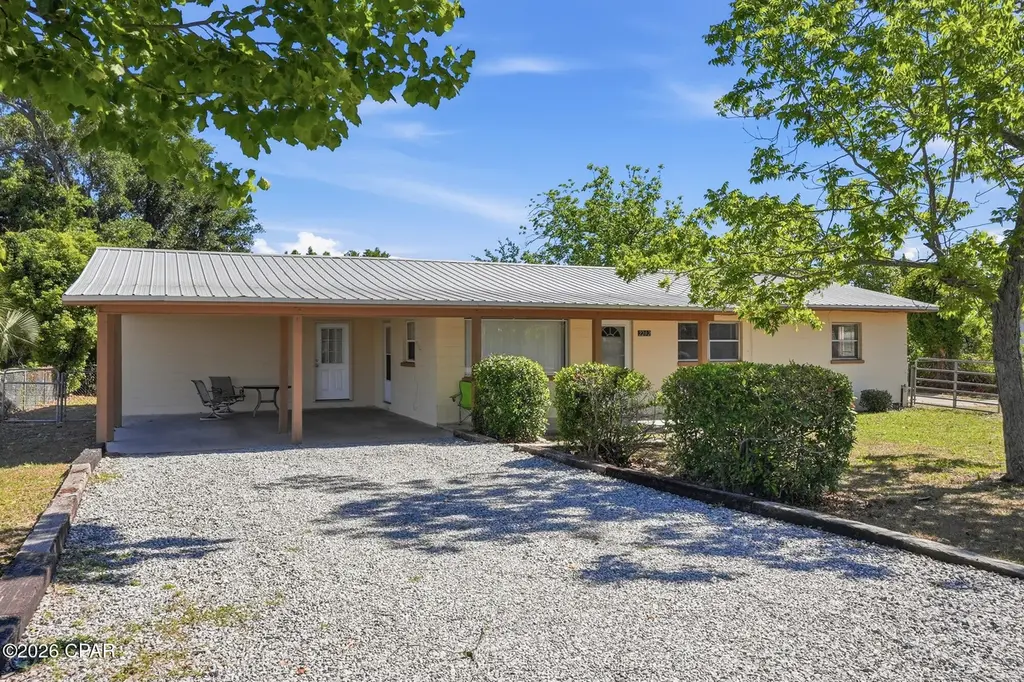
2202 Game Farm Rd · Panama City, FL
Flood risk 1/10 · Minimal
- FEMA flood zone
- X (unshaded)
- Chance of flooding over 30 yrs
- 0.0%
- Est. flood insurance / yr
- $507 – $1,088
Fire risk 3/10 · Minor
- Est. fire insurance / yr
- $947 – $1,759
Heat risk 10/10 · Severe
- Hot days now (above 105°F)
- 7 days/yr
- Hot days in 30 yrs
- 21 days/yr
Wind risk 9/10 · Severe
- Chance of severe wind over 30 yrs
- 99.0%
Air-quality risk 1/10 · Minimal
- Unhealthy air days now
- 0 days/yr
- Unhealthy air days in 30 yrs
- 0 days/yr
Risk factors via First Street. Map © Google.
Why this score? — see what drove the D grade
The composite is a weighted blend of 9 inputs, each scored 0–100. Each bar is that input's sub-score; the figure is the points it added to the 100-point composite (weight × sub-score).
- Cash flow +13.2/30.0
- ARV discount +7.0/15.0
- Schools +4.3/10.0
- DSCR +4.0/10.0
- Livability +3.6/5.0
- 1% rule +2.8/10.0
- Rent growth +2.8/5.0
- Condition / age +2.5/5.0
- Appreciation +0.0/10.0
$235,000
🖨 Deal sheet (PDF) 📄 Offer letter ✓ Due diligence
Listing remarks
Situated on over half an acre, this solid concrete block 3-bedroom, 1-bath home offers the perfect blend of space, functionality, and flexibility with no shortage of room for your hobbies, animals, and equipment! With horses and livestock allowed, this property is ideal for those seeking a mini-homestead or extra room to spread out. Recent updates include a durable metal roof (2018) and new PEX plumbing throughout the home, offering peace of mind for years to come. The property is connected to public water and sewer for added convenience. Outside, the possibilities are endless with an impressive lineup of outbuildings and storage options, including a 12x50 enclosed pole barn/workshop with 1
Key facts
- 0.52 acre lot
- Garage
- Built 1962
Property features AI
Finance
- HOA & community: Short-term rentals allowed
Exterior
- Parking: Attached garage with 1 garage space; RV carport
- Utilities: Electricity available; Public sewer
- Home design: Single-family property; Horses allowed (zoning)
- Construction: Block, metal siding, and concrete construction; Slab foundation
- Exterior features: Covered patio; Patio; Chain link fenced yard; Sprinkler system; Garage(s), RV/boat storage, shed(s), and workshop on property
Interior
- Kitchen: Electric range
- Bedrooms: Primary bedroom; Additional bedroom(s)
- Bathrooms: 1 full bathroom
- Interior features: Central heating and air with ceiling fans; Electric water heater
Neighborhood map
What this means for you Summary
Snapshot
- This is a 3-bed/1.0-bath single-family listed at $235k.
Deal economics
- At list price, monthly cash flow is $-3 ($-38/yr) — negative.
- To cash-flow at today's rent, offer at most $234k (0.2% below list).
- To meet the 1% rule (rent ≥ 1% of price), the offer needs to be $184k (21.8% below list).
- Recommended offer: $184k (21.8% below list) — sets the bar for 1% rule.
- Cap rate 6.3% vs local median 4.7% in Panama City — top-decile yield for the area; either an underpriced asset or a hidden risk that comps aren't pricing in. Stress-test before assuming the spread holds.
Location & tenants
- Location reads 72/100 on livability (#350 in FL) — a middle-class / working-renter tenant base. Strengths: cost of living A+, housing A+, health & safety A+; Watch: crime F, amenities F, commute F.
- Bay (suburban): math 51% / reading 51% proficiency, ranked #29 of 73 in FL (top 40%) — acceptable for families but not a draw, mixed tenant base, ~2y average lease.
- Zoned schools: Hiland Park Elementary School (math 42% / reading 36%, grade F, #1,560 of 2,144 statewide, top 73%, 643 students, 56% FRL); Mowat Middle School (math 49% / reading 51%, grade C, #254 of 571 statewide, top 45%, 868 students, 49% FRL); Bay High School (math 37% / reading 34%, grade F, #367 of 667 statewide, top 57%, 1,255 students, 53% FRL) — zoned schools at 53% FRL track the district average.
- Market conditions: Rents rising (+1.2%/yr); 382 active listings in the ZIP; 4 comparable units currently listed for rent nearby; rentals at typical pace (median 23d on market — plan ~3-4 weeks tenant-placement turnaround); 2,473 units permitted in Bay County in 2024 (559 in 5+ unit buildings).
- This rent runs 30% of the median local income ($73k/yr) — at the standard rent-burdened threshold; future hikes will face affordability resistance.
Forward outlook
- Local home prices are declining (-3.0%/yr); year-one equity from $2k of loan paydown is wiped out by about $7k of value loss. Plan a longer hold.
- Bay County population projected at +24% by 2050 — long-run rental-demand tailwind backs the buy-and-hold thesis.
Negotiation context
- It's been on market 46 days — a 3% lower offer ($228k) is reasonable based on typical stale-listing flexibility.
Risks & watch-outs
- Climate carrying-cost: severe wind risk, 99% chance of damaging wind over 30y; extreme-heat days projected 7→21/yr by 2055 (HVAC capex compounding) — expect insurance premiums to compound above CPI over the hold.
Questions for the listing agent
- What do current leases actually rent for vs. the listed asking? Can we see a recent rent roll and the last 12 months of T-12 income?
- It's been on market 46 days. Have you received any prior offers? Is the seller open to a 22% concession, seller financing, or rate buy-down credit?
- Built in 1962 — when were the roof, HVAC, electrical panel, plumbing, and water heater last replaced?
- Is there a deadline driving the sale (1031 exchange, divorce, estate, relocation)? That informs how much negotiation room exists.
- Schools are B-rated — typically a magnet for longer-tenancy family renters. What's the average tenant stay here, and is there a school-zone premium baked into asking?
- Crime grade is F in this area — have there been break-ins, vandalism, or insurance claims at this property in the last 3 years? What carrier currently insures it and at what premium?
- The area grade is low — what's the realistic commute time and amenity access for the typical tenant pool here? Any planned neighborhood developments (good or bad) we should know about?
- What's the average days-on-market for RENTAL listings here right now (not sales)? A rising rental-DOM trend means longer vacancies and softer asking-rent achievability than the comps imply.
- What's the recent tenant-quality profile in this submarket — average credit score on applications, eviction rate, late-payment / NSF rate, and stable-employment percentage? A property-management company in the area should have these aggregated.
- How much new for-sale + rental construction is in the pipeline within 1–3 miles? Heavy new supply typically softens prices + rents 12–24 months out; constrained supply supports both.
Investment metrics
- 1% rule
- 0.78% ✗
- Cap rate
- 6.28%
- Cash-on-cash
- -0.06%
- DSCR
- 1.00
- GRM
- 10.7
CMA / ARV
- ARV (median comp)
- $232,372
- List price
- $235,000
- Delta
- 1.13%
- Verdict
- FAIR
- Comps
- 10 within 1.0 mi
Show comp detail 3 sales within ~0.75 mi
| Address | Dist | Beds/Ba | Sqft | Sold | Price | $/sf | Match |
|---|---|---|---|---|---|---|---|
| 1036 E 26th St | 0.47mi | 3/1.0 | 1,000 (-11%) | 9mo | $221,500 | $222 | 54 |
| 928 E 25Th St | 0.66mi | 3/2.0 | 1,152 (+3%) | 8mo | $255,000 | $221 | 53 |
| 2808 Hyde Ave | 0.69mi | 3/2.0 | 1,200 (+7%) | 21mo | $255,000 | $213 | 34 |
Match score weights: distance 35% · size 25% · config 20% · recency 20%. Top-matched comps best support the ARV.
Projected returns pro-forma
-3.0% appreciation · 1.24% rent growth · sell at horizon
- IRR
- -18.2%
- Equity multiple
- 0.37×
- Total profit
- $-41,554
- Equity at exit
- $35,039
- IRR
- -14.0%
- Equity multiple
- 0.25×
- Total profit
- $-49,418
- Equity at exit
- $20,319
Cash invested: $65,800 (down + closing). Projections, not guarantees.
Landlord ↔ Tenant lean methodology
- Overall (STATE)
- 87 Strongly Landlord-Friendly
- State Florida
- 87 Strongly Landlord-Friendly · R+3
- County
- — inherits STATE
- City
- — inherits STATE
ZIP-level market 32405
- Rents YoY
- 1.2%
- Active inventory
- 382
- Price-to-rent
- 10.7×
Monthly cashflow live
- Estimated rent
- $1,837 medium interval (Pro) →
- Mortgage (P&I)
- −$1,232
- Tax from tax record
- −$124 /mo · $1,493/yr
- Insurance
- −$98
- HOA
- −$0
- Vacancy / Maint / Mgmt
- −$386
- Net cashflow
- $-3
Break-even live
Sensitivity live
| Price | -10% $130 | -5% $63 | +0% $-3 | +5% $-70 | +10% $-136 |
|---|---|---|---|---|---|
| Rent | -10% $-148 | -5% $-76 | +0% $-3 | +5% $69 | +10% $142 |
| Rate | -1.0pp $115 | -0.5pp $57 | base $-3 | +0.5pp $-64 | +1.0pp $-126 |
UW: 25.0% down · 7.5% · 30yr · 1.5% tax · 5.0% vac · 8.0% maint · 8.0% mgmt
Financing live
Cash to close
- Down payment
- $58,750
- Closing costs
- $7,050
- Reserves months
- —
- Total cash needed
- —
Loan-product check · same deal, 3 products live
Conventional
25% down · 7.5% · 30yr
- Down + closing
- —
- Monthly P&I
- —
- Monthly cashflow
- —
- DSCR
- —
- Eligible?
- —
Personal DTI + credit; lowest rate.
DSCR
20% down · 8.5% · 30yr
- Down + closing
- —
- Monthly P&I
- —
- Monthly cashflow
- —
- DSCR
- —
- Eligible?
- —
No personal income docs; deal must DSCR.
Hard money
10% down · 12.0% · 12mo
- Down + closing
- —
- Monthly P&I
- —
- Monthly cashflow
- —
- DSCR
- —
- Eligible?
- —
Short-term bridge; refi at stabilization.
Rent comps 4 comps
| Address | Beds | Baths | Sqft | Rent | $/sqft | DOM | Units | Dist |
|---|---|---|---|---|---|---|---|---|
| 2733 Carol Ln Panama City, FL | 2.0 | 2.0 | 950 | $1,750 | $1.84 | 22d | 1 | 0.18mi |
| 2950 Harrison Ave Panama City, FL | 1.0–3.0 | 1.0–2.0 | 1199 | $1,725 | $1.44 | 22d | 6 | 1.26mi |
| 2870 Harrison Ave Panama City, FL | 1.0–3.0 | 1.0–2.0 | 1230 | $1,770 | $1.44 | 22d | 1 | 1.35mi |
| 2002 Wilson Ave Panama City, FL | 1.0–3.0 | 1.0–2.0 | 977 | $2,260 | $2.31 | 14d | 25 | 1.45mi |
Listing history 19 events
-
2026-06-21days on market $235,000 Active 46 DOM
-
2026-06-19days on market $235,000 Active 44 DOM
-
2026-06-18days on market $235,000 Active 43 DOM
-
2026-06-17days on market $235,000 Active 42 DOM
-
2026-06-16days on market $235,000 Active 41 DOM
-
2026-06-15days on market $235,000 Active 40 DOM
-
2026-06-14days on market $235,000 Active 38 DOM
-
2026-06-13days on market $235,000 Active 37 DOM
-
2026-06-10days on market $235,000 Active 35 DOM
-
2026-06-09days on market $235,000 Active 34 DOM
-
2026-06-08days on market $235,000 Active 33 DOM
-
2026-06-07days on market $235,000 Active 32 DOM
-
2026-06-05days on market $235,000 Active 29 DOM
-
2026-06-03days on market $235,000 Active 28 DOM
-
2026-06-02days on market $235,000 Active 27 DOM
-
2026-06-01days on market $235,000 Active 26 DOM
-
2026-05-31days on market $235,000 Active 25 DOM
-
2026-05-30days on market $235,000 Active 24 DOM
-
2026-05-05$240,000 Active 1219-char remark
ⓘ Source: listings_history table (triggers on properties + properties_extension) + one-shot
backfill from property_details.listing_events for pre-trigger history.
Tax reassessment forecast FL · Resets to sale price
- Current annual tax
- $1,493 · $124/mo
- Projected year-2 tax
- $1,950 · $163/mo
- Expected delta
- +$458/yr (+$38/mo · 30.7%)
ⓘ Screening estimate from a state-policy table — verify with the county assessor before closing.
Climate risk First Street
- Flood 1/10 Low FEMA zone X (unshaded) · 0% chance over 30 yrs
- Wildfire 3/10 Moderate
- Heat 10/10 Extreme 7 d/yr ≥105°F today · 21 d/yr by 30 yrs out
- Wind 9/10 Extreme 99% chance of damaging wind over 30 yrs
- Air quality 1/10 Low 0 unhealthy d/yr today · 0 by 30 yrs out
Nearby sold comps map
Loading sold comps map…
Walkable amenities ~0.75 mi
Loading nearby amenities…
Taxation est. · year 1
- Rental income
- $22,049
- − Mortgage interest
- −$13,164
- − Property taxes
- −$1,493
- − Insurance
- −$1,175
- − Repairs & maintenance
- −$1,764
- − Management
- −$1,764
- − Depreciation
- −$6,836
- Taxable loss
- −$4,147
- Est. tax savings @ 24.0%
- +$995
- After-tax cash flow
- $958/yr
For passive investors: Depreciation is non-cash, so a rental often shows a tax loss while cash-flowing — sheltering income. Rental losses are passive: they offset passive income freely, and up to $25,000/yr can offset ordinary (W-2) income if you actively participate and your MAGI is under $100k (phasing out to $0 by $150k); unused losses carry forward. On sale, claimed depreciation is recaptured at up to 25%, and gains may owe capital-gains tax (a 1031 exchange can defer both). Figures are a year-1 estimate at your 24.0% rate — not tax advice; consult a CPA.
Schools (NCES district)
- District
- Bay
- NCES district ID
- 1200090
- Math proficiency
- 51% ▼ -8.00%
- Reading proficiency
- 51% ▼ -7.00%
- Median HH income
- $47,740
- Composite
- 43.41/100
- National rank
- #3014
- State rank
- #29 of 73 in FL
Livability — Panama City
- Score
- 72/100
- State rank
- #350
- US rank
- #5823
Category grades
Schools grade is shown separately in the Schools card above.
Census & demographics
- County
- Bay County · 163,593 people
- City population
- 91,445
- Metro
- Panama City, FL
- Population (ZIP)
- 29,984
- Household income
- $73,373
- Rent vs Own
- Severe rent burden
- 1008.0
Population outlook (Bay County) Hauer SSP2
- Today (2025)
- 206,264 people
- By 2030
- 217,740 · +5.6%
- By 2040
- 238,738 · +15.7%
- By 2050
- 255,545 · +23.9%
- By 2075
- 288,295 · +39.8%
- By 2100
- 288,638 · +39.9%
Race, ethnicity, and origin ACS 2023
- Neighborhood character
- Predominantly White (67%)
- Race & ethnicity
- White 67% Black 17% Two or more races 8% Hispanic / Latino 7% Native American 1%
- Hispanic origin (detail)
- Mexican 2% Puerto Rican 3%
- Common ancestry
- Slovak 4% Lithuanian 2% Romanian 2%
- Foreign-born
- 7% · Canada
- Languages at home
- 89% English-only · Spanish 6% Arabic 1% French/Haitian/Cajun 1%
Political lean MEDSL · Bay
- 2024 margin
- Solid R (+47.4) · D 25.8% · R 73.1% · Other 1.1%
- 2008→2024 swing
- -6.6pp toward R · 2008: -40.7pp · 2024: -47.4pp
- All cycles
- 2024: R+47.4 2020: R+43.5 2016: R+46.3 2012: R+43.6 2008: R+40.7
Not yet ingested
- Civics
- —
Market trends
- HPI YoY
- ▼ -217.88%
- Current HPI
- 262.7854
- Rent YoY
- ▲ 1.24%
- Metro
- Panama City, FL
- State GDP YoY
- ▲ 3.28%
- F500 in state
- 36
Industry mix (Fortune 500 HQ in FL)
| Industry | F500 HQs | Revenue |
|---|---|---|
| Industrial Technology | 2 | $29B |
|
||
| Insurance | 2 | $17B |
|
||
| Retail | 1 | $60B |
|
||
| Technology Distribution | 1 | $58B |
|
||
| Homebuilding | 1 | $35B |
|
||
| Technology Manufacturing | 1 | $35B |
|
||
Price history
-2.1% since first listed2 events — show timeline
- 2026-05-26 Price Changed $235,000 CPARMLS
- 2026-05-05 Listed $240,000 CPARMLS
Property tax history
+4.3%/yrLatest (2025): $1,493 · +8.6% YoY. Source: county tax records.
Cash-flow waterfall
monthlySold comps — $/sqft
last 12 mo · ≤1 miLoading sold comps…