 6-Plex
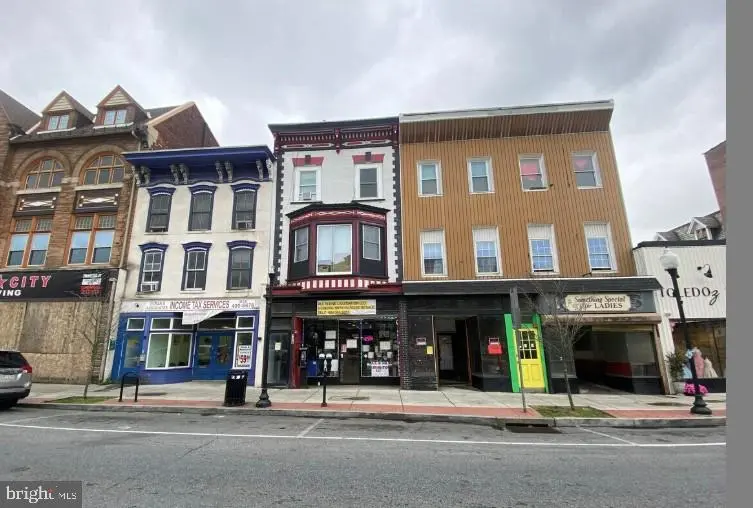
126 E Lincoln Hwy · Coatesville, PA
Flood risk 1/10 · Minimal
- FEMA flood zone
- X (unshaded)
- Chance of flooding over 30 yrs
- 0.0%
- Est. flood insurance / yr
- $507 – $1,088
Fire risk 3/10 · Minor
- Est. fire insurance / yr
- $511 – $949
Heat risk 6/10 · Moderate
- Hot days now (above 100°F)
- 7 days/yr
- Hot days in 30 yrs
- 15 days/yr
Wind risk 5/10 · Moderate
- Chance of severe wind over 30 yrs
- 23.0%
Air-quality risk 3/10 · Minor
- Unhealthy air days now
- 3 days/yr
- Unhealthy air days in 30 yrs
- 5 days/yr
Risk factors via First Street. Map © Google.
Why this score? — see what drove the B- grade
The composite is a weighted blend of 9 inputs, each scored 0–100. Each bar is that input's sub-score; the figure is the points it added to the 100-point composite (weight × sub-score).
- Cash flow +29.8/30.0
- DSCR +10.0/10.0
- 1% rule +8.7/10.0
- ARV discount +7.5/15.0
- Rent growth +3.7/5.0
- Livability +3.5/5.0
- Condition / age +2.5/5.0
- Schools +2.3/10.0
- Appreciation +0.0/10.0
$799,000
🖨 Deal sheet (PDF) 📄 Offer letter ✓ Due diligence
Multi-family units
County records classify this as Multi-Family (5+ Unit). Listing-text estimate: 6 units. confirmed
5+ unit building — per-unit beds/baths from public records are typically unavailable; the breakdown below (if shown) is an estimate from the listing text.
Listing remarks
* Six unit newly renovated apartment building with 3,000 S/F of first floor retail/office space available for lease. * Two- 3 bedroom and 1 bath, Two- 2 bedroom and 1 bath and Two-1 bedroom and 1 bath. * All apartments are leased. * Major renovation in 2023, most of the HVAC, plumbing, flooring and fixtures throughout the building are new. * N. O. I - $50,572.00
Key facts
- New plumbing
- New hvac
- Major renovation
Tags
Property features AI
Finance
- Financial info: Gross scheduled income approximately $77,520; Total actual rent approximately $81,600; Net operating income approximately $50,572; Insurance expense approximately $4,000; Trash expense approximately $2,400; Other expenses listed (approx. $6,000); Existing leases include month-to-month units (4)
Exterior
- Parking: Parking lot; On-street parking
- Utilities: Public water; Public sewer
- Home design: Multi-unit property (4 total units); Fee simple ownership
- Construction: Brick construction; Above-grade finished space; Estimated year built
- Exterior features: Located on heavily traveled Route 30; No tidal water
Interior
- Bedrooms: Two 1-bedroom units; Two 2-bedroom units
- Heating & cooling: Heating: Other/unspecified; Cooling: Other/unspecified; Hot water: Other/unspecified
- Interior features: Estimated living area; Accessible features (unspecified)
Neighborhood map
What this means for you Summary
Snapshot
- This is a 2×3bd/1ba + 2×2bd/1ba + 2×1bd/1ba units multifamily listed at $799k.
Deal economics
- At list price, monthly cash flow is $3k ($35k/yr) — positive. Per door: $489/mo.
- The deal already cash-flows at list — no discount required.
- Meets the 1% rule at list price ($11k rent vs $799k).
- Recommended offer: $787k (1.5% below list) — sets the bar for market timing.
- Cap rate 10.7% vs local median 5.1% in Coatesville — top-decile yield for the area; either an underpriced asset or a hidden risk that comps aren't pricing in. Stress-test before assuming the spread holds.
Location & tenants
- Location reads 70/100 on livability (#791 in PA) — a middle-class / working-renter tenant base. Strengths: cost of living A+, housing A+, health & safety A+; Watch: schools F, crime F, amenities F.
- Coatesville Area SD (suburban): math 18% / reading 31% proficiency, ranked #457 of 539 in PA (top 85%) — low school quality limits family demand, transient renter base, plan for 1-2y turnover.
- Market conditions: Rents rising fast (+4.8%/yr); 255 active listings in the ZIP; solid renter incomes; 1,513 units permitted in Chester County in 2024 (354 in 5+ unit buildings).
- At $10,977/mo this rent would consume 145% of the median local household income ($91k/yr) (locally 1480% of renters already pay >50% of income on rent) — very limited rent-growth headroom before tenants either downsize or default.
Forward outlook
- Local home prices are declining (-3.0%/yr); year-one equity from $6k of loan paydown is wiped out by about $24k of value loss. Plan a longer hold.
- Chester County population projected at +6% by 2050 — modest demand growth; plan on rents tracking national, not racing it.
- At projected returns (-3.0% appreciation + 4.8% rent growth), your $224k cash investment doubles in ~7 years — after that, you're playing with house money.
Negotiation context
- It's been on market 27 days — a 2% lower offer ($787k) is reasonable based on typical stale-listing flexibility.
- 6 sale attempts since 21y ago with the ask held roughly flat each time — persistent listings suggest the price (not the market) is what's stuck; bring a comps-based counter.
- Current owner paid $275k; list at $799k implies a 191% gain — meaningful room to come down on a strong offer.
Risks & watch-outs
- Watch-outs: built in 1954 — expect roof / HVAC / electrical / plumbing capex.
- Climate carrying-cost: moderate wind risk, 23% chance of damaging wind over 30y; extreme-heat days projected 7→15/yr by 2055 (HVAC capex compounding) — expect insurance premiums to compound above CPI over the hold.
Questions for the listing agent
- Can we see the unit-by-unit rent roll, current vacancy, and any below-market leases? What's the average tenancy length?
- What capital expenditures (roof, boiler, parking lot, exteriors) have been made in the last 5 years, and what's planned in the next 2?
- Built in 1954 — when were the roof, HVAC, electrical panel, plumbing, and water heater last replaced?
- Is there a deadline driving the sale (1031 exchange, divorce, estate, relocation)? That informs how much negotiation room exists.
- Schools are F-rated, which usually means shorter tenancies and higher turnover. Who's the typical renter profile here, and what's been the actual vacancy rate?
- Crime grade is F in this area — have there been break-ins, vandalism, or insurance claims at this property in the last 3 years? What carrier currently insures it and at what premium?
- What's the average days-on-market for RENTAL listings here right now (not sales)? A rising rental-DOM trend means longer vacancies and softer asking-rent achievability than the comps imply.
- What's the recent tenant-quality profile in this submarket — average credit score on applications, eviction rate, late-payment / NSF rate, and stable-employment percentage? A property-management company in the area should have these aggregated.
- How much new apartment / multifamily construction is in the pipeline within 1–3 miles? Heavy new supply (>2% of stock underway) typically softens rents 12–24 months out; light construction supports rent growth.
Investment metrics
- 1% rule
- 1.37% ✓
- Cap rate
- 10.70%
- Cash-on-cash
- 15.75%
- DSCR
- 1.70
- GRM
- 6.1
CMA / ARV
- ARV (median comp)
- $514,418
- List price
- $799,000
- Delta
- 55.32%
- Verdict
- OVERPRICED
- Comps
- 1 within 2.0 mi
Projected returns pro-forma
-3.0% appreciation · 4.82% rent growth · sell at horizon
- IRR
- 8.7%
- Equity multiple
- 1.35×
- Total profit
- $78,317
- Equity at exit
- $119,133
- IRR
- 19.5%
- Equity multiple
- 2.78×
- Total profit
- $397,392
- Equity at exit
- $69,083
Cash invested: $223,720 (down + closing). Projections, not guarantees.
Landlord ↔ Tenant lean methodology
- Overall (STATE)
- 62 Landlord-Friendly
- State Pennsylvania
- 62 Landlord-Friendly · EVEN
- County
- — inherits STATE
- City
- — inherits STATE
ZIP-level market 19320
- Rents YoY
- 4.8%
- Active inventory
- 255
- Price-to-rent
- 34.2×
Monthly cashflow live
- Estimated rent
- $10,977 high interval (Pro) →
- Mortgage (P&I)
- −$4,190
- Tax from tax record
- −$1,212 /mo · $14,548/yr
- Insurance
- −$333
- HOA
- −$0
- Vacancy / Maint / Mgmt
- −$2,305
- Net cashflow
- $2,937
Break-even live
Sensitivity live
| Price | -10% $3,389 | -5% $3,163 | +0% $2,937 | +5% $2,710 | +10% $2,484 |
|---|---|---|---|---|---|
| Rent | -10% $2,069 | -5% $2,503 | +0% $2,937 | +5% $3,370 | +10% $3,804 |
| Rate | -1.0pp $3,339 | -0.5pp $3,140 | base $2,937 | +0.5pp $2,729 | +1.0pp $2,519 |
6-unit breakdown (identical units grouped — click to expand)
| Units | Beds | Baths | Est. rent |
|---|---|---|---|
| 2× units | 3 | 1 | $3,896 |
| #1 | 3 | 1 | $1,948 |
| #2 | 3 | 1 | $1,948 |
| 2× units | 2 | 1 | $3,640 |
| #3 | 2 | 1 | $1,820 |
| #4 | 2 | 1 | $1,820 |
| 2× units | 1 | 1 | $3,440 |
| #5 | 1 | 1 | $1,720 |
| #6 | 1 | 1 | $1,720 |
| Total (6 units) | $10,977 | ||
UW: 25.0% down · 7.5% · 30yr · 1.5% tax · 5.0% vac · 8.0% maint · 8.0% mgmt
Financing live
Cash to close
- Down payment
- $199,750
- Closing costs
- $23,970
- Reserves months
- —
- Total cash needed
- —
Loan-product check · same deal, 3 products live
Conventional
25% down · 7.5% · 30yr
- Down + closing
- —
- Monthly P&I
- —
- Monthly cashflow
- —
- DSCR
- —
- Eligible?
- —
Personal DTI + credit; lowest rate.
DSCR
20% down · 8.5% · 30yr
- Down + closing
- —
- Monthly P&I
- —
- Monthly cashflow
- —
- DSCR
- —
- Eligible?
- —
No personal income docs; deal must DSCR.
Hard money
10% down · 12.0% · 12mo
- Down + closing
- —
- Monthly P&I
- —
- Monthly cashflow
- —
- DSCR
- —
- Eligible?
- —
Short-term bridge; refi at stabilization.
Listing history 19 events
-
2026-06-04days on market $799,000 Active 27 DOM
-
2026-06-03days on market $799,000 Active 26 DOM
-
2026-06-02days on market $799,000 Active 25 DOM
-
2026-06-01days on market $799,000 Active 24 DOM
-
2026-05-31days on market $799,000 Active 23 DOM
-
2026-05-08$799,000 Active 369-char remark
-
2012-12-31historical
-
2012-03-06$330,000
-
2011-06-30historical
-
2010-08-14$429,000
-
2010-06-30historical
-
2009-07-23$399,000
-
2007-12-30historical
-
2007-03-12$399,999
-
2006-04-24soldstatus $275,000
-
2006-04-13soldstatus $275,000
-
2006-03-14historical
-
2005-11-08$275,000
-
1989-06-01soldstatus $65,000
ⓘ Source: listings_history table (triggers on properties + properties_extension) + one-shot
backfill from property_details.listing_events for pre-trigger history.
Tax reassessment forecast PA · Partial reset (capped growth)
- Current annual tax
- $14,548 · $1,212/mo
- Projected year-2 tax
- $14,548 · $1,212/mo
- Expected delta
- $0/yr ($0/mo · -0.0%)
ⓘ Screening estimate from a state-policy table — verify with the county assessor before closing.
Climate risk First Street
- Flood 1/10 Low FEMA zone X (unshaded) · 0% chance over 30 yrs
- Wildfire 3/10 Moderate
- Heat 6/10 Major 7 d/yr ≥100°F today · 15 d/yr by 30 yrs out
- Wind 5/10 Major 23% chance of damaging wind over 30 yrs
- Air quality 3/10 Moderate 3 unhealthy d/yr today · 5 by 30 yrs out
Nearby sold comps map
Loading sold comps map…
Walkable amenities ~0.75 mi
Loading nearby amenities…
Taxation est. · year 1
- Rental income
- $131,724
- − Mortgage interest
- −$44,756
- − Property taxes
- −$14,548
- − Insurance
- −$3,995
- − Repairs & maintenance
- −$10,538
- − Management
- −$10,538
- − Depreciation
- −$23,244
- Taxable income
- $24,105
- Est. tax owed @ 24.0%
- −$5,785
- After-tax cash flow
- $29,453/yr
For passive investors: Depreciation is non-cash, so a rental often shows a tax loss while cash-flowing — sheltering income. Rental losses are passive: they offset passive income freely, and up to $25,000/yr can offset ordinary (W-2) income if you actively participate and your MAGI is under $100k (phasing out to $0 by $150k); unused losses carry forward. On sale, claimed depreciation is recaptured at up to 25%, and gains may owe capital-gains tax (a 1031 exchange can defer both). Figures are a year-1 estimate at your 24.0% rate — not tax advice; consult a CPA.
Schools (NCES district)
- District
- Coatesville Area SD
- NCES district ID
- 4206240
- Math proficiency
- 18% ▼ -9.00%
- Reading proficiency
- 31% ▼ -9.00%
- Median HH income
- $66,753
- Composite
- 23.19/100
- National rank
- #7944
- State rank
- #457 of 539 in PA
Livability — Coatesville
- Score
- 70/100
- State rank
- #791
- US rank
- #7996
Category grades
Schools grade is shown separately in the Schools card above.
Census & demographics
- Census place
- Coatesville, PA
- County
- Chester County · 432,350 people
- City population
- 55,941
- Metro
- Philadelphia-Camden-Wilmington, PA-NJ-DE-MD
- Population (ZIP)
- 55,941
- Household income
- $90,601
- Rent vs Own
- Severe rent burden
- 1480.0
Population outlook (Chester County) Hauer SSP2
- Today (2025)
- 546,756 people
- By 2030
- 559,441 · +2.3%
- By 2040
- 576,377 · +5.4%
- By 2050
- 580,602 · +6.2%
- By 2075
- 581,575 · +6.4%
- By 2100
- 540,922 · -1.1%
Race, ethnicity, and origin ACS 2023
- Neighborhood character
- Diverse neighborhood (Simpson 0.57)
- Race & ethnicity
- White 62% Black 17% Hispanic / Latino 14% Two or more races 11%
- Hispanic origin (detail)
- Mexican 5% Puerto Rican 5%
- Common ancestry
- Romanian 4% Lithuanian 2% Slovak 2%
- Foreign-born
- 6% · Canada
- Languages at home
- 87% English-only · Spanish 10% German/W. Germanic 1% Russian/Polish/Slavic 0%
Political lean MEDSL · Chester
- 2024 margin
- D (+14.5) · D 56.7% · R 42.2% · Other 1.0%
- 2008→2024 swing
- +5.2pp toward D · 2008: 9.2pp · 2024: 14.5pp
- All cycles
- 2024: D+14.5 2020: D+17.0 2016: D+9.2 2012: R+0.4 2008: D+9.2
Not yet ingested
- Civics
- —
Market trends
- HPI YoY
- ▼ -195.38%
- Current HPI
- 274.045
- Rent YoY
- ▲ 4.82%
- Metro
- Philadelphia-Camden-Wilmington, PA-NJ-DE-MD
- State GDP YoY
- ▲ 1.68%
- F500 in state
- 34
Industry mix (Fortune 500 HQ in PA)
| Industry | F500 HQs | Revenue |
|---|---|---|
| Healthcare | 2 | $309B |
|
||
| Insurance | 2 | $27B |
|
||
| Telecommunications / Media | 1 | $124B |
|
||
| Industrial Distribution | 1 | $22B |
|
||
| Financial Services | 1 | $20B |
|
||
| Chemicals / Materials | 1 | $18B |
|
||
Price history
+1129.2% since first listed15 events — show timeline
- 2026-06-05 Listing Removed — BRIGHT MLS
- 2026-05-08 Listed $799,000 BRIGHT MLS
- 2012-12-31 Listing Removed — BRIGHT MLS
- 2012-03-06 Listed $330,000 BRIGHT MLS
- 2011-06-30 Listing Removed — BRIGHT MLS
- 2010-08-14 Listed $429,000 BRIGHT MLS
- 2010-06-30 Listing Removed — BRIGHT MLS
- 2009-07-23 Listed $399,000 BRIGHT MLS
- 2007-12-30 Listing Removed — BRIGHT MLS
- 2007-03-12 Listed $399,999 BRIGHT MLS
- 2006-04-24 Sold (Public Records) $275,000 Public Records
- 2006-04-13 Sold (MLS) $275,000 BRIGHT MLS
- 2006-03-14 Listing Removed — BRIGHT MLS
- 2005-11-08 Listed $275,000 BRIGHT MLS
- 1989-06-01 Sold (Public Records) $65,000 Public Records
Property tax history
+5.0%/yrLatest (2026): $14,548 · +2.4% YoY. Source: county tax records.
Cash-flow waterfall
monthlySold comps — $/sqft
last 12 mo · ≤1 miLoading sold comps…