 🌊 Lakefront
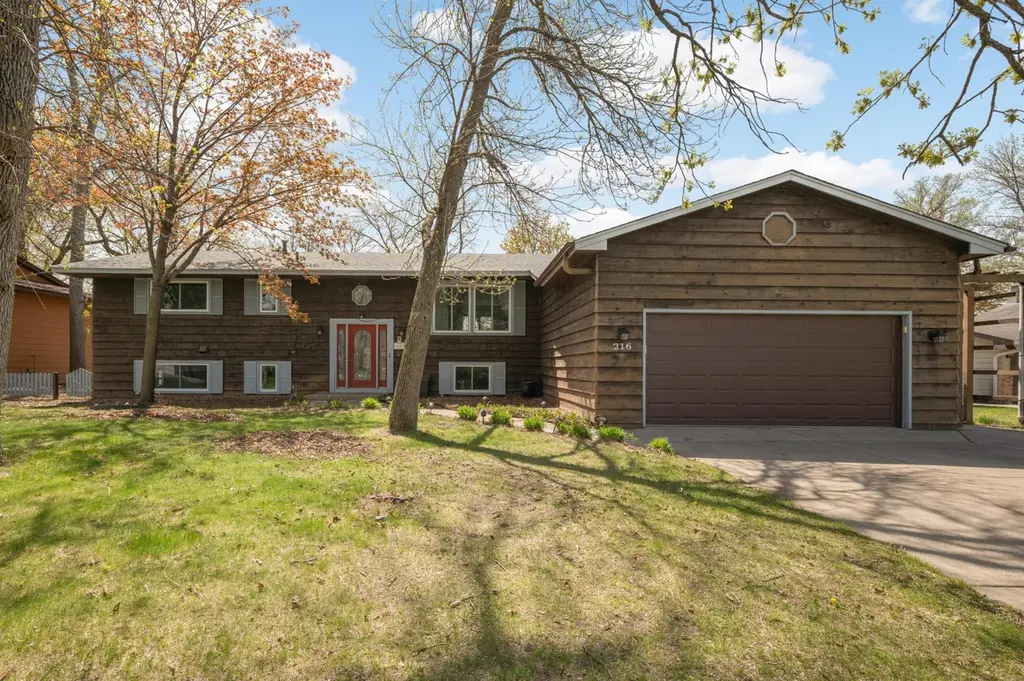
216 Lowell Rd · Champlin, MN
Flood risk 9/10 · Severe
- FEMA flood zone
- X (unshaded)
- Chance of flooding over 30 yrs
- 0.99%
- Est. flood insurance / yr
- $473 – $860
Fire risk 1/10 · Minimal
- Est. fire insurance / yr
- $888 – $1,650
Heat risk 2/10 · Minimal
- Hot days now (above 100°F)
- 7 days/yr
- Hot days in 30 yrs
- 14 days/yr
Wind risk 2/10 · Minimal
- Chance of severe wind over 30 yrs
- —
Air-quality risk 2/10 · Minimal
- Unhealthy air days now
- 2 days/yr
- Unhealthy air days in 30 yrs
- 2 days/yr
Risk factors via First Street. Map © Google.
Why this score? — see what drove the D grade
The composite is a weighted blend of 9 inputs, each scored 0–100. Each bar is that input's sub-score; the figure is the points it added to the 100-point composite (weight × sub-score).
- ARV discount +15.0/15.0
- Cash flow +7.9/30.0
- Schools +4.7/10.0
- Livability +4.5/5.0
- Rent growth +2.5/5.0
- Condition / age +2.5/5.0
- 1% rule +2.0/10.0
- DSCR +2.0/10.0
- Appreciation +0.0/10.0
$399,900
🖨 Deal sheet 📄 Offer letter ✓ Due diligence
Listing remarks
Proudly offered for the first time since 1975, this original owner home is ready for its next chapter. Featuring 5 bedrooms, 3 bathrooms, and over 3,500 finished square feet, this spacious split level offers room to grow, gather, and enjoy. The thoughtful layout includes multiple living areas and is set on a beautiful 0.30 acre lot overlooking Mill Pond, you’ll love the peaceful setting and scenic views right from your backyard. The attached garage provides ample space for parking, storage, and a workshop area. A rare opportunity to own a well-loved home in a prime Champlin location close to parks, trails, shopping, and easy access to major roadways. While the home has been cared for
Key facts
- 0.3 acre lot
- 2 garage spots
- Built 1975
Property features AI
Exterior
- Parking: Attached 2-car garage
- Utilities: City water; City sewer; Natural gas
- Home design: Residential property; Split entry (bi-level) design; Concrete perimeter foundation
- Construction: Below-grade and above-grade finished living areas; Foundation area 1,596 (finished area below grade)
- Exterior features: Lot approximately 0.3 acres with dimensions 155 x 122 x 150 x 82
Interior
- Bedrooms: 5 bedrooms
- Bathrooms: 2 full bathrooms; 1 half bathroom
- Heating & cooling: Forced air heating; Central air conditioning
- Interior features: Finished basement with block construction and egress windows; Two fireplaces
Neighborhood map
What this means for you Summary
Snapshot
- This is a 4-bed/2.5-bath single-family listed at $400k.
Deal economics
- At list price, monthly cash flow is $-475 ($-6k/yr) — negative.
- To cash-flow at today's rent, offer at most $316k (21.0% below list).
- To meet the 1% rule (rent ≥ 1% of price), the offer needs to be $280k (30.0% below list).
- Recommended offer: $280k (30.0% below list) — sets the bar for 1% rule.
- Cap rate 5.0% vs local median 3.9% in Champlin — meaningfully above typical; check what's discounted (condition, days-on-market, listing class) to confirm the premium yield is real.
Location & tenants
- Location reads 90/100 on livability (#4 in MN, #106 nationally) — a professional / high-income tenant draw. Strengths: commute A+, employment A+, housing A+.
- Anoka-Hennepin Public School District (suburban): math 49% / reading 55% proficiency, ranked #71 of 301 in MN (top 24%) — acceptable for families but not a draw, mixed tenant base, ~2y average lease.
- Market conditions: 106 active listings in the ZIP; high-income renter base; 4,651 units permitted in Hennepin County in 2024 (2,443 in 5+ unit buildings).
Forward outlook
- Local home prices are declining (-3.0%/yr); year-one equity from $3k of loan paydown is wiped out by about $12k of value loss. Plan a longer hold.
- Hennepin County population projected at +30% by 2050 — long-run rental-demand tailwind backs the buy-and-hold thesis.
Negotiation context
- It's been on market 15 days — a 2% lower offer ($394k) is reasonable based on typical stale-listing flexibility.
- Current owner paid $40k; list at $400k implies a 900% gain — meaningful room to come down on a strong offer.
Risks & watch-outs
- Watch-outs: flood insurance adds $56/mo.
- Climate carrying-cost: severe flood risk — expect insurance premiums to compound above CPI over the hold.
Questions for the listing agent
- What do current leases actually rent for vs. the listed asking? Can we see a recent rent roll and the last 12 months of T-12 income?
- Built in 1975 — when were the roof, HVAC, electrical panel, plumbing, and water heater last replaced?
- What's the actual annual flood-insurance premium (NFIP or private), and is the property in a SFHA with mandatory coverage?
- Is there a deadline driving the sale (1031 exchange, divorce, estate, relocation)? That informs how much negotiation room exists.
- Schools are A-rated — typically a magnet for longer-tenancy family renters. What's the average tenant stay here, and is there a school-zone premium baked into asking?
- The area grade is low — what's the realistic commute time and amenity access for the typical tenant pool here? Any planned neighborhood developments (good or bad) we should know about?
- This sits on a lake — are riparian / water-frontage rights deeded with the parcel? Any dock permits, shoreline easements, or HOA water-use restrictions?
- What's the documented flood / surge / shoreline-erosion history here (FEMA AND non-FEMA — e.g., storm surge, creek backup, septic-field saturation)?
- Any water-quality or seasonal algae-bloom issues that affect tenant satisfaction or short-term-rental demand?
- What's the average days-on-market for RENTAL listings here right now (not sales)? A rising rental-DOM trend means longer vacancies and softer asking-rent achievability than the comps imply.
- What's the recent tenant-quality profile in this submarket — average credit score on applications, eviction rate, late-payment / NSF rate, and stable-employment percentage? A property-management company in the area should have these aggregated.
- How much new for-sale + rental construction is in the pipeline within 1–3 miles? Heavy new supply typically softens prices + rents 12–24 months out; constrained supply supports both.
Investment metrics
- 1% rule
- 0.70% ✗
- Cap rate
- 5.03%
- Cash-on-cash
- -4.50%
- DSCR
- 0.80
- GRM
- 11.9
CMA / ARV
- ARV (median comp)
- $501,224
- List price
- $399,900
- Delta
- -20.22%
- Verdict
- UNDERPRICED
- Comps
- 6 within 2.0 mi
Projected returns pro-forma
-3.0% appreciation · 3.0% rent growth · sell at horizon
- IRR
- -25.0%
- Equity multiple
- 0.15×
- Total profit
- $-95,072
- Equity at exit
- $59,626
- IRR
- -20.9%
- Equity multiple
- -0.09×
- Total profit
- $-121,782
- Equity at exit
- $34,576
Cash invested: $111,972 (down + closing). Projections, not guarantees.
Landlord ↔ Tenant lean methodology
- Overall (STATE)
- 46 Balanced
- State Minnesota
- 46 Balanced · D+2
- County
- — inherits STATE
- City
- — inherits STATE
ZIP-level market 55316
- Active inventory
- 106
- Price-to-rent
- 11.9×
Monthly cashflow live
- Estimated rent
- $2,797 medium interval (Pro) →
- Mortgage (P&I)
- −$2,097
- Tax from tax record
- −$366 /mo · $4,391/yr
- Insurance
- −$167
- Flood insurance flood zone
- −$56 /mo · $666/yr
- HOA
- −$0
- Vacancy / Maint / Mgmt
- −$587
- Net cashflow
- $-475
Break-even live
UW: 25.0% down · 7.5% · 30yr · 1.5% tax · 5.0% vac · 8.0% maint · 8.0% mgmt
Financing live
Cash to close
- Down payment
- $99,975
- Closing costs
- $11,997
- Reserves months
- —
- Total cash needed
- —
Loan-product check · same deal, 3 products live
Conventional
25% down · 7.5% · 30yr
- Down + closing
- —
- Monthly P&I
- —
- Monthly cashflow
- —
- DSCR
- —
- Eligible?
- —
Personal DTI + credit; lowest rate.
DSCR
20% down · 8.5% · 30yr
- Down + closing
- —
- Monthly P&I
- —
- Monthly cashflow
- —
- DSCR
- —
- Eligible?
- —
No personal income docs; deal must DSCR.
Hard money
10% down · 12.0% · 12mo
- Down + closing
- —
- Monthly P&I
- —
- Monthly cashflow
- —
- DSCR
- —
- Eligible?
- —
Short-term bridge; refi at stabilization.
Listing history 5 events
-
2026-05-12historical Contingent - Inspection 832-char remark
-
2026-05-10price $399,900 832-char remark
-
2026-05-08$424,900 Active 832-char remark
-
2026-04-23historical $424,900 832-char remark
-
1973-04-01soldstatus $40,000
ⓘ Source: listings_history table (triggers on properties + properties_extension) + one-shot
backfill from property_details.listing_events for pre-trigger history.
Tax reassessment forecast MN · Partial reset (capped growth)
- Current annual tax
- $4,391 · $366/mo
- Projected year-2 tax
- $4,435 · $370/mo
- Expected delta
- +$44/yr (+$4/mo · 1.0%)
ⓘ Screening estimate from a state-policy table — verify with the county assessor before closing.
Climate risk First Street
- Flood 9/10 Extreme FEMA zone X (unshaded) · 99% chance over 30 yrs
- Wildfire 1/10 Low
- Heat 2/10 Low 7 d/yr ≥100°F today · 14 d/yr by 30 yrs out
- Wind 2/10 Low
- Air quality 2/10 Low 2 unhealthy d/yr today · 2 by 30 yrs out
Nearby sold comps map
Loading sold comps map…
Walkable amenities ~0.75 mi
Loading nearby amenities…
Taxation est. · year 1
- Rental income
- $33,569
- − Mortgage interest
- −$22,401
- − Property taxes
- −$4,391
- − Insurance
- −$2,666
- − Repairs & maintenance
- −$2,686
- − Management
- −$2,686
- − Depreciation
- −$11,633
- Taxable loss
- −$12,892
- Est. tax savings @ 24.0%
- +$3,094
- After-tax cash flow
- $-2,608/yr
For passive investors: Depreciation is non-cash, so a rental often shows a tax loss while cash-flowing — sheltering income. Rental losses are passive: they offset passive income freely, and up to $25,000/yr can offset ordinary (W-2) income if you actively participate and your MAGI is under $100k (phasing out to $0 by $150k); unused losses carry forward. On sale, claimed depreciation is recaptured at up to 25%, and gains may owe capital-gains tax (a 1031 exchange can defer both). Figures are a year-1 estimate at your 24.0% rate — not tax advice; consult a CPA.
Schools (NCES district)
- District
- Anoka-Hennepin Public School District
- NCES district ID
- 2703180
- Math proficiency
- 49% ▼ -14.00%
- Reading proficiency
- 55% ▼ -10.00%
- Median HH income
- $73,837
- Composite
- 46.7/100
- National rank
- #2400
- State rank
- #71 of 301 in MN
Livability — Champlin
- Score
- 90/100
- State rank
- #4
- US rank
- #106
Category grades
Schools grade is shown separately in the Schools card above.
Census & demographics
- Census place
- Champlin, MN
- County
- Hennepin County · 1,150,272 people
- City population
- 23,294
- Metro
- Minneapolis-St. Paul-Bloomington, MN-WI
- Population (ZIP)
- 23,294
- Household income
- $116,102
- Rent vs Own
- Severe rent burden
- 270.0
Population outlook (Hennepin County) Hauer SSP2
- Today (2025)
- 1,405,227 people
- By 2030
- 1,492,650 · +6.2%
- By 2040
- 1,660,157 · +18.1%
- By 2050
- 1,823,498 · +29.8%
- By 2075
- 2,221,283 · +58.1%
- By 2100
- 2,509,976 · +78.6%
Race, ethnicity, and origin ACS 2023
- Neighborhood character
- Predominantly White (78%)
- Race & ethnicity
- White 78% Black 11% Asian 4% Two or more races 4% Hispanic / Latino 2%
- Common ancestry
- Portuguese 12% Romanian 4% Lithuanian 3%
- Foreign-born
- 11% · Canada, Vietnam, South Korea
- Languages at home
- 88% English-only · Russian/Polish/Slavic 2% Other Asian/Pacific 2% Spanish 1%
Political lean MEDSL · Hennepin
- 2024 margin
- Solid D (+42.6) · D 70.2% · R 27.5% · Other 2.3%
- 2008→2024 swing
- +14.0pp toward D · 2008: 28.6pp · 2024: 42.6pp
- All cycles
- 2024: D+42.6 2020: D+43.2 2016: D+35.3 2012: D+27.1 2008: D+28.6
Not yet ingested
- Civics
- —
Market trends
- HPI YoY
- ▼ -311.30%
- Current HPI
- 229.5956
- Rent YoY
- —
- Metro
- Minneapolis-St. Paul-Bloomington, MN-WI
- State GDP YoY
- ▲ 2.41%
- F500 in state
- 34
Industry mix (Fortune 500 HQ in MN)
| Industry | F500 HQs | Revenue |
|---|---|---|
| Healthcare | 2 | $407B |
|
||
| Retail | 2 | $150B |
|
||
| Consumer Goods | 2 | $32B |
|
||
| Industrial Machinery | 2 | $6B |
|
||
| Agriculture | 1 | $40B |
|
||
| Healthcare / Medical Devices | 1 | $32B |
|
||
Price history
+899.8% since first listed6 events — show timeline
- 2026-05-22 Pending — NORTHSTARMLS as Distributed by MLS Grid
- 2026-05-12 Contingent — NORTHSTARMLS as Distributed by MLS Grid
- 2026-05-10 Price Changed $399,900 NORTHSTARMLS as Distributed by MLS Grid
- 2026-05-08 Listed $424,900 NORTHSTARMLS as Distributed by MLS Grid
- 2026-04-23 Coming Soon $424,900 NORTHSTARMLS as Distributed by MLS Grid
- 1973-04-01 Sold (Public Records) $40,000 Public Records
Property tax history
+3.3%/yrLatest (2025): $4,391 · +1.1% YoY. Source: county tax records.
Cash-flow waterfall
monthlySold comps — $/sqft
last 12 mo · ≤1 miLoading sold comps…