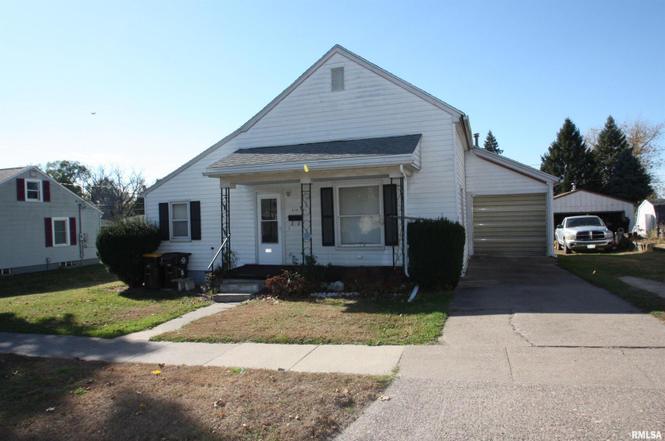
310 N Dearborn St · Maquoketa, IA
Flood risk 1/10 · Minimal
- FEMA flood zone
- X (unshaded)
- Chance of flooding over 30 yrs
- 0.0%
- Est. flood insurance / yr
- $473 – $860
Fire risk 4/10 · Minor
- Est. fire insurance / yr
- $902 – $1,676
Heat risk 3/10 · Minor
- Hot days now (above 103°F)
- 7 days/yr
- Hot days in 30 yrs
- 15 days/yr
Wind risk 2/10 · Minimal
- Chance of severe wind over 30 yrs
- —
Air-quality risk 2/10 · Minimal
- Unhealthy air days now
- 2 days/yr
- Unhealthy air days in 30 yrs
- 2 days/yr
Risk factors via First Street. Map © Google.
Why this score? — see what drove the D grade
The composite is a weighted blend of 9 inputs, each scored 0–100. Each bar is that input's sub-score; the figure is the points it added to the 100-point composite (weight × sub-score).
- Cash flow +15.4/30.0
- ARV discount +7.7/15.0
- DSCR +4.7/10.0
- Schools +4.6/10.0
- Livability +3.5/5.0
- 1% rule +3.0/10.0
- Rent growth +2.5/5.0
- Condition / age +2.5/5.0
- Appreciation +0.0/10.0
$108,000
🖨 Deal sheet (PDF) 📄 Offer letter ✓ Due diligence
Listing remarks
Looking for garage with a side of house? This is it! Attached 1 car garage plus an oversized 2 car detached gives you lots of room for work, play and storage. All main floor living, with possibility for a half story to increase living space. Seller reports unfinished basement is dry and provides space for mechanicals and storage. With some love and personalization this this cozy house with good bones could be a great home for its new owner. Updates: New water heater July 2025 & Roof 2009
Key facts
- 7,405 sq ft lot
- 3 garage spots
- Built 1910
Neighborhood map
What this means for you Summary
Snapshot
- This is a 1-bed/1.0-bath single-family listed at $108k.
Deal economics
- At list price, monthly cash flow is $41 ($490/yr) — positive.
- The deal already cash-flows at list — no discount required.
- To meet the 1% rule (rent ≥ 1% of price), the offer needs to be $86k (20.0% below list).
- Recommended offer: $86k (20.0% below list) — sets the bar for 1% rule.
Location & tenants
- Location reads 70/100 on livability (#362 in IA) — a middle-class / working-renter tenant base. Strengths: cost of living A+, housing A+, health & safety A+; Watch: amenities F, commute F, employment D-.
- Maquoketa Community School District (town): math 52% / reading 57% proficiency, ranked #270 of 289 in IA (top 93%) — acceptable for families but not a draw, mixed tenant base, ~2y average lease.
- Zoned schools: Cardinal Elementary School (271 students, 58% FRL); Maquoketa Middle School (math 46% / reading 55%, grade C, #214 of 246 statewide, top 87%, 315 students, 53% FRL); Maquoketa Community High School (math 63% / reading 68%, grade B, #204 of 336 statewide, top 61%, 498 students, 48% FRL) — zoned schools at 53% FRL track the district average.
- Market conditions: 35 active listings in the ZIP; 20 units permitted in Jackson County in 2024 (0 in 5+ unit buildings).
Forward outlook
- Local home prices are declining (-3.0%/yr); year-one equity from $747 of loan paydown is wiped out by about $3k of value loss. Plan a longer hold.
- Jackson County population projected at -15% by 2050 — secular population decline; favor cash flow + early exit over multi-decade hold.
Negotiation context
- Only 0 days on market — expect competitive offers; lowballing is unlikely to land.
- 3 sale attempts since 24y ago with the ask held roughly flat each time — persistent listings suggest the price (not the market) is what's stuck; bring a comps-based counter.
Risks & watch-outs
- Watch-outs: built in 1910 — expect roof / HVAC / electrical / plumbing capex.
Questions for the listing agent
- Built in 1910 — when were the roof, HVAC, electrical panel, plumbing, and water heater last replaced?
- Is there a deadline driving the sale (1031 exchange, divorce, estate, relocation)? That informs how much negotiation room exists.
- Schools are B-rated — typically a magnet for longer-tenancy family renters. What's the average tenant stay here, and is there a school-zone premium baked into asking?
- The area grade is low — what's the realistic commute time and amenity access for the typical tenant pool here? Any planned neighborhood developments (good or bad) we should know about?
- What's the average days-on-market for RENTAL listings here right now (not sales)? A rising rental-DOM trend means longer vacancies and softer asking-rent achievability than the comps imply.
- What's the recent tenant-quality profile in this submarket — average credit score on applications, eviction rate, late-payment / NSF rate, and stable-employment percentage? A property-management company in the area should have these aggregated.
- How much new for-sale + rental construction is in the pipeline within 1–3 miles? Heavy new supply typically softens prices + rents 12–24 months out; constrained supply supports both.
Investment metrics
- 1% rule
- 0.80% ✗
- Cap rate
- 6.75%
- Cash-on-cash
- 1.62%
- DSCR
- 1.07
- GRM
- 10.4
CMA / ARV
- ARV (on-the-fly)
- $108,414
- Comps found
- 5
Show comp detail 5 sales within ~0.75 mi
| Address | Dist | Beds/Ba | Sqft | Sold | Price | $/sf | Match |
|---|---|---|---|---|---|---|---|
| 310 N Dearborn St | 0.00mi | 1/1.0 | 951 (0%) | 5mo | $108,000 | $114 | 96 |
| 312 N Eliza St | 0.24mi | 2/1.0 (+1) | 960 (+1%) | 9mo | $145,000 | $151 | 74 |
| 109 N Dearborn St | 0.22mi | 2/1.0 (+1) | 988 (+4%) | 8mo | $95,000 | $96 | 72 |
| 406 Cynthia Dr | 0.19mi | 2/1.0 (+1) | 992 (+4%) | 10mo | $106,000 | $107 | 70 |
| 316 N Dearborn St | 0.03mi | 2/1.0 (+1) | 1,056 (+11%) | 14mo | $130,000 | $123 | 64 |
Match score weights: distance 35% · size 25% · config 20% · recency 20%. Top-matched comps best support the ARV.
Projected returns pro-forma
-3.0% appreciation · 3.0% rent growth · sell at horizon
- IRR
- -13.8%
- Equity multiple
- 0.51×
- Total profit
- $-14,951
- Equity at exit
- $16,103
- IRR
- -5.0%
- Equity multiple
- 0.67×
- Total profit
- $-9,877
- Equity at exit
- $9,338
Cash invested: $30,240 (down + closing). Projections, not guarantees.
Landlord ↔ Tenant lean methodology
- Overall (STATE)
- 83 Strongly Landlord-Friendly
- State Iowa
- 83 Strongly Landlord-Friendly · R+6
- County
- — inherits STATE
- City
- — inherits STATE
ZIP-level market 52060
- Home prices YoY
- -21.2%
- Active inventory
- 35
- Price-to-rent
- 10.4×
Monthly cashflow live
- Estimated rent
- $864 medium interval (Pro) →
- Mortgage (P&I)
- −$566
- Tax from tax record
- −$31 /mo · $368/yr
- Insurance
- −$45
- HOA
- −$0
- Vacancy / Maint / Mgmt
- −$182
- Net cashflow
- $41
Break-even live
Sensitivity live
| Price | -10% $102 | -5% $71 | +0% $41 | +5% $10 | +10% $-20 |
|---|---|---|---|---|---|
| Rent | -10% $-27 | -5% $7 | +0% $41 | +5% $75 | +10% $109 |
| Rate | -1.0pp $95 | -0.5pp $68 | base $41 | +0.5pp $13 | +1.0pp $-16 |
UW: 25.0% down · 7.5% · 30yr · 1.5% tax · 5.0% vac · 8.0% maint · 8.0% mgmt
Financing live
Cash to close
- Down payment
- $27,000
- Closing costs
- $3,240
- Reserves months
- —
- Total cash needed
- —
Loan-product check · same deal, 3 products live
Conventional
25% down · 7.5% · 30yr
- Down + closing
- —
- Monthly P&I
- —
- Monthly cashflow
- —
- DSCR
- —
- Eligible?
- —
Personal DTI + credit; lowest rate.
DSCR
20% down · 8.5% · 30yr
- Down + closing
- —
- Monthly P&I
- —
- Monthly cashflow
- —
- DSCR
- —
- Eligible?
- —
No personal income docs; deal must DSCR.
Hard money
10% down · 12.0% · 12mo
- Down + closing
- —
- Monthly P&I
- —
- Monthly cashflow
- —
- DSCR
- —
- Eligible?
- —
Short-term bridge; refi at stabilization.
Listing history 19 events
-
2026-05-24status Pending
-
2026-05-24status Pending
-
2026-05-22status Pending
-
2026-01-30soldstatus $108,000
-
2026-01-28soldstatus $108,000 Closed
-
2026-01-28soldstatus $108,000 Closed
-
2026-01-28soldstatus $108,000 Closed
-
2026-01-28soldstatus $108,000 Closed
-
2026-01-08status Pending
-
2026-01-07historical
-
2026-01-06status Pending
-
2026-01-05historical
-
2025-11-13status Pending
-
2025-11-12historical
-
2025-11-12historical
-
2025-10-28$108,000
-
2025-10-28Active
-
2003-12-22soldstatus $40,000
-
2002-12-28$42,000
ⓘ Source: listings_history table (triggers on properties + properties_extension) + one-shot
backfill from property_details.listing_events for pre-trigger history.
Tax reassessment forecast IA · Partial reset (capped growth)
- Current annual tax
- $368 · $31/mo
- Projected year-2 tax
- $1,032 · $86/mo
- Expected delta
- +$664/yr (+$55/mo · 180.4%)
ⓘ Screening estimate from a state-policy table — verify with the county assessor before closing.
Climate risk First Street
- Flood 1/10 Low FEMA zone X (unshaded) · 0% chance over 30 yrs
- Wildfire 4/10 Moderate
- Heat 3/10 Moderate 7 d/yr ≥103°F today · 15 d/yr by 30 yrs out
- Wind 2/10 Low
- Air quality 2/10 Low 2 unhealthy d/yr today · 2 by 30 yrs out
Nearby sold comps map
Loading sold comps map…
Walkable amenities ~0.75 mi
Loading nearby amenities…
Taxation est. · year 1
- Rental income
- $10,373
- − Mortgage interest
- −$6,050
- − Property taxes
- −$368
- − Insurance
- −$540
- − Repairs & maintenance
- −$830
- − Management
- −$830
- − Depreciation
- −$3,142
- Taxable loss
- −$1,386
- Est. tax savings @ 24.0%
- +$333
- After-tax cash flow
- $823/yr
For passive investors: Depreciation is non-cash, so a rental often shows a tax loss while cash-flowing — sheltering income. Rental losses are passive: they offset passive income freely, and up to $25,000/yr can offset ordinary (W-2) income if you actively participate and your MAGI is under $100k (phasing out to $0 by $150k); unused losses carry forward. On sale, claimed depreciation is recaptured at up to 25%, and gains may owe capital-gains tax (a 1031 exchange can defer both). Figures are a year-1 estimate at your 24.0% rate — not tax advice; consult a CPA.
Schools (NCES district)
- District
- Maquoketa Community School District
- NCES district ID
- 1918510
- Math proficiency
- 52% ▼ -9.00%
- Reading proficiency
- 57% ▼ -5.00%
- Median HH income
- $39,880
- Composite
- 45.54/100
- National rank
- #2602
- State rank
- #270 of 289 in IA
Livability — Maquoketa
- Score
- 70/100
- State rank
- #362
- US rank
- #7540
Category grades
Schools grade is shown separately in the Schools card above.
Census & demographics
- Census place
- Maquoketa, IA
- Population (ZIP)
- 8,139
Population outlook (Jackson County) Hauer SSP2
- Today (2025)
- 18,736 people
- By 2030
- 18,227 · -2.7%
- By 2040
- 17,049 · -9.0%
- By 2050
- 15,848 · -15.4%
- By 2075
- 13,660 · -27.1%
- By 2100
- 11,167 · -40.4%
Race, ethnicity, and origin ACS 2023
- Neighborhood character
- Predominantly White (95%)
- Race & ethnicity
- White 95% Two or more races 2% Black 2%
- Common ancestry
- Romanian 2% Slovak 2% Portuguese 2%
- Foreign-born
- 1%
- Languages at home
- 97% English-only · German/W. Germanic 1% Spanish 1%
Political lean MEDSL · Jackson
- 2024 margin
- Solid R (+32.5) · D 33.1% · R 65.6% · Other 1.3%
- 2008→2024 swing
- -56.9pp toward R · 2008: 24.4pp · 2024: -32.5pp
- All cycles
- 2024: R+32.5 2020: R+26.1 2016: R+19.4 2012: D+16.8 2008: D+24.4
Not yet ingested
- Civics
- —
Market trends
- HPI YoY
- ▼ -57.28%
- Current HPI
- 213.2315
- Rent YoY
- —
- Metro
- —
- State GDP YoY
- ▲ 2.48%
- F500 in state
- 4
Industry mix (Fortune 500 HQ in IA)
| Industry | F500 HQs | Revenue |
|---|---|---|
| Financial Services | 1 | $16B |
|
||
| Retail / Convenience | 1 | $15B |
|
||
Price history
+157.1% since first listed19 events — show timeline
- 2026-05-24 Pending — MRED as Distributed by MLS Grid
- 2026-05-24 Pending — MRED as Distributed by MLS Grid
- 2026-05-22 Pending — MRED as Distributed by MLS Grid
- 2026-01-30 Sold (Public Records) $108,000 Public Records
- 2026-01-28 Sold (MLS) $108,000 MRED as Distributed by MLS Grid
- 2026-01-28 Sold (MLS) $108,000 MRED as Distributed by MLS Grid
- 2026-01-28 Sold (MLS) $108,000 MRED as Distributed by MLS Grid
- 2026-01-28 Sold (MLS) $108,000 MRED as Distributed by MLS Grid
- 2026-01-08 Pending — MRED as Distributed by MLS Grid
- 2026-01-07 Listing Removed — MRED as Distributed by MLS Grid
- 2026-01-06 Pending — MRED as Distributed by MLS Grid
- 2026-01-05 Listing Removed — MRED as Distributed by MLS Grid
- 2025-11-13 Pending — RMLSA as Distributed by MLS Grid
- 2025-11-12 Listing Removed — RMLSA as Distributed by MLS Grid
- 2025-11-12 Listing Removed — MRED as Distributed by MLS Grid
- 2025-10-28 Listed — RMLSA as Distributed by MLS Grid
- 2025-10-28 Listed $108,000 MRED as Distributed by MLS Grid
- 2003-12-22 Sold (MLS) $40,000 RMLSA as Distributed by MLS Grid
- 2002-12-28 Listed $42,000 RMLSA as Distributed by MLS Grid
Property tax history
+0.7%/yrLatest (2025): $368 · -18.2% YoY. Source: county tax records.
Cash-flow waterfall
monthlySold comps — $/sqft
last 12 mo · ≤1 miLoading sold comps…