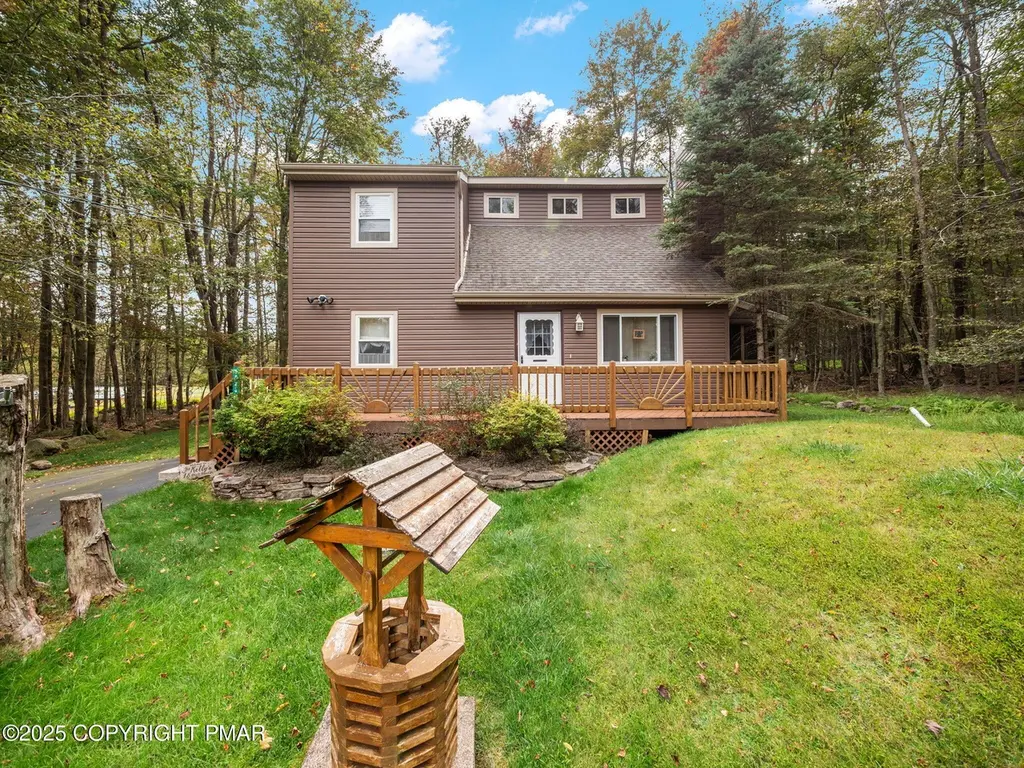
1025 Maplewood Dr · Sterling, PA
Flood risk 1/10 · Minimal
- FEMA flood zone
- X (unshaded)
- Chance of flooding over 30 yrs
- 0.0%
- Est. flood insurance / yr
- $507 – $1,088
Fire risk 1/10 · Minimal
- Est. fire insurance / yr
- $511 – $949
Heat risk 1/10 · Minimal
- Hot days now (above 88°F)
- 7 days/yr
- Hot days in 30 yrs
- 16 days/yr
Wind risk 3/10 · Minor
- Chance of severe wind over 30 yrs
- 5.0%
Air-quality risk 2/10 · Minimal
- Unhealthy air days now
- 1 days/yr
- Unhealthy air days in 30 yrs
- 2 days/yr
Risk factors via First Street. Map © Google.
Why this score? — see what drove the D grade
The composite is a weighted blend of 9 inputs, each scored 0–100. Each bar is that input's sub-score; the figure is the points it added to the 100-point composite (weight × sub-score).
- Cash flow +13.9/30.0
- Appreciation +6.5/10.0
- Schools +4.4/10.0
- DSCR +4.2/10.0
- 1% rule +3.9/10.0
- Rent growth +2.5/5.0
- Livability +2.5/5.0
- Condition / age +2.5/5.0
- ARV discount +0.0/15.0
$289,900
🖨 Deal sheet (PDF) 📄 Offer letter ✓ Due diligence
Listing remarks
Beautiful home in gorgeous Pocono Spring Estates, simply overflowing with amenities. Perfect for full time living or that amazing vacation home you've always wanted. This home has been lovingly cared for, lived in, and impeccably maintained by the original owner. Treat yourself to this amazing 3BR, 2BA home with pristine hardwood flooring in the first floor living areas. Step from your eating area to either a screen porch or the multi level deck with a bump out for your grill! Both exits via their own sliding glass doors. Well appointed kitchen features granite countertops, glass front cabinets, lazy Susan, hw floors, and all appliances plus separate dining space. Spacious living room wit
Key facts
- 0.45 acre lot
- 4 parking spots
- Community pool
Property features AI
Finance
- Other: Lot approximately 0.45 acres; Private maintained paved road
- HOA & community: Homeowners association with annual fee ($1,595); Association amenities: security, gated community, clubhouse, playground, tennis courts, basketball court, pool; Association fee covers trash, security, and grounds maintenance
Exterior
- Parking: Open parking (4 spaces); Driveway; Paved parking area
- Security: Security gate
- Utilities: Well water; Septic tank; 200+ amp electric service; Cable available
- Home design: Single-family house; Residential property; No common walls; Zoned residential; Wood-vinyl siding exterior
- Construction: Vinyl siding construction; Asphalt roof; Built as a house
- Exterior features: Front porch; Side porch; Deck; Screened porch; Sliding doors; Shed(s)
Interior
- Kitchen: Range / Electric range; Refrigerator; Dishwasher
- Bedrooms: Total rooms: 8
- Flooring: Carpet; Tile; Wood
- Bathrooms: 2 full bathrooms
- Heating & cooling: Baseboard heating; Electric heating; Fireplace heating; Ceiling fan cooling
- Interior features: Granite counters; Ceiling fans; Double pane windows; Unfurnished; Living room wood-burning stone fireplace (1 total); Crawl space basement
- Laundry & utility: Washer; Dryer
Neighborhood map
What this means for you Summary
Snapshot
- This is a 3-bed/2.0-bath single-family listed at $290k.
Deal economics
- At list price, monthly cash flow is $30 ($359/yr) — positive.
- The deal already cash-flows at list — no discount required.
- To meet the 1% rule (rent ≥ 1% of price), the offer needs to be $258k (11.2% below list).
- Recommended offer: $258k (11.2% below list) — sets the bar for 1% rule.
Location & tenants
- Location reads: area grade D — affects rentability + tenant quality, not the cash-flow math above.
- Western Wayne SD (rural): math 39% / reading 63% proficiency, ranked #165 of 539 in PA (top 31%) — acceptable for families but not a draw, mixed tenant base, ~2y average lease.
- Zoned schools: Evergreen El Sch (math 42% / reading 68%, grade C, #498 of 1,518 statewide, top 33%, 506 students, 64% FRL); Western Wayne Ms (math 21% / reading 61%, grade F, #243 of 512 statewide, top 48%, 411 students, 57% FRL); Western Wayne Hs (math 77% / reading 24%, grade D+, #125 of 437 statewide, top 30%, 545 students, 49% FRL) — zoned schools average 56% FRL vs 41% district-wide (16 pts higher); higher-poverty schools than district average — tighter screening recommended.
- Market conditions: 84 active listings in the ZIP; 1 comparable units currently listed for rent nearby; 177 units permitted in Wayne County in 2024 (0 in 5+ unit buildings).
Forward outlook
- In year one you build about $11k of equity ($2k loan paydown + $9k appreciation (3.0% local appreciation)).
- Wayne County population projected at -17% by 2050 — secular population decline; favor cash flow + early exit over multi-decade hold.
- At projected returns (3.0% appreciation + 3.0% rent growth), your $81k cash investment doubles in ~6 years — after that, you're playing with house money.
- By year 4, paydown + projected appreciation supports a ~$36k cash-out refi (75% LTV) — recoverable capital for the next deal without selling this one.
Negotiation context
- It's been on market 46 days — a 3% lower offer ($281k) is reasonable based on typical stale-listing flexibility.
- 2 sale attempts with the ask held roughly flat each time — persistent listings suggest the price (not the market) is what's stuck; bring a comps-based counter.
- Current owner paid $26k; list at $290k implies a 1015% gain — meaningful room to come down on a strong offer.
Questions for the listing agent
- It's been on market 46 days. Have you received any prior offers? Is the seller open to a 11% concession, seller financing, or rate buy-down credit?
- What does the HOA fee cover, when was the last increase, and are there any pending special assessments or reserve-fund shortfalls?
- Is there a deadline driving the sale (1031 exchange, divorce, estate, relocation)? That informs how much negotiation room exists.
- The area grade is low — what's the realistic commute time and amenity access for the typical tenant pool here? Any planned neighborhood developments (good or bad) we should know about?
- What's the average days-on-market for RENTAL listings here right now (not sales)? A rising rental-DOM trend means longer vacancies and softer asking-rent achievability than the comps imply.
- What's the recent tenant-quality profile in this submarket — average credit score on applications, eviction rate, late-payment / NSF rate, and stable-employment percentage? A property-management company in the area should have these aggregated.
- How much new for-sale + rental construction is in the pipeline within 1–3 miles? Heavy new supply typically softens prices + rents 12–24 months out; constrained supply supports both.
Investment metrics
- 1% rule
- 0.89% ✗
- Cap rate
- 6.42%
- Cash-on-cash
- 0.44%
- DSCR
- 1.02
- GRM
- 9.4
CMA / ARV
- ARV (median comp)
- $227,941
- List price
- $289,900
- Delta
- 27.18%
- Verdict
- OVERPRICED
- Comps
- 20 within 1.0 mi
Show comp detail 3 sales within ~0.75 mi
| Address | Dist | Beds/Ba | Sqft | Sold | Price | $/sf | Match |
|---|---|---|---|---|---|---|---|
| 1024 Pitt Rd | 0.19mi | 3/2.0 | 1,282 (-3%) | 11mo | $220,700 | $172 | 78 |
| 1001 Chesnut Dr | 0.18mi | 3/2.0 | 1,200 (-9%) | 13mo | $225,000 | $188 | 65 |
| 1003 Teakwood Dr | 0.43mi | 4/2.0 (+1) | 1,440 (+9%) | 8mo | $279,900 | $194 | 53 |
Match score weights: distance 35% · size 25% · config 20% · recency 20%. Top-matched comps best support the ARV.
Projected returns pro-forma
2.99% appreciation · 3.0% rent growth · sell at horizon
- IRR
- 7.9%
- Equity multiple
- 1.45×
- Total profit
- $36,681
- Equity at exit
- $130,156
- IRR
- 10.5%
- Equity multiple
- 2.58×
- Total profit
- $128,242
- Equity at exit
- $200,434
Cash invested: $81,172 (down + closing). Projections, not guarantees.
Landlord ↔ Tenant lean methodology
- Overall (STATE)
- 62 Landlord-Friendly
- State Pennsylvania
- 62 Landlord-Friendly · EVEN
- County
- — inherits STATE
- City
- — inherits STATE
ZIP-level market 18445
- Home prices YoY
- 0.9%
- Active inventory
- 84
- Price-to-rent
- 9.4×
Monthly cashflow live
- Estimated rent
- $2,575 medium interval (Pro) →
- Mortgage (P&I)
- −$1,520
- Tax from tax record
- −$230 /mo · $2,764/yr
- Insurance
- −$121
- HOA
- −$133
- Vacancy / Maint / Mgmt
- −$541
- Net cashflow
- $30
Break-even live
Sensitivity live
| Price | -10% $194 | -5% $112 | +0% $30 | +5% $-52 | +10% $-134 |
|---|---|---|---|---|---|
| Rent | -10% $-174 | -5% $-72 | +0% $30 | +5% $132 | +10% $233 |
| Rate | -1.0pp $176 | -0.5pp $104 | base $30 | +0.5pp $-45 | +1.0pp $-122 |
UW: 25.0% down · 7.5% · 30yr · 1.5% tax · 5.0% vac · 8.0% maint · 8.0% mgmt
Financing live
Cash to close
- Down payment
- $72,475
- Closing costs
- $8,697
- Reserves months
- —
- Total cash needed
- —
Loan-product check · same deal, 3 products live
Conventional
25% down · 7.5% · 30yr
- Down + closing
- —
- Monthly P&I
- —
- Monthly cashflow
- —
- DSCR
- —
- Eligible?
- —
Personal DTI + credit; lowest rate.
DSCR
20% down · 8.5% · 30yr
- Down + closing
- —
- Monthly P&I
- —
- Monthly cashflow
- —
- DSCR
- —
- Eligible?
- —
No personal income docs; deal must DSCR.
Hard money
10% down · 12.0% · 12mo
- Down + closing
- —
- Monthly P&I
- —
- Monthly cashflow
- —
- DSCR
- —
- Eligible?
- —
Short-term bridge; refi at stabilization.
Rent comps 1 comps
| Address | Beds | Baths | Sqft | Rent | $/sqft | DOM | Units | Dist |
|---|---|---|---|---|---|---|---|---|
| 1121 Cobblewood Rd Newfoundland, PA | 4.0 | 2.0 | 1469 | $2,575 | $1.75 | 9d | 1 | 0.23mi |
HOA detail
- Monthly dues
- $133 · $1,596/yr
Listing history 19 events
-
2026-06-21days on market $289,900 Active 46 DOM
-
2026-06-18days on market $289,900 Active 43 DOM
-
2026-06-17days on market $289,900 Active 42 DOM
-
2026-06-16days on market $289,900 Active 41 DOM
-
2026-06-15days on market $289,900 Active 40 DOM
-
2026-06-14days on market $289,900 Active 38 DOM
-
2026-06-13days on market $289,900 Active 37 DOM
-
2026-06-10days on market $289,900 Active 35 DOM
-
2026-06-09days on market $289,900 Active 34 DOM
-
2026-06-08days on market $289,900 Active 33 DOM
-
2026-06-07days on market $289,900 Active 32 DOM
-
2026-06-03days on market $289,900 Active 28 DOM
-
2026-06-02days on market $289,900 Active 27 DOM
-
2026-06-01days on market $289,900 Active 26 DOM
-
2026-05-31days on market $289,900 Active 25 DOM
-
2026-05-30days on market $289,900 Active 24 DOM
-
2026-05-06$289,900 Active 1468-char remark
-
2025-09-18$289,900 Active
-
1990-01-04soldstatus $26,000
ⓘ Source: listings_history table (triggers on properties + properties_extension) + one-shot
backfill from property_details.listing_events for pre-trigger history.
Tax reassessment forecast PA · Partial reset (capped growth)
- Current annual tax
- $2,764 · $230/mo
- Projected year-2 tax
- $3,672 · $306/mo
- Expected delta
- +$908/yr (+$76/mo · 32.9%)
ⓘ Screening estimate from a state-policy table — verify with the county assessor before closing.
Climate risk First Street
- Flood 1/10 Low FEMA zone X (unshaded) · 0% chance over 30 yrs
- Wildfire 1/10 Low
- Heat 1/10 Low 7 d/yr ≥88°F today · 16 d/yr by 30 yrs out
- Wind 3/10 Moderate 5% chance of damaging wind over 30 yrs
- Air quality 2/10 Low 1 unhealthy d/yr today · 2 by 30 yrs out
Nearby sold comps map
Loading sold comps map…
Walkable amenities ~0.75 mi
Loading nearby amenities…
Taxation est. · year 1
- Rental income
- $30,900
- − Mortgage interest
- −$16,239
- − Property taxes
- −$2,764
- − Insurance
- −$1,450
- − Repairs & maintenance
- −$2,472
- − Management
- −$2,472
- − HOA
- −$1,596
- − Depreciation
- −$8,433
- Taxable loss
- −$4,526
- Est. tax savings @ 24.0%
- +$1,086
- After-tax cash flow
- $1,445/yr
For passive investors: Depreciation is non-cash, so a rental often shows a tax loss while cash-flowing — sheltering income. Rental losses are passive: they offset passive income freely, and up to $25,000/yr can offset ordinary (W-2) income if you actively participate and your MAGI is under $100k (phasing out to $0 by $150k); unused losses carry forward. On sale, claimed depreciation is recaptured at up to 25%, and gains may owe capital-gains tax (a 1031 exchange can defer both). Figures are a year-1 estimate at your 24.0% rate — not tax advice; consult a CPA.
Schools (NCES district)
- District
- Western Wayne SD
- NCES district ID
- 4226070
- Math proficiency
- 39% ▼ -12.00%
- Reading proficiency
- 63% ▼ -6.00%
- Median HH income
- $51,358
- Composite
- 43.65/100
- National rank
- #2964
- State rank
- #165 of 539 in PA
Livability — Sterling
No livability data for this city. (Only ~50 U.S. cities are tracked.)
Census & demographics
- Census place
- Pocono Springs, PA
- Population (ZIP)
- 2,488
Population outlook (Wayne County) Hauer SSP2
- Today (2025)
- 47,924 people
- By 2030
- 46,191 · -3.6%
- By 2040
- 42,815 · -10.7%
- By 2050
- 39,873 · -16.8%
- By 2075
- 34,556 · -27.9%
- By 2100
- 28,358 · -40.8%
Race, ethnicity, and origin ACS 2023
- Neighborhood character
- Predominantly White (77%)
- Race & ethnicity
- White 77% Hispanic / Latino 13% Two or more races 9% Asian 5%
- Hispanic origin (detail)
- Mexican 4% Puerto Rican 5% Cuban 1% Dominican 2%
- Common ancestry
- Romanian 8% Iranian 2% Estonian 1%
- Foreign-born
- 7% · Canada
- Languages at home
- 84% English-only · Spanish 8% Other Asian/Pacific 3% Other Indo-European 2%
Political lean MEDSL · Wayne
- 2024 margin
- Solid R (+37.1) · D 31.1% · R 68.2%
- 2008→2024 swing
- -24.8pp toward R · 2008: -12.3pp · 2024: -37.1pp
- All cycles
- 2024: R+37.1 2020: R+33.6 2016: R+39.7 2012: R+20.9 2008: R+12.3
Not yet ingested
- Civics
- —
Market trends
- HPI YoY
- ▲ 2.99%
- Current HPI
- 349.2006
- Rent YoY
- —
- Metro
- —
- State GDP YoY
- ▲ 1.68%
- F500 in state
- 34
Industry mix (Fortune 500 HQ in PA)
| Industry | F500 HQs | Revenue |
|---|---|---|
| Healthcare | 2 | $309B |
|
||
| Insurance | 2 | $27B |
|
||
| Telecommunications / Media | 1 | $124B |
|
||
| Industrial Distribution | 1 | $22B |
|
||
| Financial Services | 1 | $20B |
|
||
| Chemicals / Materials | 1 | $18B |
|
||
Price history
+1015.0% since first listed3 events — show timeline
- 2026-05-06 Listed $289,900 PMAR
- 2025-09-18 Listed $289,900 PMAR
- 1990-01-04 Sold (Public Records) $26,000 Public Records
Property tax history
+3.4%/yrLatest (2026): $2,764 · +3.0% YoY. Source: county tax records.
Cash-flow waterfall
monthlySold comps — $/sqft
last 12 mo · ≤1 miLoading sold comps…