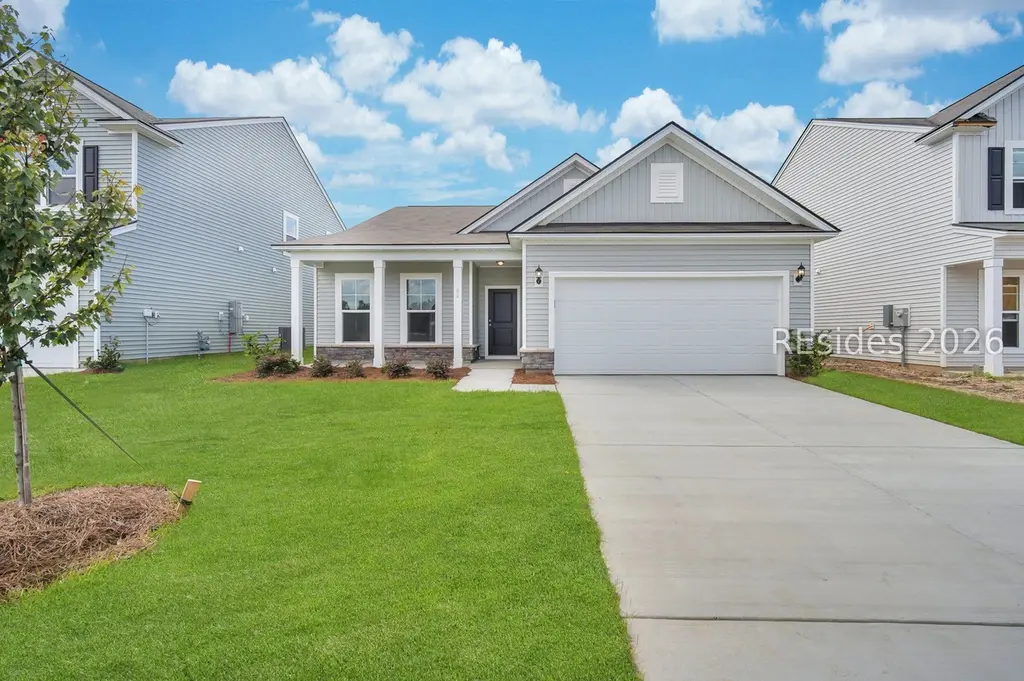
82 Hillcrest Way · Hardeeville, SC
Flood risk No data
- FEMA flood zone
- —
- Chance of flooding over 30 yrs
- —
- Est. flood insurance / yr
- —
Fire risk No data
- Est. fire insurance / yr
- —
Heat risk No data
- Hot days now (above threshold)
- —
- Hot days in 30 yrs
- —
Wind risk No data
- Chance of severe wind over 30 yrs
- —
Air-quality risk No data
- Unhealthy air days now
- —
- Unhealthy air days in 30 yrs
- —
Risk factors via First Street. Map © Google.
Why this score? — see what drove the D- grade
The composite is a weighted blend of 9 inputs, each scored 0–100. Each bar is that input's sub-score; the figure is the points it added to the 100-point composite (weight × sub-score).
- Cash flow +10.3/30.0
- ARV discount +8.9/15.0
- Rent growth +4.8/5.0
- Schools +4.1/10.0
- Livability +3.2/5.0
- DSCR +3.0/10.0
- 1% rule +2.8/10.0
- Condition / age +2.5/5.0
- Appreciation +0.0/10.0
$419,999
🖨 Deal sheet 📄 Offer letter ✓ Due diligence
Listing remarks
Extraordіnarу Lаgοon Viewѕ & Εxceptional Upgradeѕ іn a Premier Gated Community! Welcome home to this pristine, single-level Compton model, where effortless Lowcountry living meets modern elegance. Boasting 4 spacious bedrooms, 3 full baths, and a dedicated storage room, this turnkey residence is loaded with premium upgrades. Inside, you'll find gorgeous luxury vinyl plank (LVP) flooring, tile, stunning countertops, a gourmet cabinet package, stainless steel appliances complete with a gas range. Ample closet space ensures a place for everything. Unwind or entertain on your upgraded front porch, then step out to experience some of the finest resort-style amenities in the
Key facts
- Gated community
- Lagoon views
- Exceptional upgrades
Tags
Property features AI
Finance
- HOA & community: Community pool; Pickleball; Gated/guard; Association amenities include pool and pickleball
Exterior
- Parking: 2-car garage; Garage
- Utilities: Public water
- Home design: Single-story; Faces east
- Construction: Stone and vinyl siding exterior; Asphalt roof
- Exterior features: Front porch; Patio; Sprinkler/irrigation; Community pool
Interior
- Kitchen: Eat-in kitchen; Gas range; Microwave; Self-cleaning oven; Refrigerator; Dishwasher
- Bedrooms: Primary bedroom on main level
- Flooring: Ceramic tile; Luxury vinyl; Luxury vinyl plank
- Bathrooms: 3 full bathrooms
- Heating & cooling: Electric heat pump; Central electric air conditioning
- Interior features: Attic; Main level primary bedroom; Multiple closets; Smooth ceilings; Eat-in kitchen
- Laundry & utility: Washer; Dryer; Utility room; Laundry room; Storage room
Neighborhood map
What this means for you Summary
Snapshot
- This is a 4-bed/3.0-bath single-family listed at $420k.
Deal economics
- At list price, monthly cash flow is $-227 ($-3k/yr) — negative.
- To cash-flow at today's rent, offer at most $380k (9.6% below list).
- To meet the 1% rule (rent ≥ 1% of price), the offer needs to be $329k (21.5% below list).
- Recommended offer: $329k (21.5% below list) — sets the bar for 1% rule.
- Cap rate 5.6% vs local median 3.6% in Hardeeville — top-decile yield for the area; either an underpriced asset or a hidden risk that comps aren't pricing in. Stress-test before assuming the spread holds.
Location & tenants
- Location reads 65/100 on livability (#136 in SC) — a middle-class / working-renter tenant base. Strengths: health & safety A+, crime B+, housing B+; Watch: schools F, amenities F, commute F.
- Beaufort 01 (town): math 42% / reading 51% proficiency, ranked #17 of 80 in SC (top 21%) — families likely to look elsewhere, expect single-tenant / working-renter base with shorter leases.
- Market conditions: Rents rising fast (+9.3%/yr); 650 active listings in the ZIP; 2 comparable units currently listed for rent nearby; solid renter incomes; 1,824 units permitted in Beaufort County in 2024 (618 in 5+ unit buildings).
- This rent runs 43% of the median local income ($91k/yr) — at the standard rent-burdened threshold; future hikes will face affordability resistance.
Forward outlook
- Local home prices are declining (-3.0%/yr); year-one equity from $3k of loan paydown is wiped out by about $13k of value loss. Plan a longer hold.
- Beaufort County population projected at +30% by 2050 — long-run rental-demand tailwind backs the buy-and-hold thesis.
Negotiation context
- It's been on market 28 days — a 2% lower offer ($414k) is reasonable based on typical stale-listing flexibility.
- 8 sale attempts since 5y ago; this cycle's ask has dropped $25k (6%) from the opening price — seller is motivated, your offer sets the floor, not the list.
Questions for the listing agent
- What do current leases actually rent for vs. the listed asking? Can we see a recent rent roll and the last 12 months of T-12 income?
- Is there a deadline driving the sale (1031 exchange, divorce, estate, relocation)? That informs how much negotiation room exists.
- Schools are F-rated, which usually means shorter tenancies and higher turnover. Who's the typical renter profile here, and what's been the actual vacancy rate?
- The area grade is low — what's the realistic commute time and amenity access for the typical tenant pool here? Any planned neighborhood developments (good or bad) we should know about?
- What's the average days-on-market for RENTAL listings here right now (not sales)? A rising rental-DOM trend means longer vacancies and softer asking-rent achievability than the comps imply.
- What's the recent tenant-quality profile in this submarket — average credit score on applications, eviction rate, late-payment / NSF rate, and stable-employment percentage? A property-management company in the area should have these aggregated.
- How much new for-sale + rental construction is in the pipeline within 1–3 miles? Heavy new supply typically softens prices + rents 12–24 months out; constrained supply supports both.
Investment metrics
- 1% rule
- 0.78% ✗
- Cap rate
- 5.64%
- Cash-on-cash
- -2.32%
- DSCR
- 0.90
- GRM
- 10.6
CMA / ARV
- ARV (on-the-fly)
- $433,726
- Comps found
- 12
Show comp detail 12 sales within ~0.75 mi
| Address | Dist | Beds/Ba | Sqft | Sold | Price | $/sf | Match |
|---|---|---|---|---|---|---|---|
| 200 Standing Oaks Dr | 0.06mi | 4/3.5 | 1,956 (+3%) | 6mo | $399,990 | $204 | 85 |
| 162 Standing Oaks Dr | 0.24mi | 4/3.5 | 1,956 (+3%) | 7mo | $369,990 | $189 | 76 |
| 200 Standing Oaks Dr | 0.28mi | 4/3.5 | 1,956 (+3%) | 6mo | $399,990 | $204 | 75 |
| 175 Standing Oaks Dr | 0.28mi | 4/3.5 | 2,006 (+6%) | 8mo | $399,990 | $199 | 69 |
| 171 Standing Oaks Dr | 0.26mi | 4/3.0 | 1,702 (-10%) | 7mo | $399,990 | $235 | 65 |
| 163 Standing Oaks Dr | 0.23mi | 3/2.5 (-1) | 2,083 (+10%) | 8mo | $400,000 | $192 | 59 |
| 463 Danner Dr | 0.30mi | 3/2.0 (-1) | 2,094 (+11%) | 1mo | $548,000 | $262 | 58 |
| 19 Whispering Oaks Cir | 0.30mi | 3/2.5 (-1) | 1,660 (-12%) | 2mo | $400,000 | $241 | 57 |
| 155 Standing Oaks Dr | 0.22mi | 3/2.5 (-1) | 1,660 (-12%) | 8mo | $389,990 | $235 | 55 |
| 194 Standing Oaks Dr | 0.28mi | 3/2.5 (-1) | 1,660 (-12%) | 7mo | $379,990 | $229 | 54 |
| 158 Standing Oaks Dr | 0.24mi | 3/2.5 (-1) | 1,660 (-12%) | 10mo | $395,990 | $239 | 53 |
| 23 Parrot Creek Dr | 0.71mi | 3/2.5 (-1) | 1,652 (-13%) | 10mo | $369,000 | $223 | 31 |
Match score weights: distance 35% · size 25% · config 20% · recency 20%. Top-matched comps best support the ARV.
Projected returns pro-forma
-3.0% appreciation · 8.0% rent growth · sell at horizon
- IRR
- -14.8%
- Equity multiple
- 0.45×
- Total profit
- $-65,123
- Equity at exit
- $62,623
- IRR
- 0.4%
- Equity multiple
- 1.03×
- Total profit
- $3,918
- Equity at exit
- $36,314
Cash invested: $117,600 (down + closing). Projections, not guarantees.
Landlord ↔ Tenant lean methodology
- Overall (STATE)
- 90 Strongly Landlord-Friendly
- State South Carolina
- 90 Strongly Landlord-Friendly · R+6
- County
- — inherits STATE
- City
- — inherits STATE
ZIP-level market 29909
- Home prices YoY
- -12.5%
- Rents YoY
- 9.3%
- Active inventory
- 650
- Price-to-rent
- 10.6×
Monthly cashflow live
- Estimated rent
- $3,295 medium interval (Pro) →
- Mortgage (P&I)
- −$2,203
- Tax from tax record
- −$453 /mo · $5,435/yr
- Insurance
- −$175
- HOA
- −$0
- Vacancy / Maint / Mgmt
- −$692
- Net cashflow
- $-227
Break-even live
UW: 25.0% down · 7.5% · 30yr · 1.5% tax · 5.0% vac · 8.0% maint · 8.0% mgmt
Financing live
Cash to close
- Down payment
- $105,000
- Closing costs
- $12,600
- Reserves months
- —
- Total cash needed
- —
Loan-product check · same deal, 3 products live
Conventional
25% down · 7.5% · 30yr
- Down + closing
- —
- Monthly P&I
- —
- Monthly cashflow
- —
- DSCR
- —
- Eligible?
- —
Personal DTI + credit; lowest rate.
DSCR
20% down · 8.5% · 30yr
- Down + closing
- —
- Monthly P&I
- —
- Monthly cashflow
- —
- DSCR
- —
- Eligible?
- —
No personal income docs; deal must DSCR.
Hard money
10% down · 12.0% · 12mo
- Down + closing
- —
- Monthly P&I
- —
- Monthly cashflow
- —
- DSCR
- —
- Eligible?
- —
Short-term bridge; refi at stabilization.
Rent comps 2 comps
| Address | Beds | Baths | Sqft | Rent | $/sqft | DOM | Units | Dist |
|---|---|---|---|---|---|---|---|---|
| 56 Whispering Oaks Cir Okatie, SC | 3.0 | 2.5 | 1660 | $2,550 | $1.54 | 43d | 1 | 0.27mi |
| 46 Seagrass Ln Ridgeland, SC | 2.0–3.0 | 2.0 | 1210 | $1,899 | $1.57 | 13d | 6 | 1.35mi |
Listing history 47 events
-
2026-06-18days on market $419,999 Active 28 DOM
-
2026-06-18price $419,999 Active 27 DOM
-
2026-06-17days on market $429,999 Active 27 DOM
-
2026-06-16days on market $429,999 Active 26 DOM
-
2026-06-15days on market $429,999 Active 25 DOM
-
2026-06-14days on market $429,999 Active 23 DOM
-
2026-06-13days on market $429,999 Active 22 DOM
-
2026-06-10days on market $429,999 Active 20 DOM
-
2026-06-09days on market $429,999 Active 19 DOM
-
2026-06-09price $429,999 Active 18 DOM
-
2026-06-08days on market $439,000 Active 18 DOM
-
2026-06-07days on market $439,000 Active 17 DOM
-
2026-06-05days on market $439,000 Active 14 DOM
-
2026-06-03days on market $439,000 Active 13 DOM
-
2026-06-02days on market $439,000 Active 12 DOM
-
2026-06-01days on market $439,000 Active 11 DOM
-
2026-05-31days on market $439,000 Active 10 DOM
-
2026-05-30pricedays on market $439,000 Active 9 DOM
-
2026-05-21$445,000 Active
-
2026-04-07price $445,000
-
2026-04-04historical $2,950
-
2026-03-27price $449,000
-
2026-03-13price $455,000
-
2026-03-01price $462,500
-
2026-02-09price $465,000
-
2026-02-01price $475,000
-
2026-01-18price $2,950
-
2026-01-18price $479,999
-
2026-01-04$3,150
-
2026-01-01price $485,000
-
2025-12-31historical $3,350
-
2025-12-16price $3,350
-
2025-11-25price $3,450
-
2025-11-24price $487,500
-
2025-11-13price $3,500
-
2025-11-12price $489,500
-
2025-11-02$495,000 Active
-
2025-10-29$3,550
-
2024-08-06$489,999
-
2023-09-25historical $3,450
-
2023-09-18price $479,999
-
2023-09-08price $3,450
-
2023-09-05price $489,999
-
2023-09-03$3,550
-
2023-08-24price $499,999
-
2023-08-11$515,000 Active
-
2021-07-06$312,440
ⓘ Source: listings_history table (triggers on properties + properties_extension) + one-shot
backfill from property_details.listing_events for pre-trigger history.
Tax reassessment forecast SC · Resets to sale price
- Current annual tax
- $5,435 · $453/mo
- Projected year-2 tax
- $5,435 · $453/mo
- Expected delta
- $0/yr ($0/mo · 0.0%)
ⓘ Screening estimate from a state-policy table — verify with the county assessor before closing.
Nearby sold comps map
Loading sold comps map…
Walkable amenities ~0.75 mi
Loading nearby amenities…
Taxation est. · year 1
- Rental income
- $39,540
- − Mortgage interest
- −$23,526
- − Property taxes
- −$5,435
- − Insurance
- −$2,100
- − Repairs & maintenance
- −$3,163
- − Management
- −$3,163
- − Depreciation
- −$12,218
- Taxable loss
- −$10,066
- Est. tax savings @ 24.0%
- +$2,416
- After-tax cash flow
- $-313/yr
For passive investors: Depreciation is non-cash, so a rental often shows a tax loss while cash-flowing — sheltering income. Rental losses are passive: they offset passive income freely, and up to $25,000/yr can offset ordinary (W-2) income if you actively participate and your MAGI is under $100k (phasing out to $0 by $150k); unused losses carry forward. On sale, claimed depreciation is recaptured at up to 25%, and gains may owe capital-gains tax (a 1031 exchange can defer both). Figures are a year-1 estimate at your 24.0% rate — not tax advice; consult a CPA.
Schools (NCES district)
- District
- Beaufort 01
- NCES district ID
- 4501110
- Math proficiency
- 42% ▼ -8.00%
- Reading proficiency
- 51% ▲ 2.00%
- Median HH income
- $57,430
- Composite
- 40.56/100
- National rank
- #3699
- State rank
- #17 of 80 in SC
Livability — Hardeeville
- Score
- 65/100
- State rank
- #136
- US rank
- #13105
Category grades
Schools grade is shown separately in the Schools card above.
Census & demographics
- County
- Beaufort County · 163,770 people
- City population
- 11,373
- Metro
- Hilton Head Island-Bluffton, SC
- Population (ZIP)
- 24,003
- Household income
- $91,294
- Rent vs Own
- Severe rent burden
- 268.0
Population outlook (Beaufort County) Hauer SSP2
- Today (2025)
- 211,915 people
- By 2030
- 227,272 · +7.2%
- By 2040
- 253,861 · +19.8%
- By 2050
- 275,126 · +29.8%
- By 2075
- 311,022 · +46.8%
- By 2100
- 321,286 · +51.6%
Race, ethnicity, and origin ACS 2023
- Neighborhood character
- Predominantly White (89%)
- Race & ethnicity
- White 89% Black 4% Hispanic / Latino 4% Two or more races 3% Asian 1%
- Common ancestry
- Romanian 5% Lithuanian 3% Slovak 2%
- Foreign-born
- 6% · Canada, Vietnam
- Languages at home
- 94% English-only · Spanish 2% Other Indo-European 1%
Political lean MEDSL · Beaufort
- 2024 margin
- R (+14.5) · D 42.1% · R 56.6% · Other 1.2%
- 2008→2024 swing
- -3.7pp toward R · 2008: -10.8pp · 2024: -14.5pp
- All cycles
- 2024: R+14.5 2020: R+10.0 2016: R+14.3 2012: R+17.5 2008: R+10.8
Not yet ingested
- Civics
- —
Market trends
- HPI YoY
- ▼ -27.99%
- Current HPI
- 196.0491
- Rent YoY
- ▲ 9.31%
- Metro
- Hilton Head Island-Bluffton, SC
- State GDP YoY
- ▲ 4.51%
- F500 in state
- 2
Industry mix (Fortune 500 HQ in SC)
| Industry | F500 HQs | Revenue |
|---|---|---|
| Packaging | 1 | $7B |
|
||
Price history
+42.4% since first listed29 events — show timeline
- 2026-05-21 Listed $445,000 RSMLS
- 2026-04-07 Price Changed $445,000 RSMLS
- 2026-04-04 Rental Removed $2,950 Avail
- 2026-03-27 Price Changed $449,000 RSMLS
- 2026-03-13 Price Changed $455,000 RSMLS
- 2026-03-01 Price Changed $462,500 RSMLS
- 2026-02-09 Price Changed $465,000 RSMLS
- 2026-02-01 Price Changed $475,000 RSMLS
- 2026-01-18 Price Changed $2,950 Avail
- 2026-01-18 Price Changed $479,999 RSMLS
- 2026-01-04 Listed for Rent $3,150 Avail
- 2026-01-01 Price Changed $485,000 RSMLS
- 2025-12-31 Rental Removed $3,350 Avail
- 2025-12-16 Price Changed $3,350 Avail
- 2025-11-25 Price Changed $3,450 Avail
- 2025-11-24 Price Changed $487,500 RSMLS
- 2025-11-13 Price Changed $3,500 Avail
- 2025-11-12 Price Changed $489,500 RSMLS
- 2025-11-02 Listed $495,000 RSMLS
- 2025-10-29 Listed for Rent $3,550 Avail
- 2024-08-06 Listed $489,999 RSMLS
- 2023-09-25 Rental Removed $3,450 Avail
- 2023-09-18 Price Changed $479,999 RSMLS
- 2023-09-08 Price Changed $3,450 Avail
- 2023-09-05 Price Changed $489,999 RSMLS
- 2023-09-03 Listed for Rent $3,550 Avail
- 2023-08-24 Price Changed $499,999 RSMLS
- 2023-08-11 Listed $515,000 RSMLS
- 2021-07-06 Listed $312,440 RSMLS
Property tax history
+157.6%/yrLatest (2025): $5,435 · +1.7% YoY. Source: county tax records.
Cash-flow waterfall
monthlySold comps — $/sqft
last 12 mo · ≤1 miLoading sold comps…