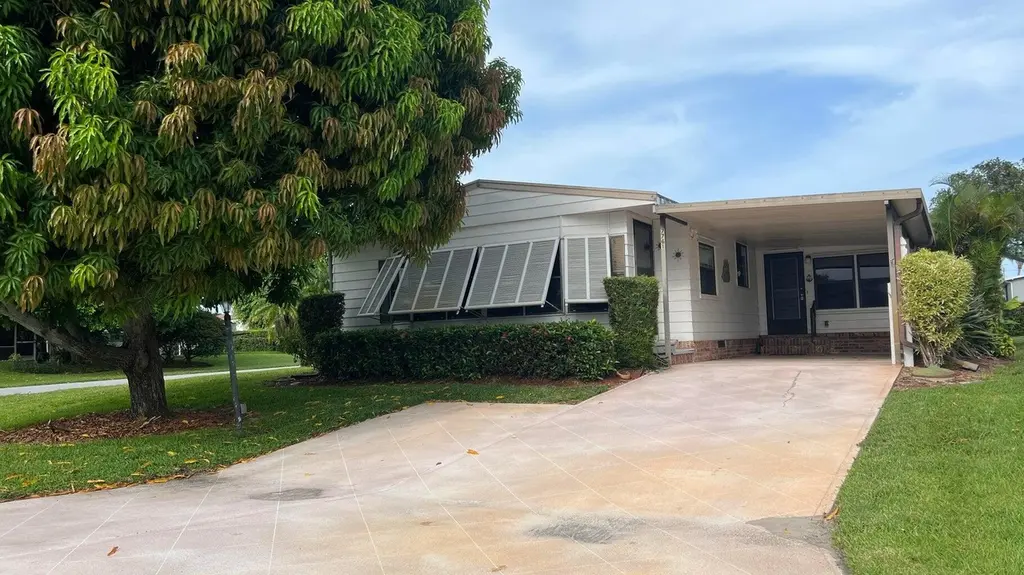
7761 SE Shenandoah Dr · Hobe Sound, FL
Flood risk 1/10 · Minimal
- FEMA flood zone
- X (unshaded)
- Chance of flooding over 30 yrs
- 0.0%
- Est. flood insurance / yr
- $507 – $1,088
Fire risk 2/10 · Minimal
- Est. fire insurance / yr
- $947 – $1,759
Heat risk 10/10 · Severe
- Hot days now (above 106°F)
- 7 days/yr
- Hot days in 30 yrs
- 25 days/yr
Wind risk 10/10 · Severe
- Chance of severe wind over 30 yrs
- 99.0%
Air-quality risk 2/10 · Minimal
- Unhealthy air days now
- 1 days/yr
- Unhealthy air days in 30 yrs
- 1 days/yr
Risk factors via First Street. Map © Google.
Why this score? — see what drove the D- grade
The composite is a weighted blend of 9 inputs, each scored 0–100. Each bar is that input's sub-score; the figure is the points it added to the 100-point composite (weight × sub-score).
- Cash flow +15.8/30.0
- DSCR +4.9/10.0
- 1% rule +4.6/10.0
- Schools +4.5/10.0
- Livability +3.5/5.0
- Rent growth +3.0/5.0
- Condition / age +2.5/5.0
- ARV discount +0.4/15.0
- Appreciation +0.0/10.0
$254,900
🖨 Deal sheet (PDF) 📄 Offer letter ✓ Due diligence
Listing remarks MLS
This open concept Palm Harbor manufactured home is located in the desirable Cambridge in Heritage Ridge. Designed for entertaining, it features a wet bar with plenty of room to spread out. The attached Florida room is fully air conditioned. LVP flooring, AC 2019, Metal Roof 2002, Shower 2026, and brick skirting complete this package.On a corner oversized lot it provides a huge mango tree and space for gardening or pets. This 55+community offers land ownership and plenty of social activites, and a very LOW HOA. Pets are welcome. Close to restaurants, beaches, boat ramps, parks, shopping and medical, this is the one to see.
Key facts
- 6,227 sq ft lot
- 3 parking spots
- Community pool
Neighborhood map
What this means for you Summary
Snapshot
- This is a 2-bed/2.0-bath manufactured listed at $255k.
Deal economics
- At list price, monthly cash flow is $117 ($1k/yr) — positive.
- The deal already cash-flows at list — no discount required.
- To meet the 1% rule (rent ≥ 1% of price), the offer needs to be $244k (4.2% below list).
- Recommended offer: $224k (12.0% below list) — sets the bar for market timing.
- Cap rate 6.8% vs local median 3.3% in Hobe Sound — top-decile yield for the area; either an underpriced asset or a hidden risk that comps aren't pricing in. Stress-test before assuming the spread holds.
Location & tenants
- Location reads 69/100 on livability (#497 in FL) — a middle-class / working-renter tenant base. Strengths: housing A+, crime A, cost of living A; Watch: employment C-, amenities F, commute F.
- Martin (suburban): math 52% / reading 53% proficiency, ranked #24 of 73 in FL (top 33%) — acceptable for families but not a draw, mixed tenant base, ~2y average lease.
- Zoned schools: Sea Wind Elementary School (math 43% / reading 46%, grade F, #1,288 of 2,144 statewide, top 62%, 501 students, 72% FRL); Murray Middle School (math 45% / reading 43%, grade D, #327 of 571 statewide, top 57%, 616 students, 69% FRL); South Fork High School (math 36% / reading 48%, grade F, #275 of 667 statewide, top 42%, 1,810 students, 51% FRL) — zoned schools average 64% FRL vs 41% district-wide (23 pts higher); higher-poverty schools than district average — tighter screening recommended.
- Market conditions: Rents rising (+1.8%/yr); 283 active listings in the ZIP; 16 comparable units currently listed for rent nearby; rentals at typical pace (median 26d on market — plan ~3-4 weeks tenant-placement turnaround); 737 units permitted in Martin County in 2024 (167 in 5+ unit buildings).
- This rent runs 42% of the median local income ($70k/yr) — at the standard rent-burdened threshold; future hikes will face affordability resistance.
Forward outlook
- Local home prices are declining (-3.0%/yr); year-one equity from $2k of loan paydown is wiped out by about $8k of value loss. Plan a longer hold.
- Martin County population projected at +19% by 2050 — long-run rental-demand tailwind backs the buy-and-hold thesis.
Negotiation context
- It's been on market 144 days — a 12% lower offer ($224k) is reasonable based on typical stale-listing flexibility.
- 8 sale attempts since 14y ago with the ask held roughly flat each time — persistent listings suggest the price (not the market) is what's stuck; bring a comps-based counter.
- Current owner paid $80k; list at $255k implies a 219% gain — meaningful room to come down on a strong offer.
Risks & watch-outs
- Climate carrying-cost: severe wind risk, 99% chance of damaging wind over 30y; extreme-heat days projected 7→25/yr by 2055 (HVAC capex compounding) — expect insurance premiums to compound above CPI over the hold.
Questions for the listing agent
- It's been on market 144 days. Have you received any prior offers? Is the seller open to a 12% concession, seller financing, or rate buy-down credit?
- What does the HOA fee cover, when was the last increase, and are there any pending special assessments or reserve-fund shortfalls?
- Why hasn't it sold? Are there any deal-killer items the seller is aware of (foundation, flood, title, zoning, code violations)?
- Is there a deadline driving the sale (1031 exchange, divorce, estate, relocation)? That informs how much negotiation room exists.
- The area grade is low — what's the realistic commute time and amenity access for the typical tenant pool here? Any planned neighborhood developments (good or bad) we should know about?
- What's the average days-on-market for RENTAL listings here right now (not sales)? A rising rental-DOM trend means longer vacancies and softer asking-rent achievability than the comps imply.
- What's the recent tenant-quality profile in this submarket — average credit score on applications, eviction rate, late-payment / NSF rate, and stable-employment percentage? A property-management company in the area should have these aggregated.
- How much new for-sale + rental construction is in the pipeline within 1–3 miles? Heavy new supply typically softens prices + rents 12–24 months out; constrained supply supports both.
Investment metrics
- 1% rule
- 0.96% ✗
- Cap rate
- 6.85%
- Cash-on-cash
- 1.97%
- DSCR
- 1.09
- GRM
- 8.7
CMA / ARV
- ARV (median comp)
- $220,350
- List price
- $254,900
- Delta
- 15.68%
- Verdict
- OVERPRICED
- Comps
- 20 within 1.0 mi
Show comp detail 12 sales within ~0.75 mi
| Address | Dist | Beds/Ba | Sqft | Sold | Price | $/sf | Match |
|---|---|---|---|---|---|---|---|
| 7660 SE Shenandoah Dr SE | 0.12mi | 2/2.0 | 1,475 (+5%) | 2mo | $236,000 | $160 | 85 |
| 7874 SE Saratoga Dr | 0.12mi | 2/2.0 | 1,485 (+5%) | 1mo | $225,000 | $152 | 84 |
| 7843 SE Saratoga Dr | 0.08mi | 2/2.0 | 1,505 (+7%) | 1mo | $230,000 | $153 | 84 |
| 7850 SE Shenandoah Dr | 0.10mi | 2/2.0 | 1,293 (-8%) | 2mo | $210,000 | $162 | 80 |
| 7924 SE Saratoga Dr | 0.16mi | 2/2.0 | 1,513 (+7%) | 2mo | $285,000 | $188 | 79 |
| 8031 SE Homestead Ave | 0.31mi | 2/2.0 | 1,322 (-6%) | 1mo | $169,000 | $128 | 74 |
| 7955 SE Independence Ave | 0.22mi | 2/2.0 | 1,279 (-9%) | 1mo | $234,500 | $183 | 74 |
| 8004 SE Saratoga Dr | 0.22mi | 2/2.0 | 1,298 (-8%) | 3mo | $240,000 | $185 | 74 |
| 7630 SE Shenandoah Dr | 0.15mi | 3/2.0 (+1) | 1,531 (+9%) | 1mo | $185,000 | $121 | 73 |
| 8199 SE Eagle Ave | 0.53mi | 3/2.0 (+1) | 1,358 (-4%) | 3mo | $260,000 | $191 | 61 |
| 7107 SE Seahawk St | 0.70mi | 2/2.0 | 1,236 (-12%) | 1mo | $215,000 | $174 | 46 |
| 7338 SE Redbird Cir | 0.72mi | 3/2.0 (+1) | 1,224 (-13%) | 1mo | $202,000 | $165 | 38 |
Match score weights: distance 35% · size 25% · config 20% · recency 20%. Top-matched comps best support the ARV.
Projected returns pro-forma
-3.0% appreciation · 1.8% rent growth · sell at horizon
- IRR
- -14.5%
- Equity multiple
- 0.49×
- Total profit
- $-36,680
- Equity at exit
- $38,006
- IRR
- -7.9%
- Equity multiple
- 0.53×
- Total profit
- $-33,715
- Equity at exit
- $22,039
Cash invested: $71,372 (down + closing). Projections, not guarantees.
Landlord ↔ Tenant lean methodology
- Overall (STATE)
- 87 Strongly Landlord-Friendly
- State Florida
- 87 Strongly Landlord-Friendly · R+3
- County
- — inherits STATE
- City
- — inherits STATE
ZIP-level market 33455
- Rents YoY
- 1.8%
- Active inventory
- 283
- Price-to-rent
- 8.7×
Monthly cashflow live
- Estimated rent
- $2,441 high interval (Pro) →
- Mortgage (P&I)
- −$1,337
- Tax from tax record
- −$243 /mo · $2,922/yr
- Insurance
- −$106
- HOA
- −$125
- Vacancy / Maint / Mgmt
- −$513
- Net cashflow
- $117
Break-even live
Sensitivity live
| Price | -10% $262 | -5% $189 | +0% $117 | +5% $45 | +10% $-27 |
|---|---|---|---|---|---|
| Rent | -10% $-76 | -5% $21 | +0% $117 | +5% $214 | +10% $310 |
| Rate | -1.0pp $246 | -0.5pp $182 | base $117 | +0.5pp $51 | +1.0pp $-16 |
UW: 25.0% down · 7.5% · 30yr · 1.5% tax · 5.0% vac · 8.0% maint · 8.0% mgmt
Financing live
Cash to close
- Down payment
- $63,725
- Closing costs
- $7,647
- Reserves months
- —
- Total cash needed
- —
Loan-product check · same deal, 3 products live
Conventional
25% down · 7.5% · 30yr
- Down + closing
- —
- Monthly P&I
- —
- Monthly cashflow
- —
- DSCR
- —
- Eligible?
- —
Personal DTI + credit; lowest rate.
DSCR
20% down · 8.5% · 30yr
- Down + closing
- —
- Monthly P&I
- —
- Monthly cashflow
- —
- DSCR
- —
- Eligible?
- —
No personal income docs; deal must DSCR.
Hard money
10% down · 12.0% · 12mo
- Down + closing
- —
- Monthly P&I
- —
- Monthly cashflow
- —
- DSCR
- —
- Eligible?
- —
Short-term bridge; refi at stabilization.
Rent comps 16 comps
| Address | Beds | Baths | Sqft | Rent | $/sqft | DOM | Units | Dist |
|---|---|---|---|---|---|---|---|---|
| 7894 SE Saratoga Dr Hobe Sound, FL | 2.0 | 2.0 | 1248 | $2,100 | $1.68 | 25d | 1 | 0.11mi |
| 7568 SE Swan Ave Hobe Sound, FL | 2.0 | 2.0 | 1052 | $2,300 | $2.19 | 25d | 1 | 0.17mi |
| 7462 SE Jamestown Ter Hobe Sound, FL | 2.0 | 2.0 | 1384 | $2,500 | $1.81 | 25d | 1 | 0.25mi |
| 7442 SE Jamestown Ter Hobe Sound, FL | 2.0 | 2.0 | 1384 | $1,800 | $1.30 | 25d | 1 | 0.30mi |
| 7445 SE Independence Ave Hobe Sound, FL | 2.0 | 2.0 | 1198 | $1,900 | $1.59 | 25d | 1 | 0.33mi |
| 8002 SE Skylark Ave Hobe Sound, FL | 3.0 | 2.0 | 990 | $2,000 | $2.02 | 25d | 1 | 0.44mi |
| 7030 SE Ridgeway Ter Hobe Sound, FL | 3.0 | 2.0 | 1296 | $2,500 | $1.93 | 25d | 1 | 0.62mi |
| 6845 SE Bunker Hill Dr Hobe Sound, FL | 2.0 | 2.0 | 1552 | $3,500 | $2.26 | 16d | 1 | 0.72mi |
| 6024 SE Crooked Oak Ave Hobe Sound, FL | 3.0 | 2.0 | 1800 | $3,200 | $1.78 | 25d | 1 | 0.72mi |
| 6215 SE Georgetown Pl Hobe Sound, FL | 2.0 | 2.0 | 1202 | $2,600 | $2.16 | 25d | 1 | 0.75mi |
| 8350 SE Sweetbay Dr Hobe Sound, FL | 2.0 | 2.0 | 1606 | $3,500 | $2.18 | 25d | 1 | 0.80mi |
| 7607 SE Hobe Ter Hobe Sound, FL | 2.0 | 2.0 | 1156 | $2,200 | $1.90 | 16d | 1 | 0.94mi |
| 8905 SE Sandy Ln Hobe Sound, FL | 2.0 | 2.0 | 1006 | $1,850 | $1.84 | 25d | 1 | 1.15mi |
| 8997 SE Sandy Ln Hobe Sound, FL | 2.0 | 1.0 | 900 | $2,000 | $2.22 | 25d | 1 | 1.23mi |
| 9073 SE Hobe Ridge Ave Hobe Sound, FL | 2.0 | 2.0 | 1029 | $2,100 | $2.04 | 16d | 1 | 1.30mi |
| 8014 SE Carlton St Hobe Sound, FL | 3.0 | 2.0 | 1463 | $3,500 | $2.39 | 25d | 1 | 1.50mi |
HOA detail
- Monthly dues
- $125 · $1,500/yr
Listing history 36 events
-
2026-06-21days on market $254,900 Active 144 DOM
-
2026-06-18days on market $254,900 Active 141 DOM
-
2026-06-17days on market $254,900 Active 140 DOM
-
2026-06-16days on market $254,900 Active 139 DOM
-
2026-06-15days on market $254,900 Active 138 DOM
-
2026-06-14days on market $254,900 Active 136 DOM
-
2026-06-13days on market $254,900 Active 135 DOM
-
2026-06-10days on market $254,900 Active 133 DOM
-
2026-06-09days on market $254,900 Active 132 DOM
-
2026-06-08days on market $254,900 Active 131 DOM
-
2026-06-07days on market $254,900 Active 130 DOM
-
2026-06-03days on market $254,900 Active 126 DOM
-
2026-06-02days on market $254,900 Active 125 DOM
-
2026-06-01days on market $254,900 Active 124 DOM
-
2026-05-31days on market $254,900 Active 123 DOM
-
2026-05-31days on market $254,900 Active 122 DOM
-
2026-01-26$264,900 Active 630-char remark
Show marketing remark (630 chars)
This open concept Palm Harbor manufactured home is located in the desirable Cambridge in Heritage Ridge. Designed for entertaining, it features a wet bar with plenty of room to spread out. The attached Florida room is fully air conditioned. LVP flooring, AC 2019, Metal Roof 2002, Shower 2026, and brick skirting complete this package.On a corner oversized lot it provides a huge mango tree and space for gardening or pets. This 55+community offers land ownership and plenty of social activites, and a very LOW HOA. Pets are welcome. Close to restaurants, beaches, boat ramps, parks, shopping and medical, this is the one to see.
-
2025-11-17historical $2,200
-
2025-07-12$2,200
-
2025-07-08historical
-
2024-07-30status Active
-
2024-07-28historical
-
2024-04-23status Active
-
2024-04-17historical Active Under Contract
-
2023-07-27$265,000 Active
-
2023-04-30historical
-
2023-03-14price $289,000
-
2022-09-14$299,000 Active
-
2021-09-06$249,000 Active
-
2016-01-11price $80,000
-
2012-11-13soldstatus $80,000
-
2012-11-13price $84,500
-
2012-11-13soldstatus $80,000
-
2012-10-08$84,500
-
1986-08-01soldstatus $78,000
-
1983-12-01soldstatus $21,100
ⓘ Source: listings_history table (triggers on properties + properties_extension) + one-shot
backfill from property_details.listing_events for pre-trigger history.
Tax reassessment forecast FL · Resets to sale price
- Current annual tax
- $2,922 · $243/mo
- Projected year-2 tax
- $2,922 · $243/mo
- Expected delta
- $0/yr ($0/mo · 0.0%)
ⓘ Screening estimate from a state-policy table — verify with the county assessor before closing.
Climate risk First Street
- Flood 1/10 Low FEMA zone X (unshaded) · 0% chance over 30 yrs
- Wildfire 2/10 Low
- Heat 10/10 Extreme 7 d/yr ≥106°F today · 25 d/yr by 30 yrs out
- Wind 10/10 Extreme 99% chance of damaging wind over 30 yrs
- Air quality 2/10 Low 1 unhealthy d/yr today · 1 by 30 yrs out
Nearby sold comps map
Loading sold comps map…
Walkable amenities ~0.75 mi
Loading nearby amenities…
Taxation est. · year 1
- Rental income
- $29,296
- − Mortgage interest
- −$14,278
- − Property taxes
- −$2,922
- − Insurance
- −$1,274
- − Repairs & maintenance
- −$2,344
- − Management
- −$2,344
- − HOA
- −$1,500
- − Depreciation
- −$7,415
- Taxable loss
- −$2,781
- Est. tax savings @ 24.0%
- +$667
- After-tax cash flow
- $2,075/yr
For passive investors: Depreciation is non-cash, so a rental often shows a tax loss while cash-flowing — sheltering income. Rental losses are passive: they offset passive income freely, and up to $25,000/yr can offset ordinary (W-2) income if you actively participate and your MAGI is under $100k (phasing out to $0 by $150k); unused losses carry forward. On sale, claimed depreciation is recaptured at up to 25%, and gains may owe capital-gains tax (a 1031 exchange can defer both). Figures are a year-1 estimate at your 24.0% rate — not tax advice; consult a CPA.
Schools (NCES district)
- District
- Martin
- NCES district ID
- 1201290
- Math proficiency
- 52% ▼ -14.00%
- Reading proficiency
- 53% ▼ -4.00%
- Median HH income
- $52,482
- Composite
- 45.1/100
- National rank
- #2690
- State rank
- #24 of 73 in FL
Livability — Hobe Sound
- Score
- 69/100
- State rank
- #497
- US rank
- #8763
Category grades
Schools grade is shown separately in the Schools card above.
Census & demographics
- Census place
- Hobe Sound, FL
- County
- Martin County · 165,223 people
- City population
- 20,018
- Metro
- Port St. Lucie, FL
- Population (ZIP)
- 20,018
- Household income
- $70,389
- Rent vs Own
- Severe rent burden
- 317.0
Population outlook (Martin County) Hauer SSP2
- Today (2025)
- 172,383 people
- By 2030
- 180,192 · +4.5%
- By 2040
- 194,114 · +12.6%
- By 2050
- 204,992 · +18.9%
- By 2075
- 229,641 · +33.2%
- By 2100
- 232,146 · +34.7%
Race, ethnicity, and origin ACS 2023
- Neighborhood character
- Predominantly White (84%)
- Race & ethnicity
- White 84% Hispanic / Latino 8% Two or more races 6% Black 5% Asian 1%
- Hispanic origin (detail)
- Mexican 3% Dominican 1%
- Common ancestry
- Romanian 5% Italian 2% Slovak 2%
- Foreign-born
- 8% · Canada
- Languages at home
- 91% English-only · Spanish 6% Other Indo-European 1%
Political lean MEDSL · Martin
- 2024 margin
- Solid R (+31.1) · D 34.1% · R 65.2%
- 2008→2024 swing
- -17.5pp toward R · 2008: -13.6pp · 2024: -31.1pp
- All cycles
- 2024: R+31.1 2020: R+24.6 2016: R+26.9 2012: R+22.9 2008: R+13.6
Not yet ingested
- Civics
- —
Market trends
- HPI YoY
- ▼ -287.05%
- Current HPI
- 356.7273
- Rent YoY
- ▲ 1.80%
- Metro
- Port St. Lucie, FL
- State GDP YoY
- ▲ 3.28%
- F500 in state
- 36
Industry mix (Fortune 500 HQ in FL)
| Industry | F500 HQs | Revenue |
|---|---|---|
| Industrial Technology | 2 | $29B |
|
||
| Insurance | 2 | $17B |
|
||
| Retail | 1 | $60B |
|
||
| Technology Distribution | 1 | $58B |
|
||
| Homebuilding | 1 | $35B |
|
||
| Technology Manufacturing | 1 | $35B |
|
||
Price history
+1155.5% since first listed20 events — show timeline
- 2026-01-26 Listed $264,900 Beaches MLS
- 2025-11-17 Rental Removed $2,200 RMLSFL
- 2025-07-12 Listed for Rent $2,200 RMLSFL
- 2025-07-08 Listing Removed — Beaches MLS
- 2024-07-30 Relisted — Beaches MLS
- 2024-07-28 Listing Removed — Beaches MLS
- 2024-04-23 Relisted — Beaches MLS
- 2024-04-17 Contingent — Beaches MLS
- 2023-07-27 Listed $265,000 Beaches MLS
- 2023-04-30 Listing Removed — MCRTC
- 2023-03-14 Price Changed $289,000 MCRTC
- 2022-09-14 Listed $299,000 MCRTC
- 2021-09-06 Listed $249,000 MCRTC
- 2016-01-11 Price Changed $80,000 MCRTC
- 2012-11-13 Sold (Public Records) $80,000 Public Records
- 2012-11-13 Price Changed $84,500 MCRTC
- 2012-11-13 Sold (MLS) $80,000 MCRTC
- 2012-10-08 Listed $84,500 MCRTC
- 1986-08-01 Sold (Public Records) $78,000 Public Records
- 1983-12-01 Sold (Public Records) $21,100 Public Records
Property tax history
+7.2%/yrLatest (2025): $2,922 · +2.4% YoY. Source: county tax records.
Cash-flow waterfall
monthlySold comps — $/sqft
last 12 mo · ≤1 miLoading sold comps…