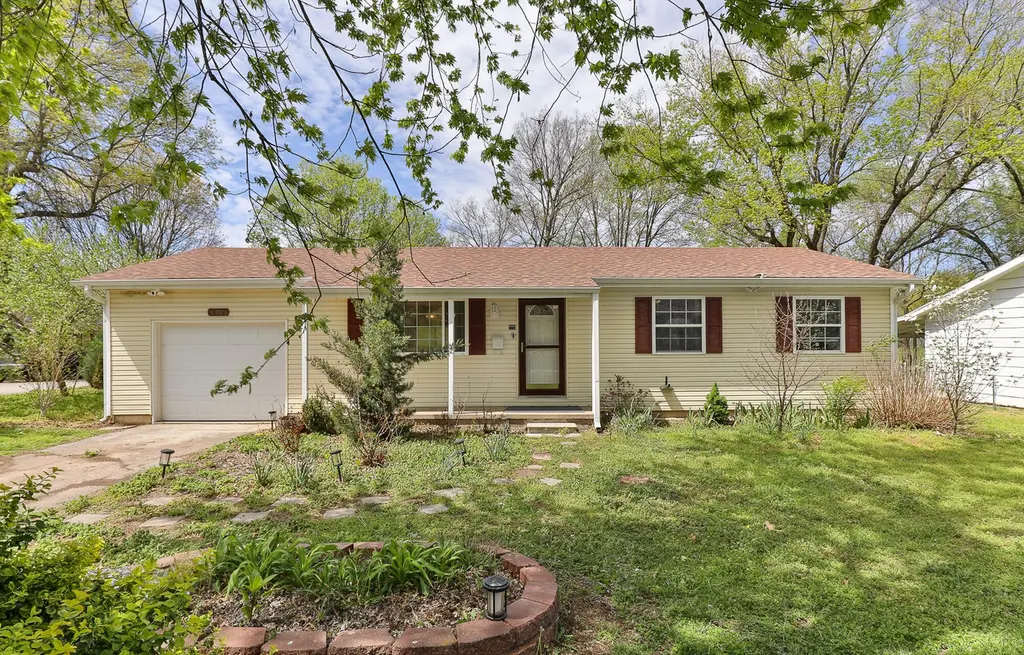
521 N Forest Ln · Republic, MO
Flood risk 1/10 · Minimal
- FEMA flood zone
- X (unshaded)
- Chance of flooding over 30 yrs
- 0.0%
- Est. flood insurance / yr
- $507 – $1,088
Fire risk 3/10 · Minor
- Est. fire insurance / yr
- $1,054 – $1,958
Heat risk 5/10 · Moderate
- Hot days now (above 104°F)
- 7 days/yr
- Hot days in 30 yrs
- 19 days/yr
Wind risk 2/10 · Minimal
- Chance of severe wind over 30 yrs
- 1.0%
Air-quality risk 1/10 · Minimal
- Unhealthy air days now
- 0 days/yr
- Unhealthy air days in 30 yrs
- 0 days/yr
Risk factors via First Street. Map © Google.
Why this score? — see what drove the D grade
The composite is a weighted blend of 9 inputs, each scored 0–100. Each bar is that input's sub-score; the figure is the points it added to the 100-point composite (weight × sub-score).
- Cash flow +12.3/30.0
- ARV discount +11.1/15.0
- Schools +4.8/10.0
- DSCR +3.7/10.0
- Livability +3.6/5.0
- Rent growth +3.4/5.0
- 1% rule +2.6/10.0
- Condition / age +2.5/5.0
- Appreciation +0.0/10.0
$199,900
🖨 Deal sheet 📄 Offer letter ✓ Due diligence
Listing remarks MLS
Nice corner lot! Updated ranch, 3 bedrooms, Pergo floors, new energy saving windows throughout. All new doors, fresh paint, smooth top stove, front porch plus a huge covered deck in back, large corner lot with privacy fencing. Swing set remains with property. Storage shed in backyard remains with house.
Key facts
- Modern updates
- Newer roof
- Refreshed bathroom
Tags
Property features AI
Exterior
- Parking: Detached or attached garage with 1 parking space
- Security: Carbon monoxide detector(s); Smoke detector(s)
- Utilities: Public water; Public sewer
- Home design: Single-family residence; One level; Vinyl siding
- Construction: Shingle roof; Block foundation; Built with vinyl siding
- Exterior features: Rain gutters; Covered patio/deck; Deck; Fenced yard with full privacy fencing; Asphalt road frontage (city street, publicly maintained)
Interior
- Kitchen: Electric oven; Free-standing electric oven; Dishwasher; Refrigerator; Garbage disposal
- Flooring: Laminate
- Bathrooms: 1 full bathroom
- Heating & cooling: Central heating (forced air, electric); Central air conditioning; Ceiling fans; Attic fan
- Interior features: Pantry; Insulated windows; Double-pane windows
- Laundry & utility: Laundry in garage; Electric water heater
Neighborhood map
What this means for you Summary
Snapshot
- This is a 3-bed/1.0-bath single-family listed at $200k.
Deal economics
- At list price, monthly cash flow is $-36 ($-437/yr) — negative.
- To cash-flow at today's rent, offer at most $193k (3.2% below list).
- To meet the 1% rule (rent ≥ 1% of price), the offer needs to be $152k (24.1% below list).
- Recommended offer: $152k (24.1% below list) — sets the bar for 1% rule.
- Cap rate 6.1% vs local median 4.0% in Republic — top-decile yield for the area; either an underpriced asset or a hidden risk that comps aren't pricing in. Stress-test before assuming the spread holds.
Location & tenants
- Location reads 72/100 on livability (#92 in MO) — a middle-class / working-renter tenant base. Strengths: cost of living A+, housing A+, crime A; Watch: amenities F, commute F, health & safety F.
- Republic R-III (suburban): math 56% / reading 57% proficiency, ranked #19 of 324 in MO (top 6%) — acceptable for families but not a draw, mixed tenant base, ~2y average lease.
- Zoned schools: Republic Middle (math 50% / reading 53%, grade C, #57 of 391 statewide, top 15%, 1,146 students, 39% FRL); Republic High (math 56% / reading 60%, grade C, #48 of 521 statewide, top 9%, 1,542 students, 31% FRL) — zoned schools at 35% FRL track the district average.
- Market conditions: Rents rising (+3.6%/yr); 478 active listings in the ZIP; 9 comparable units currently listed for rent nearby; rentals at typical pace (median 21d on market — plan ~3-4 weeks tenant-placement turnaround); 44% of comp listings sitting > 30 days — soft ceiling on asking rent; 1,302 units permitted in Greene County in 2024 (250 in 5+ unit buildings).
Forward outlook
- Local home prices are declining (-3.0%/yr); year-one equity from $1k of loan paydown is wiped out by about $6k of value loss. Plan a longer hold.
- Greene County population projected at +25% by 2050 — long-run rental-demand tailwind backs the buy-and-hold thesis.
Negotiation context
- Only 1 days on market — expect competitive offers; lowballing is unlikely to land.
- 4 sale attempts since 18y ago with the ask held roughly flat each time — persistent listings suggest the price (not the market) is what's stuck; bring a comps-based counter.
Risks & watch-outs
- Climate carrying-cost: extreme-heat days projected 7→19/yr by 2055 (HVAC capex compounding) — expect insurance premiums to compound above CPI over the hold.
Questions for the listing agent
- What do current leases actually rent for vs. the listed asking? Can we see a recent rent roll and the last 12 months of T-12 income?
- Built in 1976 — when were the roof, HVAC, electrical panel, plumbing, and water heater last replaced?
- Is there a deadline driving the sale (1031 exchange, divorce, estate, relocation)? That informs how much negotiation room exists.
- Schools are B-rated — typically a magnet for longer-tenancy family renters. What's the average tenant stay here, and is there a school-zone premium baked into asking?
- The area grade is low — what's the realistic commute time and amenity access for the typical tenant pool here? Any planned neighborhood developments (good or bad) we should know about?
- What's the average days-on-market for RENTAL listings here right now (not sales)? A rising rental-DOM trend means longer vacancies and softer asking-rent achievability than the comps imply.
- What's the recent tenant-quality profile in this submarket — average credit score on applications, eviction rate, late-payment / NSF rate, and stable-employment percentage? A property-management company in the area should have these aggregated.
- How much new for-sale + rental construction is in the pipeline within 1–3 miles? Heavy new supply typically softens prices + rents 12–24 months out; constrained supply supports both.
Investment metrics
- 1% rule
- 0.76% ✗
- Cap rate
- 6.07%
- Cash-on-cash
- -0.78%
- DSCR
- 0.97
- GRM
- 11.0
CMA / ARV
- ARV (on-the-fly)
- $217,360
- Comps found
- 12
Show comp detail 12 sales within ~0.75 mi
| Address | Dist | Beds/Ba | Sqft | Sold | Price | $/sf | Match |
|---|---|---|---|---|---|---|---|
| 521 N Forest Ln | 0.00mi | 3/1.0 | 1,144 (0%) | 1mo | $199,900 | $175 | 99 |
| 319 W Hines St | 0.17mi | 3/1.0 | 1,134 (-1%) | 2mo | $189,900 | $167 | 88 |
| 605 N West Ave | 0.10mi | 3/2.0 | 1,200 (+5%) | 4mo | $175,000 | $146 | 80 |
| 647 N Dana Ave | 0.19mi | 3/1.0 | 1,066 (-7%) | 2mo | $215,000 | $202 | 78 |
| 447 W Logan St | 0.07mi | 3/2.0 | 1,230 (+8%) | 4mo | $229,900 | $187 | 77 |
| 135 N Bonnie Ave | 0.36mi | 3/1.0 | 1,120 (-2%) | 6mo | $190,000 | $170 | 75 |
| 202 S Jackson St | 0.53mi | 3/1.5 | 1,154 (+1%) | 1mo | $226,500 | $196 | 71 |
| 626 N Phelps Ave | 0.20mi | 3/2.0 | 1,232 (+8%) | 4mo | $180,000 | $146 | 71 |
| 421 W Elm St | 0.42mi | 3/1.5 | 1,052 (-8%) | 3mo | $199,900 | $190 | 63 |
| 413 W Elm St | 0.42mi | 3/1.5 | 1,052 (-8%) | 3mo | $205,000 | $195 | 62 |
| 241 W Wilson St | 0.57mi | 3/2.0 | 1,215 (+6%) | 1mo | $235,000 | $193 | 58 |
| 114 S Eagan St | 0.47mi | 3/2.0 | 1,262 (+10%) | 1mo | $265,000 | $210 | 56 |
Match score weights: distance 35% · size 25% · config 20% · recency 20%. Top-matched comps best support the ARV.
Projected returns pro-forma
-3.0% appreciation · 3.61% rent growth · sell at horizon
- IRR
- -17.0%
- Equity multiple
- 0.40×
- Total profit
- $-33,840
- Equity at exit
- $29,806
- IRR
- -8.0%
- Equity multiple
- 0.48×
- Total profit
- $-28,834
- Equity at exit
- $17,284
Cash invested: $55,972 (down + closing). Projections, not guarantees.
Landlord ↔ Tenant lean methodology
- Overall (STATE)
- 81 Strongly Landlord-Friendly
- State Missouri
- 81 Strongly Landlord-Friendly · R+10
- County
- — inherits STATE
- City
- — inherits STATE
ZIP-level market 65738
- Home prices YoY
- -32.2%
- Rents YoY
- 3.6%
- Active inventory
- 478
- Price-to-rent
- 11.0×
Monthly cashflow live
- Estimated rent
- $1,517 high interval (Pro) →
- Mortgage (P&I)
- −$1,048
- Tax from tax record
- −$103 /mo · $1,235/yr
- Insurance
- −$83
- HOA
- −$0
- Vacancy / Maint / Mgmt
- −$318
- Net cashflow
- $-36
Break-even live
UW: 25.0% down · 7.5% · 30yr · 1.5% tax · 5.0% vac · 8.0% maint · 8.0% mgmt
Financing live
Cash to close
- Down payment
- $49,975
- Closing costs
- $5,997
- Reserves months
- —
- Total cash needed
- —
Loan-product check · same deal, 3 products live
Conventional
25% down · 7.5% · 30yr
- Down + closing
- —
- Monthly P&I
- —
- Monthly cashflow
- —
- DSCR
- —
- Eligible?
- —
Personal DTI + credit; lowest rate.
DSCR
20% down · 8.5% · 30yr
- Down + closing
- —
- Monthly P&I
- —
- Monthly cashflow
- —
- DSCR
- —
- Eligible?
- —
No personal income docs; deal must DSCR.
Hard money
10% down · 12.0% · 12mo
- Down + closing
- —
- Monthly P&I
- —
- Monthly cashflow
- —
- DSCR
- —
- Eligible?
- —
Short-term bridge; refi at stabilization.
Rent comps 9 comps
| Address | Beds | Baths | Sqft | Rent | $/sqft | DOM | Units | Dist |
|---|---|---|---|---|---|---|---|---|
| 217 W Logan St Republic, MO | 2.0 | 1.0 | 800 | $1,300 | $1.62 | 21d | 1 | 0.21mi |
| 725 W Juan Tabo Ln Republic, MO | 3.0 | 2.0 | 1450 | $1,600 | $1.10 | 44d | 1 | 0.44mi |
| 912 N Walnut Ave Unit 15 Republic, MO | 2.0 | 1.0 | 750 | $775 | $1.03 | 21d | 1 | 0.45mi |
| 912 N Walnut Ave Unit 06 Republic, MO | 2.0 | 1.0 | 750 | $775 | $1.03 | 44d | 1 | 0.45mi |
| 241 W Wilson St Republic, MO | 3.0 | 2.0 | 1215 | $1,800 | $1.48 | 14d | 1 | 0.57mi |
| 511 S Concordia Ave Republic, MO | 3.0 | 2.0 | 1420 | $1,395 | $0.98 | 44d | 1 | 0.87mi |
| 414 S Michelle Ave Republic, MO | 3.0 | 2.0 | 1446 | $1,695 | $1.17 | 14d | 1 | 1.02mi |
| 649 Rilynn Ave Republic, MO | 3.0 | 2.0 | 1300 | $1,500 | $1.15 | 14d | 1 | 1.05mi |
| 109 N Allen Ave Republic, MO | 3.0 | 1.0 | 1141 | $1,295 | $1.13 | 44d | 1 | 1.48mi |
Listing history 8 events
-
2026-04-10status Pending
-
2026-04-09$199,900 Active
-
2020-04-21soldstatus
-
2020-04-17soldstatus 305-char remark
Show marketing remark (305 chars)
Nice corner lot! Updated ranch, 3 bedrooms, Pergo floors, new energy saving windows throughout. All new doors, fresh paint, smooth top stove, front porch plus a huge covered deck in back, large corner lot with privacy fencing. Swing set remains with property. Storage shed in backyard remains with house.
-
2020-02-28$115,000 305-char remark
Show marketing remark (305 chars)
Nice corner lot! Updated ranch, 3 bedrooms, Pergo floors, new energy saving windows throughout. All new doors, fresh paint, smooth top stove, front porch plus a huge covered deck in back, large corner lot with privacy fencing. Swing set remains with property. Storage shed in backyard remains with house.
-
2009-10-21soldstatus
-
2009-02-09$92,900
-
2008-07-11$92,900
ⓘ Source: listings_history table (triggers on properties + properties_extension) + one-shot
backfill from property_details.listing_events for pre-trigger history.
Tax reassessment forecast MO · Resets to sale price
- Current annual tax
- $1,235 · $103/mo
- Projected year-2 tax
- $1,939 · $162/mo
- Expected delta
- +$704/yr (+$59/mo · 57.0%)
ⓘ Screening estimate from a state-policy table — verify with the county assessor before closing.
Climate risk First Street
- Flood 1/10 Low FEMA zone X (unshaded) · 0% chance over 30 yrs
- Wildfire 3/10 Moderate
- Heat 5/10 Major 7 d/yr ≥104°F today · 19 d/yr by 30 yrs out
- Wind 2/10 Low 100% chance of damaging wind over 30 yrs
- Air quality 1/10 Low 0 unhealthy d/yr today · 0 by 30 yrs out
Nearby sold comps map
Loading sold comps map…
Walkable amenities ~0.75 mi
Loading nearby amenities…
Taxation est. · year 1
- Rental income
- $18,200
- − Mortgage interest
- −$11,198
- − Property taxes
- −$1,235
- − Insurance
- −$1,000
- − Repairs & maintenance
- −$1,456
- − Management
- −$1,456
- − Depreciation
- −$5,815
- Taxable loss
- −$3,960
- Est. tax savings @ 24.0%
- +$950
- After-tax cash flow
- $514/yr
For passive investors: Depreciation is non-cash, so a rental often shows a tax loss while cash-flowing — sheltering income. Rental losses are passive: they offset passive income freely, and up to $25,000/yr can offset ordinary (W-2) income if you actively participate and your MAGI is under $100k (phasing out to $0 by $150k); unused losses carry forward. On sale, claimed depreciation is recaptured at up to 25%, and gains may owe capital-gains tax (a 1031 exchange can defer both). Figures are a year-1 estimate at your 24.0% rate — not tax advice; consult a CPA.
Schools (NCES district)
- District
- Republic R-III
- NCES district ID
- 2926220
- Math proficiency
- 56% ▲ 2.00%
- Reading proficiency
- 57% ▼ -1.00%
- Median HH income
- $51,329
- Composite
- 48.3/100
- National rank
- #2152
- State rank
- #19 of 324 in MO
Livability — Republic
- Score
- 72/100
- State rank
- #92
- US rank
- #6228
Category grades
Schools grade is shown separately in the Schools card above.
Census & demographics
- Census place
- Republic, MO
- County
- Greene County · 244,327 people
- City population
- 21,283
- Metro
- Springfield, MO
- Population (ZIP)
- 21,283
- Household income
- $67,841
- Rent vs Own
- Severe rent burden
- 461.0
Population outlook (Greene County) Hauer SSP2
- Today (2025)
- 319,054 people
- By 2030
- 335,135 · +5.0%
- By 2040
- 366,186 · +14.8%
- By 2050
- 397,431 · +24.6%
- By 2075
- 477,035 · +49.5%
- By 2100
- 520,828 · +63.2%
Race, ethnicity, and origin ACS 2023
- Neighborhood character
- Predominantly White (91%)
- Race & ethnicity
- White 91% Two or more races 4% Hispanic / Latino 3% Black 1%
- Common ancestry
- Italian 2% Lithuanian 2% Portuguese 2%
- Foreign-born
- 1% · Canada, China
- Languages at home
- 98% English-only · Spanish 1%
Political lean MEDSL · Greene
- 2024 margin
- Strong R (+20.8) · D 38.9% · R 59.7% · Other 1.4%
- 2008→2024 swing
- -5.0pp toward R · 2008: -15.8pp · 2024: -20.8pp
- All cycles
- 2024: R+20.8 2020: R+20.1 2016: R+27.4 2012: R+24.4 2008: R+15.8
Not yet ingested
- Civics
- —
Market trends
- HPI YoY
- ▼ -102.93%
- Current HPI
- 217.1512
- Rent YoY
- ▲ 3.61%
- Metro
- Springfield, MO
- State GDP YoY
- ▲ 1.84%
- F500 in state
- 20
Industry mix (Fortune 500 HQ in MO)
| Industry | F500 HQs | Revenue |
|---|---|---|
| Healthcare | 1 | $163B |
|
||
| Insurance | 1 | $21B |
|
||
| Industrial Technology | 1 | $17B |
|
||
| Retail | 1 | $16B |
|
||
| Industrial Distribution | 1 | $10B |
|
||
| Utilities | 1 | $9B |
|
||
Price history
+115.2% since first listed8 events — show timeline
- 2026-04-10 Pending — SOMO
- 2026-04-09 Listed $199,900 SOMO
- 2020-04-21 Sold (Public Records) — Public Records
- 2020-04-17 Sold (MLS) — SOMO
- 2020-02-28 Listed $115,000 SOMO
- 2009-10-21 Sold (Public Records) — Public Records
- 2009-02-09 Listed $92,900 SOMO
- 2008-07-11 Listed $92,900 SOMO
Property tax history
+5.7%/yrLatest (2025): $1,235 · +8.0% YoY. Source: county tax records.
Cash-flow waterfall
monthlySold comps — $/sqft
last 12 mo · ≤1 miLoading sold comps…