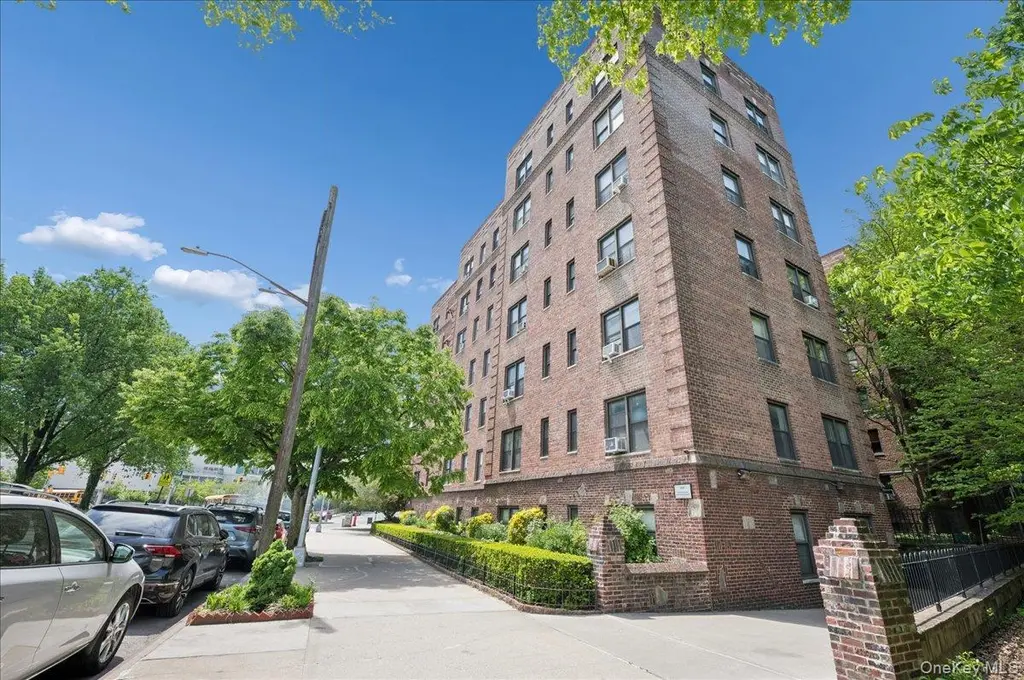
3015 Riverdale Ave Unit 5B · New York, NY
Flood risk 8/10 · Major
- FEMA flood zone
- X (unshaded)
- Chance of flooding over 30 yrs
- 0.78%
- Est. flood insurance / yr
- $507 – $1,088
Fire risk 1/10 · Minimal
- Est. fire insurance / yr
- $691 – $1,283
Heat risk 7/10 · Major
- Hot days now (above 99°F)
- 7 days/yr
- Hot days in 30 yrs
- 15 days/yr
Wind risk 6/10 · Moderate
- Chance of severe wind over 30 yrs
- 27.0%
Air-quality risk 3/10 · Minor
- Unhealthy air days now
- 3 days/yr
- Unhealthy air days in 30 yrs
- 4 days/yr
Risk factors via First Street. Map © Google.
Why this score? — see what drove the C grade
The composite is a weighted blend of 9 inputs, each scored 0–100. Each bar is that input's sub-score; the figure is the points it added to the 100-point composite (weight × sub-score).
- Cash flow +21.3/30.0
- ARV discount +7.5/15.0
- DSCR +6.8/10.0
- 1% rule +5.6/10.0
- Rent growth +5.0/5.0
- Schools +5.0/10.0
- Condition / age +4.0/5.0
- Livability +3.8/5.0
- Appreciation +0.0/10.0
$239,000
🖨 Deal sheet (PDF) 📄 Offer letter ✓ Due diligence
Listing remarks
LARGE AND QUIET COOP ONE BEDROOM UNIT * * LOCATED ON A HIGHER FLOOR WITH TREE VIEWS * * FRESHLY PAINTED * * HARDWOOD FLOORS WERE REDONE * * SPACIOUS ROOMS WITH PLENTY OF CLOSETS * * MONTHLY MAINTENANCE INCLUDES TAXES, HEAT, AND HOT WATER, AND COMMON GROUND MAINTENANCE * * QUICK ACCESS TO THE CITY * * NINE-MINUTE WALK TO SUBWAY ON 231ST ST. TAKE LINE 1 TO TIME SQUARE * * LAUNDRY LOCATED IN THE BASEMENT * * STREET PARKING * * IT IS CONVENIENTLY LOCATED NEAR BUS STOPS, HIGHWAYS, SHOPS, RESTAURANTS, AND SCHOOLS * * NEXT DOOR TO EWEN PARK DOG RUN * * TUCKAHOE METRO NORTH IS APPROXIMATELY 20 MINUTES ON FOOT (28 MINUTES BY TRAIN TO GRAND CENTRAL) * * CURRENT
Key facts
- Tree views
- Plenty of closets
- Higher floor
Tags
Property features AI
Exterior
- Parking: No carport; No designated parking
- Utilities: Electricity connected (Con-Edison); Natural gas connected; Public sewer; Public water; Trash collection
- Home design: Stock cooperative; Six-story building; Entry level 5
- Construction: Brick construction
- Exterior features: Brick construction; Not waterfront
Interior
- Kitchen: Dishwasher; Gas range; Microwave; Refrigerator; Stainless steel appliances
- Bedrooms: 3 rooms total (entry is on level 5)
- Flooring: Hardwood
- Bathrooms: 1 full bathroom
- Heating & cooling: Natural gas heating; Radiant heat; Wall/window AC unit(s)
- Interior features: Eat-in kitchen; Elevator; Entrance foyer; Finished basement; Pets allowed
- Laundry & utility: Laundry in basement
Neighborhood map
What this means for you Summary
Snapshot
- This is a 1-bed/1.0-bath condo listed at $239k. Condition is rated good.
Deal economics
- At list price, monthly cash flow is $283 ($3k/yr) — positive.
- The deal already cash-flows at list — no discount required.
- Meets the 1% rule at list price ($3k rent vs $239k).
- Recommended offer: $232k (3.0% below list) — sets the bar for market timing.
- Cap rate 8.0% vs local median 2.6% in New York — top-decile yield for the area; either an underpriced asset or a hidden risk that comps aren't pricing in. Stress-test before assuming the spread holds.
Location & tenants
- Location reads 75/100 on livability (#268 in NY, #4,188 nationally) — a middle-class / working-renter tenant base. Strengths: amenities A+, commute A+, health & safety A; Watch: crime F, cost of living F.
- Market conditions: Rents rising fast (+11.6%/yr); 345 active listings in the ZIP; 1 comparable units currently listed for rent nearby; 6,929 units permitted in Bronx County in 2024 (6,829 in 5+ unit buildings).
- This rent runs 41% of the median local income ($75k/yr) — at the standard rent-burdened threshold; future hikes will face affordability resistance.
Forward outlook
- Local home prices are declining (-3.0%/yr); year-one equity from $2k of loan paydown is wiped out by about $7k of value loss. Plan a longer hold.
- Bronx County population projected at +21% by 2050 — long-run rental-demand tailwind backs the buy-and-hold thesis.
- At projected returns (-3.0% appreciation + 8.0% rent growth), your $67k cash investment doubles in ~9 years — after that, you're playing with house money.
Negotiation context
- It's been on market 36 days — a 3% lower offer ($232k) is reasonable based on typical stale-listing flexibility.
Risks & watch-outs
- Watch-outs: flood insurance adds $66/mo; built in 1941 — expect roof / HVAC / electrical / plumbing capex.
- Climate carrying-cost: severe flood risk; major wind risk, 27% chance of damaging wind over 30y; extreme-heat days projected 7→15/yr by 2055 (HVAC capex compounding) — expect insurance premiums to compound above CPI over the hold.
Questions for the listing agent
- It's been on market 36 days. Have you received any prior offers? Is the seller open to a 3% concession, seller financing, or rate buy-down credit?
- Built in 1941 — when were the roof, HVAC, electrical panel, plumbing, and water heater last replaced?
- What's the actual annual flood-insurance premium (NFIP or private), and is the property in a SFHA with mandatory coverage?
- Any open or pending special assessments — roof, HVAC, plumbing, elevator, façade? What's the per-unit balance and payoff schedule, and is the seller paying it off at close or rolling it to the buyer?
- Is there a deadline driving the sale (1031 exchange, divorce, estate, relocation)? That informs how much negotiation room exists.
- Schools are B-rated — typically a magnet for longer-tenancy family renters. What's the average tenant stay here, and is there a school-zone premium baked into asking?
- Crime grade is F in this area — have there been break-ins, vandalism, or insurance claims at this property in the last 3 years? What carrier currently insures it and at what premium?
- What's the average days-on-market for RENTAL listings here right now (not sales)? A rising rental-DOM trend means longer vacancies and softer asking-rent achievability than the comps imply.
- What's the recent tenant-quality profile in this submarket — average credit score on applications, eviction rate, late-payment / NSF rate, and stable-employment percentage? A property-management company in the area should have these aggregated.
- How much new apartment / multifamily construction is in the pipeline within 1–3 miles? Heavy new supply (>2% of stock underway) typically softens rents 12–24 months out; light construction supports rent growth.
Investment metrics
- 1% rule
- 1.06% ✓
- Cap rate
- 8.05%
- Cash-on-cash
- 6.27%
- DSCR
- 1.28
- GRM
- 7.9
CMA / ARV
No comps found within radius.
Projected returns pro-forma
-3.0% appreciation · 8.0% rent growth · sell at horizon
- IRR
- -2.7%
- Equity multiple
- 0.89×
- Total profit
- $-7,218
- Equity at exit
- $35,636
- IRR
- 12.0%
- Equity multiple
- 2.17×
- Total profit
- $78,206
- Equity at exit
- $20,664
Cash invested: $66,920 (down + closing). Projections, not guarantees.
Landlord ↔ Tenant lean methodology
- Overall (CITY)
- 0 Strongly Tenant-Friendly
- State New York
- 15 Strongly Tenant-Friendly · D+10
- County
- — inherits STATE
- City New York
- 0 Strongly Tenant-Friendly · D+34
ZIP-level market 10463
- Rents YoY
- 11.6%
- Active inventory
- 345
- Price-to-rent
- 7.9×
Monthly cashflow live
- Estimated rent
- $2,533 medium interval (Pro) →
- Mortgage (P&I)
- −$1,253
- Tax est. 1.5%
- −$299 /mo · $3,585/yr
- Insurance
- −$100
- Flood insurance flood zone
- −$66 /mo · $798/yr
- HOA
- −$0
- Vacancy / Maint / Mgmt
- −$532
- Net cashflow
- $283
Break-even live
Sensitivity live
| Price | -10% $448 | -5% $366 | +0% $283 | +5% $201 | +10% $118 |
|---|---|---|---|---|---|
| Rent | -10% $83 | -5% $183 | +0% $283 | +5% $383 | +10% $483 |
| Rate | -1.0pp $404 | -0.5pp $344 | base $283 | +0.5pp $221 | +1.0pp $158 |
UW: 25.0% down · 7.5% · 30yr · 1.5% tax · 5.0% vac · 8.0% maint · 8.0% mgmt
Financing live
Cash to close
- Down payment
- $59,750
- Closing costs
- $7,170
- Reserves months
- —
- Total cash needed
- —
Loan-product check · same deal, 3 products live
Conventional
25% down · 7.5% · 30yr
- Down + closing
- —
- Monthly P&I
- —
- Monthly cashflow
- —
- DSCR
- —
- Eligible?
- —
Personal DTI + credit; lowest rate.
DSCR
20% down · 8.5% · 30yr
- Down + closing
- —
- Monthly P&I
- —
- Monthly cashflow
- —
- DSCR
- —
- Eligible?
- —
No personal income docs; deal must DSCR.
Hard money
10% down · 12.0% · 12mo
- Down + closing
- —
- Monthly P&I
- —
- Monthly cashflow
- —
- DSCR
- —
- Eligible?
- —
Short-term bridge; refi at stabilization.
Rent comps 1 comps
| Address | Beds | Baths | Sqft | Rent | $/sqft | DOM | Units | Dist |
|---|---|---|---|---|---|---|---|---|
| 2600 Netherland Ave Bronx, NY | 1.0–3.0 | 1.0–2.5 | 1132 | $2,775 | $2.45 | 23d | 3 | 0.26mi |
HOA detail condo
- Monthly dues
- $0 · $0/yr
- Likely covers
- water
- Assessments
- None detected in remarks — confirm with the listing agent.
Listing history 15 events
-
2026-06-21days on market $239,000 Active 36 DOM
-
2026-06-18days on market $239,000 Active 33 DOM
-
2026-06-17days on market $239,000 Active 32 DOM
-
2026-06-16days on market $239,000 Active 31 DOM
-
2026-06-15days on market $239,000 Active 30 DOM
-
2026-06-13days on market $239,000 Active 28 DOM
-
2026-06-10days on market $239,000 Active 24 DOM
-
2026-06-08days on market $239,000 Active 23 DOM
-
2026-06-08days on market $239,000 Active 22 DOM
-
2026-06-04days on market $239,000 Active 19 DOM
-
2026-06-03days on market $239,000 Active 18 DOM
-
2026-06-02days on market $239,000 Active 17 DOM
-
2026-06-01days on market $239,000 Active 16 DOM
-
2026-05-31days on market $239,000 Active 15 DOM
-
2026-05-16$239,000 Active
ⓘ Source: listings_history table (triggers on properties + properties_extension) + one-shot
backfill from property_details.listing_events for pre-trigger history.
Climate risk First Street
- Flood 8/10 Severe FEMA zone X (unshaded) · 78% chance over 30 yrs
- Wildfire 1/10 Low
- Heat 7/10 Severe 7 d/yr ≥99°F today · 15 d/yr by 30 yrs out
- Wind 6/10 Major 27% chance of damaging wind over 30 yrs
- Air quality 3/10 Moderate 3 unhealthy d/yr today · 4 by 30 yrs out
Nearby sold comps map
Loading sold comps map…
Walkable amenities ~0.75 mi
Loading nearby amenities…
Taxation est. · year 1
- Rental income
- $30,401
- − Mortgage interest
- −$13,388
- − Property taxes
- −$3,585
- − Insurance
- −$1,992
- − Repairs & maintenance
- −$2,432
- − Management
- −$2,432
- − Depreciation
- −$6,953
- Taxable loss
- −$381
- Est. tax savings @ 24.0%
- +$91
- After-tax cash flow
- $3,491/yr
For passive investors: Depreciation is non-cash, so a rental often shows a tax loss while cash-flowing — sheltering income. Rental losses are passive: they offset passive income freely, and up to $25,000/yr can offset ordinary (W-2) income if you actively participate and your MAGI is under $100k (phasing out to $0 by $150k); unused losses carry forward. On sale, claimed depreciation is recaptured at up to 25%, and gains may owe capital-gains tax (a 1031 exchange can defer both). Figures are a year-1 estimate at your 24.0% rate — not tax advice; consult a CPA.
Condition & rehab AI · 21 photos
This one-bedroom coop unit is in good condition with a fresh paint job and modern kitchen. It offers a good investment opportunity with potential for value increase through updates.
Value-add opportunities
- Both update kitchen appliances — modernizing kitchen can attract both buyers and renters
- Both paint exterior — fresh paint can improve curb appeal and value
- Both landscaping — improved landscaping can enhance curb appeal and attract more tenants
Renovation cost estimate screening
Value-add ROI direction
- Both update kitchen appliances — modernizing kitchen can attract both buyers and renters ↑
- Both paint exterior — fresh paint can improve curb appeal and value ↑
- Both landscaping — improved landscaping can enhance curb appeal and attract more tenants ↑
ⓘ Cost ranges are severity-bucket heuristics (US national rule-of-thumb). Get contractor quotes + a written scope before underwriting a rehab budget.
Schools (NCES district)
No district data.
Livability — New York
- Score
- 75/100
- State rank
- #268
- US rank
- #4188
Category grades
Schools grade is shown separately in the Schools card above.
Census & demographics
- Census place
- New York, NY
- County
- Bronx County · 1,197,324 people
- City population
- 7,731,280
- Metro
- New York-Newark-Jersey City, NY-NJ-PA
- Population (ZIP)
- 69,470
- Household income
- $74,974
- Rent vs Own
- Severe rent burden
- 5586.0
Population outlook (Bronx County) Hauer SSP2
- Today (2025)
- 1,607,353 people
- By 2030
- 1,681,852 · +4.6%
- By 2040
- 1,824,421 · +13.5%
- By 2050
- 1,945,470 · +21.0%
- By 2075
- 2,187,887 · +36.1%
- By 2100
- 2,244,136 · +39.6%
Race, ethnicity, and origin ACS 2023
- Neighborhood character
- Diverse neighborhood (Simpson 0.65)
- Race & ethnicity
- Hispanic / Latino 50% White 30% Two or more races 17% Black 12% Asian 4% Native American 2%
- Hispanic origin (detail)
- Mexican 3% Puerto Rican 12% Cuban 1% Dominican 25%
- Common ancestry
- Scotch-Irish 3% Romanian 2% Lithuanian 1%
- Foreign-born
- 30% · Canada, Jamaica, China
- Languages at home
- 50% English-only · Spanish 40% Other Indo-European 3% Russian/Polish/Slavic 2%
Political lean MEDSL · Bronx
- 2024 margin
- Solid D (+45.4) · D 72.7% · R 27.3%
- 2008→2024 swing
- -32.3pp toward R · 2008: 77.8pp · 2024: 45.4pp
- All cycles
- 2024: D+45.4 2020: D+67.6 2016: D+79.1 2012: D+82.9 2008: D+77.8
Not yet ingested
- Civics
- —
Market trends
- HPI YoY
- ▼ -294.75%
- Current HPI
- 168.0211
- Rent YoY
- ▲ 11.60%
- Metro
- New York-Newark-Jersey City, NY-NJ-PA
- State GDP YoY
- ▲ 2.60%
- F500 in state
- 92
Industry mix (Fortune 500 HQ in NY)
| Industry | F500 HQs | Revenue |
|---|---|---|
| Financial Services | 10 | $950B |
|
||
| Consumer Goods | 9 | $162B |
|
||
| Insurance | 4 | $225B |
|
||
| Telecommunications | 2 | $144B |
|
||
| Pharmaceuticals | 2 | $112B |
|
||
| Media / Entertainment | 2 | $69B |
|
||
Price history
1 event — show timeline
- 2026-05-16 Listed $239,000 OneKey® MLS as Distributed by MLS Grid
Cash-flow waterfall
monthlySold comps — $/sqft
last 12 mo · ≤1 miLoading sold comps…