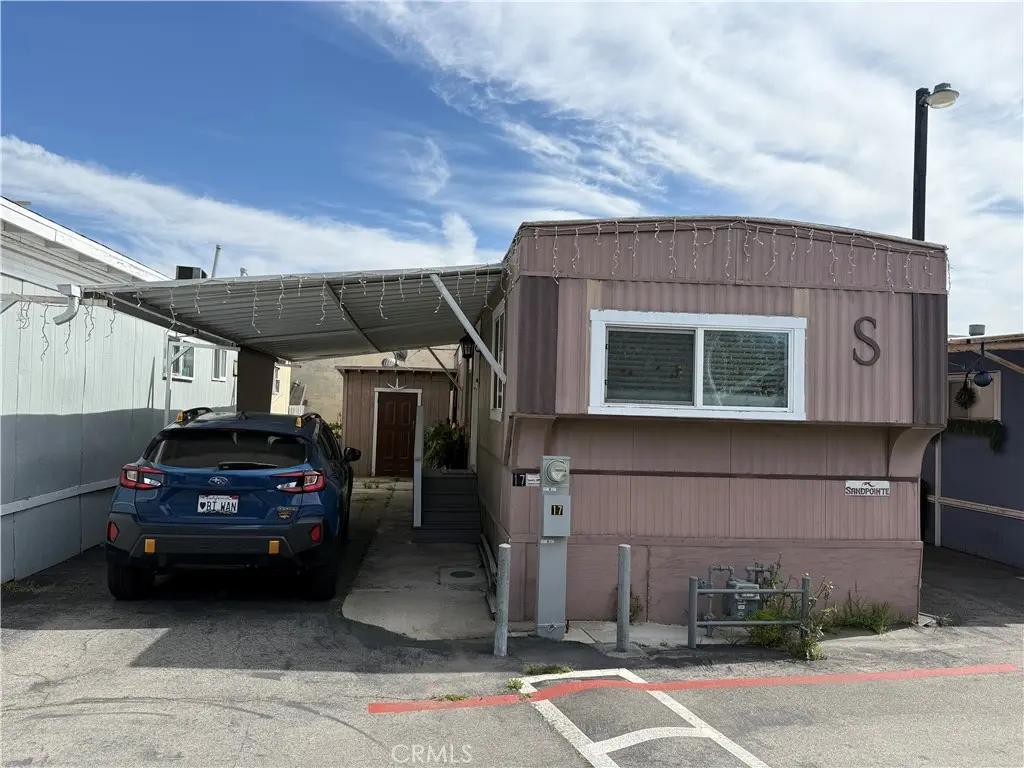
1618 W 132nd #17 · Gardena, CA
Flood risk 1/10 · Minimal
- FEMA flood zone
- X (unshaded)
- Chance of flooding over 30 yrs
- 0.0%
- Est. flood insurance / yr
- $507 – $1,088
Fire risk 1/10 · Minimal
- Est. fire insurance / yr
- $659 – $1,223
Heat risk 5/10 · Moderate
- Hot days now (above 87°F)
- 7 days/yr
- Hot days in 30 yrs
- 21 days/yr
Wind risk 1/10 · Minimal
- Chance of severe wind over 30 yrs
- —
Air-quality risk 5/10 · Moderate
- Unhealthy air days now
- 7 days/yr
- Unhealthy air days in 30 yrs
- 7 days/yr
Risk factors via First Street. Map © Google.
Why this score? — see what drove the B grade
The composite is a weighted blend of 9 inputs, each scored 0–100. Each bar is that input's sub-score; the figure is the points it added to the 100-point composite (weight × sub-score).
- Cash flow +30.0/30.0
- 1% rule +10.0/10.0
- DSCR +10.0/10.0
- ARV discount +7.5/15.0
- Condition / age +4.0/5.0
- Schools +3.6/10.0
- Livability +3.0/5.0
- Rent growth +2.5/5.0
- Appreciation +0.0/10.0
$110,000
🖨 Deal sheet (PDF) 📄 Offer letter ✓ Due diligence
Listing remarks MLS
This mobile home was recently REMODELED mobile home in 2024. This is a perfect starter home. Comes with 2 parking spaces, new kitchen and open concept. New paint flooring, upgraded bath, two car carport.
Key facts
- New kitchen
- Open concept
- Upgraded bath
Tags
Neighborhood map
What this means for you Summary
Snapshot
- This is a 1-bed/1.0-bath manufactured listed at $110k. Condition is rated good.
Deal economics
- At list price, monthly cash flow is $709 ($9k/yr) — positive.
- The deal already cash-flows at list — no discount required.
- Meets the 1% rule at list price ($2k rent vs $110k).
- Recommended offer: $97k (12.0% below list) — sets the bar for market timing.
- Cap rate 14.0% vs local median 2.9% in Gardena — top-decile yield for the area; either an underpriced asset or a hidden risk that comps aren't pricing in. Stress-test before assuming the spread holds.
Location & tenants
- Location reads 60/100 on livability (#604 in CA) — a middle-class / working-renter tenant base. Strengths: employment A-; Watch: amenities C-, crime F, cost of living F.
- Los Angeles Unified (urban): math 29% / reading 54% proficiency, ranked #223 of 517 in CA (top 43%) — families likely to look elsewhere, expect single-tenant / working-renter base with shorter leases; 67% free/reduced lunch — lower-income household profile, screen leases tightly.
- Zoned schools: One Hundred Thirty-Fifth Street Elementary (566 students, 93% FRL); Robert E. Peary Middle (1,164 students, 90% FRL); Gardena Senior High (math 17% / reading 45%, grade F, #702 of 1,170 statewide, top 61%, 1,560 students, 92% FRL) — zoned schools average 92% FRL vs 67% district-wide (24 pts higher); higher-poverty schools than district average — tighter screening recommended.
- Market conditions: 41 active listings in the ZIP; 40 comparable units currently listed for rent nearby; rentals at typical pace (median 17d on market — plan ~3-4 weeks tenant-placement turnaround); solid renter incomes; 19,697 units permitted in Los Angeles County in 2024 (9,426 in 5+ unit buildings).
Forward outlook
- Local home prices are declining (-3.0%/yr); year-one equity from $761 of loan paydown is wiped out by about $3k of value loss. Plan a longer hold.
- Los Angeles County population projected at +9% by 2050 — modest demand growth; plan on rents tracking national, not racing it.
- At projected returns (-3.0% appreciation + 3.0% rent growth), your $31k cash investment doubles in ~5 years — after that, you're playing with house money.
Negotiation context
- It's been on market 145 days — a 12% lower offer ($97k) is reasonable based on typical stale-listing flexibility.
- 3 sale attempts since 2y ago; this cycle's ask has dropped $19k (15%) from the opening price — seller is motivated, your offer sets the floor, not the list.
Risks & watch-outs
- Climate carrying-cost: extreme-heat days projected 7→21/yr by 2055 (HVAC capex compounding) — expect insurance premiums to compound above CPI over the hold.
Questions for the listing agent
- It's been on market 145 days. Have you received any prior offers? Is the seller open to a 12% concession, seller financing, or rate buy-down credit?
- Built in 1977 — when were the roof, HVAC, electrical panel, plumbing, and water heater last replaced?
- Why hasn't it sold? Are there any deal-killer items the seller is aware of (foundation, flood, title, zoning, code violations)?
- Is there a deadline driving the sale (1031 exchange, divorce, estate, relocation)? That informs how much negotiation room exists.
- Schools are D-rated, which usually means shorter tenancies and higher turnover. Who's the typical renter profile here, and what's been the actual vacancy rate?
- Crime grade is F in this area — have there been break-ins, vandalism, or insurance claims at this property in the last 3 years? What carrier currently insures it and at what premium?
- What's the average days-on-market for RENTAL listings here right now (not sales)? A rising rental-DOM trend means longer vacancies and softer asking-rent achievability than the comps imply.
- What's the recent tenant-quality profile in this submarket — average credit score on applications, eviction rate, late-payment / NSF rate, and stable-employment percentage? A property-management company in the area should have these aggregated.
- How much new for-sale + rental construction is in the pipeline within 1–3 miles? Heavy new supply typically softens prices + rents 12–24 months out; constrained supply supports both.
Investment metrics
- 1% rule
- 1.69% ✓
- Cap rate
- 14.03%
- Cash-on-cash
- 27.63%
- DSCR
- 2.23
- GRM
- 4.9
CMA / ARV
- ARV (median comp)
- $14,000
- List price
- $110,000
- Delta
- 685.71%
- Verdict
- OVERPRICED
- Comps
- 1 within 2.0 mi
Projected returns pro-forma
-3.0% appreciation · 3.0% rent growth · sell at horizon
- IRR
- 21.7%
- Equity multiple
- 1.89×
- Total profit
- $27,372
- Equity at exit
- $16,401
- IRR
- 29.8%
- Equity multiple
- 3.67×
- Total profit
- $82,110
- Equity at exit
- $9,511
Cash invested: $30,800 (down + closing). Projections, not guarantees.
Landlord ↔ Tenant lean methodology
- Overall (STATE)
- 18 Strongly Tenant-Friendly
- State California
- 18 Strongly Tenant-Friendly · D+13
- County
- — inherits STATE
- City
- — inherits STATE
ZIP-level market 90249
- Active inventory
- 41
- Price-to-rent
- 4.9×
Monthly cashflow live
- Estimated rent
- $1,860 high interval (Pro) →
- Mortgage (P&I)
- −$577
- Tax est. 1.5%
- −$138 /mo · $1,650/yr
- Insurance
- −$46
- HOA
- −$0
- Vacancy / Maint / Mgmt
- −$391
- Net cashflow
- $709
Break-even live
Sensitivity live
| Price | -10% $785 | -5% $747 | +0% $709 | +5% $671 | +10% $633 |
|---|---|---|---|---|---|
| Rent | -10% $562 | -5% $636 | +0% $709 | +5% $783 | +10% $856 |
| Rate | -1.0pp $765 | -0.5pp $737 | base $709 | +0.5pp $681 | +1.0pp $652 |
UW: 25.0% down · 7.5% · 30yr · 1.5% tax · 5.0% vac · 8.0% maint · 8.0% mgmt
Financing live
Cash to close
- Down payment
- $27,500
- Closing costs
- $3,300
- Reserves months
- —
- Total cash needed
- —
Loan-product check · same deal, 3 products live
Conventional
25% down · 7.5% · 30yr
- Down + closing
- —
- Monthly P&I
- —
- Monthly cashflow
- —
- DSCR
- —
- Eligible?
- —
Personal DTI + credit; lowest rate.
DSCR
20% down · 8.5% · 30yr
- Down + closing
- —
- Monthly P&I
- —
- Monthly cashflow
- —
- DSCR
- —
- Eligible?
- —
No personal income docs; deal must DSCR.
Hard money
10% down · 12.0% · 12mo
- Down + closing
- —
- Monthly P&I
- —
- Monthly cashflow
- —
- DSCR
- —
- Eligible?
- —
Short-term bridge; refi at stabilization.
Rent comps 40 comps
| Address | Beds | Baths | Sqft | Rent | $/sqft | DOM | Units | Dist |
|---|---|---|---|---|---|---|---|---|
| 1834 W El Segundo Blvd Gardena, CA | 1.0 | 1.0 | 708 | $1,765 | $2.49 | 45d | 1 | 0.45mi |
| 13919 S Normandie Ave Gardena, CA | — | 1.0 | 478 | $1,960 | $4.10 | 5d | 2 | 0.52mi |
| 13921 S Normandie Ave Gardena, CA | 1.0 | 1.0 | 360 | $1,445 | $4.01 | 1d | 2 | 0.54mi |
| 13921 S Normandie Ave Gardena, CA | — | 1.0 | 360 | $1,455 | $4.04 | 45d | 1 | 0.54mi |
| 2110 W El Segundo Blvd Unit 3 Gardena, CA | 1.0 | 1.0 | 690 | $1,695 | $2.46 | 46d | 1 | 0.67mi |
| 2126 W El Segundo Blvd Gardena, CA | 1.0–2.0 | 1.0 | 557 | $1,795 | $3.22 | 1d | 1 | 0.71mi |
| 1261 W Rosecrans Ave Gardena, CA | 2.0 | 1.0 | 718 | $2,250 | $3.13 | 3d | 4 | 0.81mi |
| 13609 Van Ness Ave Unit 2 Gardena, CA | 2.0 | 1.0 | 700 | $1,950 | $2.79 | 45d | 1 | 0.81mi |
| 1540 W 145th St Gardena, CA | — | 1.0 | 700 | $1,480 | $2.11 | 16d | 1 | 0.82mi |
| 2300 W El Segundo Blvd Unit 19 Gardena, CA | 1.0 | 1.0 | 650 | $1,795 | $2.76 | 7d | 1 | 0.83mi |
| 1246 W 144th St Unit 5 Gardena, CA | 2.0 | 1.5 | 702 | $2,400 | $3.42 | 26d | 1 | 0.85mi |
| 13801 Van Ness Ave Gardena, CA | 1.0–2.0 | 1.0 | 825 | $1,925 | $2.33 | 9d | 3 | 0.85mi |
| 1735 W 120th St Los Angeles, CA | 1.0 | 1.0 | 470 | $1,695 | $3.61 | 9d | 1 | 0.86mi |
| 1735 W 120th St Unit 1731-8 Los Angeles, CA | 1.0 | 1.0 | 470 | $1,695 | $3.61 | 4d | 1 | 0.86mi |
| 1745 W 120th St Los Angeles, CA | 1.0 | 1.0 | 470 | $1,695 | $3.61 | 12d | 1 | 0.87mi |
| 1140 W 120th St Unit 8 Los Angeles, CA | 2.0 | 1.0 | 585 | $1,800 | $3.08 | 19d | 1 | 0.95mi |
| 14417 Vermont Ave Unit 0034 Gardena, CA | 1.0 | 1.0 | 500 | $1,495 | $2.99 | 16d | 1 | 1.07mi |
| 2804 W El Segundo Blvd Apt 2 Gardena, CA | 1.0 | 1.0 | 605 | $1,795 | $2.97 | 3d | 1 | 1.09mi |
| 2616 W 141st Pl Gardena, CA | 1.0 | 1.0 | 650 | $1,850 | $2.85 | 45d | 1 | 1.17mi |
| 14719 Berendo Ave Unit 3 Gardena, CA | 2.0 | 1.0 | 648 | $1,934 | $2.98 | 17d | 1 | 1.17mi |
| 14719 S Berendo Ave Gardena, CA | 2.0 | 1.0 | 648 | $1,934 | $2.98 | 7d | 1 | 1.17mi |
| 14719 Berendo Ave Apt 8 Gardena, CA | 1.0 | 1.0 | 649 | $1,657 | $2.55 | 45d | 1 | 1.17mi |
| 2620 141st Pl #6 Gardena, CA | 1.0 | 1.0 | 750 | $1,725 | $2.30 | 9d | 1 | 1.18mi |
| 1709 Marine Ave Unit 1 Gardena, CA | 1.0 | 1.0 | 370 | $1,750 | $4.73 | 19d | 1 | 1.19mi |
| 1709 Marine Ave Unit 1 Gardena, CA | 1.0 | 1.0 | 400 | $1,750 | $4.38 | 15d | 1 | 1.19mi |
| 2936 W El Segundo Blvd Unit 02 Gardena, CA | 1.0 | 1.0 | 640 | $1,850 | $2.89 | 45d | 1 | 1.20mi |
| 2936 W El Segundo Blvd Unit 02 Gardena, CA | 1.0 | 1.0 | 640 | $1,795 | $2.80 | 7d | 1 | 1.20mi |
| 2708 141st Pl Unit 4 Gardena, CA | 2.0 | 1.0 | 750 | $2,200 | $2.93 | 1d | 1 | 1.20mi |
| 2708 141st Pl Unit 3 Gardena, CA | 2.0 | 1.0 | 750 | $2,150 | $2.87 | 45d | 1 | 1.20mi |
| 2708 141st Pl Apt 5 Gardena, CA | 1.0 | 1.0 | 500 | $1,595 | $3.19 | 26d | 1 | 1.20mi |
| 2800 W 141st Pl Gardena, CA | 1.0 | 1.0 | 577 | $1,850 | $3.21 | 45d | 1 | 1.23mi |
| 14800 Berendo Ave Apt 1 Gardena, CA | 1.0 | 1.0 | 450 | $1,695 | $3.77 | 16d | 1 | 1.23mi |
| 12888 Crenshaw Blvd Gardena, CA | 2.0 | 1.0–2.0 | 891 | $3,533 | $3.97 | 3d | 105 | 1.24mi |
| 1060 W 117th St Los Angeles, CA | 1.0 | 1.0 | 650 | $1,900 | $2.92 | 18d | 1 | 1.24mi |
| 15120 S Normandie Ave Gardena, CA | — | 1.0 | 426 | $1,826 | $4.28 | 3d | 3 | 1.29mi |
| 2931 W 141st Pl Gardena, CA | — | 1.0 | 565 | $2,295 | $4.06 | 45d | 1 | 1.31mi |
| 2931 W 141st Pl Gardena, CA | — | — | 565 | $2,295 | $4.06 | 23d | 1 | 1.31mi |
| 12530 S Crenshaw Blvd Hawthorne, CA | 1.0–2.0 | 1.0–2.0 | 897 | $2,625 | $2.93 | 1d | 6 | 1.31mi |
| 2909 W Rosecrans Ave Apt 4 Gardena, CA | 1.0 | 1.0 | 750 | $1,750 | $2.33 | 45d | 1 | 1.32mi |
| 2935 W 141st Pl Gardena, CA | — | — | 565 | $2,495 | $4.42 | 9d | 1 | 1.32mi |
Listing history 22 events
-
2026-06-21days on market $110,000 Active 145 DOM
-
2026-06-18days on market $110,000 Active 142 DOM
-
2026-06-17days on market $110,000 Active 141 DOM
-
2026-06-16days on market $110,000 Active 140 DOM
-
2026-06-15days on market $110,000 Active 139 DOM
-
2026-06-13days on market $110,000 Active 137 DOM
-
2026-06-09days on market $110,000 Active 133 DOM
-
2026-06-08days on market $110,000 Active 132 DOM
-
2026-06-07days on market $110,000 Active 131 DOM
-
2026-06-04days on market $110,000 Active 128 DOM
-
2026-06-03days on market $110,000 Active 127 DOM
-
2026-06-02days on market $110,000 Active 126 DOM
-
2026-06-01days on market $110,000 Active 125 DOM
-
2026-05-31days on market $110,000 Active 124 DOM
-
2026-05-07price $110,000 203-char remark
Show marketing remark (203 chars)
This mobile home was recently REMODELED mobile home in 2024. This is a perfect starter home. Comes with 2 parking spaces, new kitchen and open concept. New paint flooring, upgraded bath, two car carport.
-
2026-01-27$129,000 Active 203-char remark
Show marketing remark (203 chars)
This mobile home was recently REMODELED mobile home in 2024. This is a perfect starter home. Comes with 2 parking spaces, new kitchen and open concept. New paint flooring, upgraded bath, two car carport.
-
2025-12-05historical
-
2025-06-14price $129,000
-
2025-05-07$134,000 Active
-
2024-11-08soldstatus $110,000 Closed Sale
-
2024-10-02historical Active Under Contract
-
2024-09-06$110,000 Active
ⓘ Source: listings_history table (triggers on properties + properties_extension) + one-shot
backfill from property_details.listing_events for pre-trigger history.
Climate risk First Street
- Flood 1/10 Low FEMA zone X (unshaded) · 0% chance over 30 yrs
- Wildfire 1/10 Low
- Heat 5/10 Major 7 d/yr ≥87°F today · 21 d/yr by 30 yrs out
- Wind 1/10 Low
- Air quality 5/10 Major 7 unhealthy d/yr today · 7 by 30 yrs out
Nearby sold comps map
Loading sold comps map…
Walkable amenities ~0.75 mi
Loading nearby amenities…
Taxation est. · year 1
- Rental income
- $22,320
- − Mortgage interest
- −$6,162
- − Property taxes
- −$1,650
- − Insurance
- −$550
- − Repairs & maintenance
- −$1,786
- − Management
- −$1,786
- − Depreciation
- −$3,200
- Taxable income
- $7,187
- Est. tax owed @ 24.0%
- −$1,725
- After-tax cash flow
- $6,785/yr
For passive investors: Depreciation is non-cash, so a rental often shows a tax loss while cash-flowing — sheltering income. Rental losses are passive: they offset passive income freely, and up to $25,000/yr can offset ordinary (W-2) income if you actively participate and your MAGI is under $100k (phasing out to $0 by $150k); unused losses carry forward. On sale, claimed depreciation is recaptured at up to 25%, and gains may owe capital-gains tax (a 1031 exchange can defer both). Figures are a year-1 estimate at your 24.0% rate — not tax advice; consult a CPA.
Condition & rehab AI · 13 photos
This mobile home is in good condition with recent cosmetic updates. It has a good foundation and structure, and the interior is well-maintained. The property has a good curb appeal and is move-in ready.
Value-add opportunities
- Both Paint the exterior siding — Enhances curb appeal and property value
- Both Upgrade the flooring in the kitchen and bathroom — Modernizes the space and adds value
- Both Install new windows — Improves energy efficiency and enhances curb appeal
Renovation cost estimate screening
Value-add ROI direction
- Both Paint the exterior siding — Enhances curb appeal and property value ↑
- Both Upgrade the flooring in the kitchen and bathroom — Modernizes the space and adds value ↑
- Both Install new windows — Improves energy efficiency and enhances curb appeal ↑
ⓘ Cost ranges are severity-bucket heuristics (US national rule-of-thumb). Get contractor quotes + a written scope before underwriting a rehab budget.
Schools (NCES district)
- District
- Los Angeles Unified
- NCES district ID
- 0622710
- Math proficiency
- 29% ▼ -4.00%
- Reading proficiency
- 54% ▲ 10.00%
- Median HH income
- $50,403
- Composite
- 35.67/100
- National rank
- #4875
- State rank
- #223 of 517 in CA
Livability — Gardena
- Score
- 60/100
- State rank
- #604
- US rank
- #19337
Category grades
Schools grade is shown separately in the Schools card above.
Census & demographics
- Census place
- Gardena, CA
- County
- Los Angeles County · 9,444,647 people
- City population
- 73,343
- Metro
- Los Angeles-Long Beach-Anaheim, CA
- Population (ZIP)
- 26,290
- Household income
- $89,712
- Rent vs Own
- Severe rent burden
- 1117.0
Population outlook (Los Angeles County) Hauer SSP2
- Today (2025)
- 10,940,515 people
- By 2030
- 11,256,481 · +2.9%
- By 2040
- 11,729,929 · +7.2%
- By 2050
- 11,948,407 · +9.2%
- By 2075
- 11,818,114 · +8.0%
- By 2100
- 10,842,928 · -0.9%
Race, ethnicity, and origin ACS 2023
- Neighborhood character
- Highly diverse neighborhood (Simpson 0.70)
- Race & ethnicity
- Hispanic / Latino 46% Black 23% Two or more races 18% Asian 15% White 11% Native American 3%
- Hispanic origin (detail)
- Mexican 32%
- Common ancestry
- Italian 1% Hispanic 1% Slovak 1%
- Foreign-born
- 31% · Canada, Vietnam, South Korea
- Languages at home
- 52% English-only · Spanish 33% Vietnamese 3% Korean 2%
Political lean MEDSL · Los Angeles
- 2024 margin
- Solid D (+32.9) · D 64.8% · R 31.9% · Other 3.3%
- 2008→2024 swing
- -7.4pp toward R · 2008: 40.4pp · 2024: 32.9pp
- All cycles
- 2024: D+32.9 2020: D+44.2 2016: D+48.0 2012: D+40.0 2008: D+40.4
Not yet ingested
- Civics
- —
Market trends
- HPI YoY
- ▼ -796.51%
- Current HPI
- 387.1566
- Rent YoY
- —
- Metro
- Los Angeles-Long Beach-Anaheim, CA
- State GDP YoY
- ▲ 3.21%
- F500 in state
- 116
Industry mix (Fortune 500 HQ in CA)
| Industry | F500 HQs | Revenue |
|---|---|---|
| Technology | 27 | $1,492B |
|
||
| Financial Services | 3 | $174B |
|
||
| Retail | 3 | $44B |
|
||
| Insurance | 3 | $26B |
|
||
| Media / Entertainment | 2 | $115B |
|
||
| Pharmaceuticals / Biotech | 2 | $62B |
|
||
Price history
+0.0% since first listed8 events — show timeline
- 2026-05-07 Price Changed $110,000 CRMLS
- 2026-01-27 Listed $129,000 CRMLS
- 2025-12-05 Listing Removed — CRMLS
- 2025-06-14 Price Changed $129,000 CRMLS
- 2025-05-07 Listed $134,000 CRMLS
- 2024-11-08 Sold (MLS) $110,000 CRMLS
- 2024-10-02 Contingent — CRMLS
- 2024-09-06 Listed $110,000 CRMLS
Cash-flow waterfall
monthlySold comps — $/sqft
last 12 mo · ≤1 miLoading sold comps…