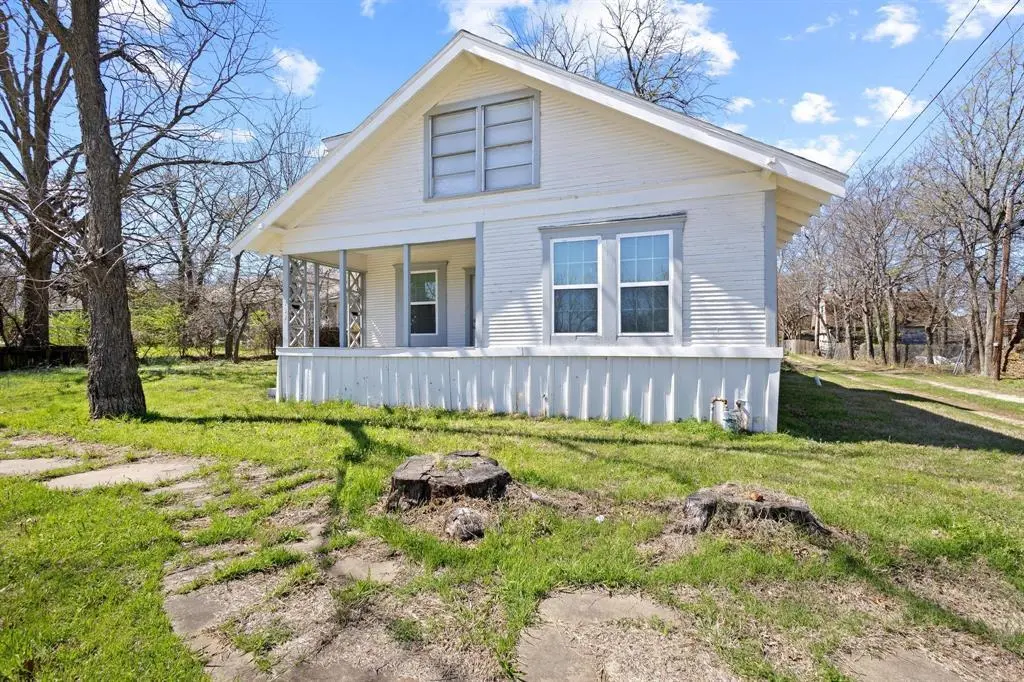
709 N Chandler Ave · Denison, TX
Flood risk 1/10 · Minimal
- FEMA flood zone
- X (unshaded)
- Chance of flooding over 30 yrs
- 0.0%
- Est. flood insurance / yr
- $507 – $1,088
Fire risk 4/10 · Minor
- Est. fire insurance / yr
- $1,222 – $2,270
Heat risk 6/10 · Moderate
- Hot days now (above 109°F)
- 7 days/yr
- Hot days in 30 yrs
- 21 days/yr
Wind risk 4/10 · Minor
- Chance of severe wind over 30 yrs
- 20.0%
Air-quality risk 3/10 · Minor
- Unhealthy air days now
- 3 days/yr
- Unhealthy air days in 30 yrs
- 3 days/yr
Risk factors via First Street. Map © Google.
Why this score? — see what drove the C- grade
The composite is a weighted blend of 9 inputs, each scored 0–100. Each bar is that input's sub-score; the figure is the points it added to the 100-point composite (weight × sub-score).
- Cash flow +15.3/30.0
- ARV discount +15.0/15.0
- 1% rule +5.0/10.0
- DSCR +4.7/10.0
- Schools +3.7/10.0
- Livability +3.7/5.0
- Rent growth +2.5/5.0
- Condition / age +2.5/5.0
- Appreciation +0.0/10.0
$169,999
🖨 Deal sheet 📄 Offer letter ✓ Due diligence
Listing remarks MLS
Seller is OFFERING $10,000 in SELLER CONCESSIONS with an appropriate offer. Built in 1940, this 1,784 sq ft home sits on a desirable corner lot and offers 4 bedrooms, 2 baths, and a flexible office space that could also be used as a dining room. The kitchen features an eat-in area for casual meals. The additional lot to the right of the home is part of the property, providing extra space and the opportunity to expand the home or add improvements. Located just minutes from downtown Denison, the property offers convenient access to shopping, dining, and local amenities. Being sold as is, this property presents a strong opportunity for investors or buyers looking to renovate and add value.
Key facts
- Eat-in area
- Convenient access
- 8,999 sq ft lot
Tags
Neighborhood map
What this means for you Summary
Snapshot
- This is a 4-bed/2.0-bath single-family listed at $170k.
Deal economics
- At list price, monthly cash flow is $61 ($730/yr) — positive.
- The deal already cash-flows at list — no discount required.
- To meet the 1% rule (rent ≥ 1% of price), the offer needs to be $169k (0.4% below list).
- Recommended offer: $160k (6.0% below list) — sets the bar for market timing.
- Cap rate 6.7% vs local median 3.8% in Denison — top-decile yield for the area; either an underpriced asset or a hidden risk that comps aren't pricing in. Stress-test before assuming the spread holds.
Location & tenants
- Location reads 73/100 on livability (#221 in TX) — a middle-class / working-renter tenant base. Strengths: cost of living A+, housing A+, crime A; Watch: health & safety D+, schools D-, amenities F.
- Denison ISD (urban): math 43% / reading 44% proficiency, ranked #315 of 826 in TX (top 38%) — families likely to look elsewhere, expect single-tenant / working-renter base with shorter leases.
- Market conditions: Rents flat; 485 active listings in the ZIP; 23 comparable units currently listed for rent nearby; rentals lingering (median 44d on market — plan ~5-8 weeks vacancy on turnover, expect pricing pressure); 74% of comp listings sitting > 30 days — soft ceiling on asking rent; 2,272 units permitted in Grayson County in 2024 (750 in 5+ unit buildings).
Forward outlook
- Local home prices are declining (-3.0%/yr); year-one equity from $1k of loan paydown is wiped out by about $5k of value loss. Plan a longer hold.
- Grayson County population projected at +12% by 2050 — modest demand growth; plan on rents tracking national, not racing it.
Negotiation context
- It's been on market 86 days — a 6% lower offer ($160k) is reasonable based on typical stale-listing flexibility.
- 4 sale attempts since 20y ago; this cycle's ask has dropped $9k (5%) from the opening price — seller is motivated, your offer sets the floor, not the list.
Risks & watch-outs
- Watch-outs: built in 1940 — expect roof / HVAC / electrical / plumbing capex.
- Climate carrying-cost: extreme-heat days projected 7→21/yr by 2055 (HVAC capex compounding) — expect insurance premiums to compound above CPI over the hold.
Questions for the listing agent
- It's been on market 86 days. Have you received any prior offers? Is the seller open to a 6% concession, seller financing, or rate buy-down credit?
- Built in 1940 — when were the roof, HVAC, electrical panel, plumbing, and water heater last replaced?
- Why hasn't it sold? Are there any deal-killer items the seller is aware of (foundation, flood, title, zoning, code violations)?
- Is there a deadline driving the sale (1031 exchange, divorce, estate, relocation)? That informs how much negotiation room exists.
- Schools are D-rated, which usually means shorter tenancies and higher turnover. Who's the typical renter profile here, and what's been the actual vacancy rate?
- What's the average days-on-market for RENTAL listings here right now (not sales)? A rising rental-DOM trend means longer vacancies and softer asking-rent achievability than the comps imply.
- What's the recent tenant-quality profile in this submarket — average credit score on applications, eviction rate, late-payment / NSF rate, and stable-employment percentage? A property-management company in the area should have these aggregated.
- How much new for-sale + rental construction is in the pipeline within 1–3 miles? Heavy new supply typically softens prices + rents 12–24 months out; constrained supply supports both.
Investment metrics
- 1% rule
- 1.00% ✗
- Cap rate
- 6.72%
- Cash-on-cash
- 1.53%
- DSCR
- 1.07
- GRM
- 8.4
CMA / ARV
- ARV (median comp)
- $216,946
- List price
- $169,999
- Delta
- -21.64%
- Verdict
- UNDERPRICED
- Comps
- 20 within 1.0 mi
Show comp detail 12 sales within ~0.75 mi
| Address | Dist | Beds/Ba | Sqft | Sold | Price | $/sf | Match |
|---|---|---|---|---|---|---|---|
| 1309 W Morton St | 0.33mi | 4/2.0 | 1,739 (-2%) | 5mo | $125,000 | $72 | 76 |
| 826 W Morton St | 0.23mi | 3/2.0 (-1) | 1,625 (-9%) | 1mo | $239,000 | $147 | 68 |
| 409 W Johnson St | 0.52mi | 3/3.0 (-1) | 1,792 (+0%) | 2mo | $265,000 | $148 | 64 |
| 1111 W Main St | 0.46mi | 3/2.0 (-1) | 1,860 (+4%) | 4mo | $339,000 | $182 | 63 |
| 205 W Bond St | 0.71mi | 4/2.0 | 1,847 (+4%) | 1mo | $174,000 | $94 | 60 |
| 1117 W Bond St | 0.15mi | 3/2.0 (-1) | 1,568 (-12%) | 10mo | $215,000 | $137 | 59 |
| 610 W Chestnut St | 0.65mi | 3/2.0 (-1) | 1,766 (-1%) | 9mo | $250,000 | $142 | 55 |
| 1208 W Sears St | 0.34mi | 3/1.5 (-1) | 1,584 (-11%) | 7mo | $160,000 | $101 | 53 |
| 727 W Parnell St | 0.35mi | 3/2.0 (-1) | 1,525 (-14%) | 4mo | $215,000 | $141 | 52 |
| 215 W Sears St | 0.72mi | 4/2.0 | 1,659 (-7%) | 5mo | $134,900 | $81 | 51 |
| 1515 W Main St | 0.65mi | 3/2.5 (-1) | 1,730 (-3%) | 8mo | $314,000 | $182 | 51 |
| 1721 W Washington St | 0.70mi | 3/3.5 (-1) | 1,689 (-5%) | 8mo | $349,000 | $207 | 40 |
Match score weights: distance 35% · size 25% · config 20% · recency 20%. Top-matched comps best support the ARV.
Projected returns pro-forma
-3.0% appreciation · 0.05% rent growth · sell at horizon
- IRR
- -17.5%
- Equity multiple
- 0.40×
- Total profit
- $-28,468
- Equity at exit
- $25,347
- IRR
- -17.1%
- Equity multiple
- 0.19×
- Total profit
- $-38,331
- Equity at exit
- $14,698
Cash invested: $47,600 (down + closing). Projections, not guarantees.
Landlord ↔ Tenant lean methodology
- Overall (STATE)
- 87 Strongly Landlord-Friendly
- State Texas
- 87 Strongly Landlord-Friendly · R+5
- County
- — inherits STATE
- City
- — inherits STATE
ZIP-level market 75020
- Rents YoY
- 0.1%
- Active inventory
- 485
- Price-to-rent
- 8.4×
Monthly cashflow live
- Estimated rent
- $1,694 high interval (Pro) →
- Mortgage (P&I)
- −$891
- Tax from tax record
- −$315 /mo · $3,777/yr
- Insurance
- −$71
- HOA
- −$0
- Vacancy / Maint / Mgmt
- −$356
- Net cashflow
- $61
Break-even live
UW: 25.0% down · 7.5% · 30yr · 1.5% tax · 5.0% vac · 8.0% maint · 8.0% mgmt
Financing live
Cash to close
- Down payment
- $42,500
- Closing costs
- $5,100
- Reserves months
- —
- Total cash needed
- —
Loan-product check · same deal, 3 products live
Conventional
25% down · 7.5% · 30yr
- Down + closing
- —
- Monthly P&I
- —
- Monthly cashflow
- —
- DSCR
- —
- Eligible?
- —
Personal DTI + credit; lowest rate.
DSCR
20% down · 8.5% · 30yr
- Down + closing
- —
- Monthly P&I
- —
- Monthly cashflow
- —
- DSCR
- —
- Eligible?
- —
No personal income docs; deal must DSCR.
Hard money
10% down · 12.0% · 12mo
- Down + closing
- —
- Monthly P&I
- —
- Monthly cashflow
- —
- DSCR
- —
- Eligible?
- —
Short-term bridge; refi at stabilization.
Rent comps 23 comps
| Address | Beds | Baths | Sqft | Rent | $/sqft | DOM | Units | Dist |
|---|---|---|---|---|---|---|---|---|
| 727 W Johnson St Unit A Denison, TX | 3.0 | 2.5 | 1238 | $1,450 | $1.17 | 43d | 1 | 0.20mi |
| 731 W Bond St Denison, TX | 3.0 | 2.0 | 1297 | $1,595 | $1.23 | 21d | 1 | 0.23mi |
| 731 W Morton St Denison, TX | 3.0 | 2.0 | 1298 | $1,500 | $1.16 | 43d | 1 | 0.27mi |
| 613 W Elm St Unit 613 Denison, TX | 3.0 | 2.0 | 1375 | $1,525 | $1.11 | 44d | 1 | 0.34mi |
| 527 W Walker St Denison, TX | 3.0 | 2.0 | 1300 | $1,675 | $1.29 | 43d | 1 | 0.37mi |
| 1004 W Gandy St Denison, TX | 3.0 | 1.0 | 1250 | $1,299 | $1.04 | 21d | 1 | 0.37mi |
| 401 W Elm St Denison, TX | 3.0 | 2.5 | 1506 | $1,850 | $1.23 | 43d | 1 | 0.54mi |
| 900 W Chestnut St Denison, TX | 3.0 | 2.0 | 1742 | $1,695 | $0.97 | 43d | 1 | 0.59mi |
| 320 W Bond St Denison, TX | 3.0 | 2.0 | 1278 | $1,500 | $1.17 | 44d | 1 | 0.59mi |
| 226 W Bond St Unit 224 Denison, TX | 3.0 | 2.5 | 1294 | $1,375 | $1.06 | 43d | 1 | 0.67mi |
| 224 W Bond St Denison, TX | 3.0 | 2.5 | 1294 | $1,375 | $1.06 | 43d | 1 | 0.67mi |
| 411 S Fannin Ave #411 Denison, TX | 3.0 | 2.5 | 1322 | $1,450 | $1.10 | 21d | 1 | 0.85mi |
| 1022 W Shepherd St #1022 Denison, TX | 3.0 | 2.5 | 1322 | $1,450 | $1.10 | 21d | 1 | 0.93mi |
| 212 E Walker St Denison, TX | 3.0 | 2.0 | 1260 | $1,695 | $1.35 | 43d | 1 | 0.95mi |
| 1011 S Armstrong Ave Unit B Denison, TX | 3.0 | 2.0 | 2068 | $1,800 | $0.87 | 43d | 1 | 1.19mi |
| 430 E Woodard St Denison, TX | 3.0 | 2.0 | 1263 | $1,590 | $1.26 | 43d | 1 | 1.26mi |
| 1012 S Maurice Ave Denison, TX | 3.0 | 2.0 | 1600 | $1,895 | $1.18 | 43d | 1 | 1.26mi |
| 521 E Sears St Denison, TX | 4.0 | 2.0 | 1401 | $1,650 | $1.18 | 43d | 1 | 1.27mi |
| 313 E Nelson St Denison, TX | 3.0 | 2.0 | 1279 | $1,625 | $1.27 | 21d | 1 | 1.31mi |
| 327-329 E Nelson St #329 Denison, TX | 3.0 | 2.0 | 1382 | $1,625 | $1.18 | 43d | 1 | 1.34mi |
| 1035-1033 Ray Dr Denison, TX | 3.0 | 3.0 | 1328 | $1,450 | $1.09 | 43d | 1 | 1.43mi |
| 713 E Sears St Denison, TX | 3.0 | 2.0 | 1230 | $1,475 | $1.20 | 21d | 1 | 1.46mi |
| 809 S Travis Ave Denison, TX | 3.0 | 2.0 | 1490 | $1,595 | $1.07 | 43d | 1 | 1.46mi |
Listing history 26 events
-
2026-06-09days on market $169,999 Active 86 DOM
-
2026-06-08days on market $169,999 Active 85 DOM
-
2026-06-07days on market $169,999 Active 84 DOM
-
2026-06-05days on market $169,999 Active 81 DOM
-
2026-06-03days on market $169,999 Active 80 DOM
-
2026-06-02days on market $169,999 Active 79 DOM
-
2026-06-01days on market $169,999 Active 78 DOM
-
2026-05-31days on market $169,999 Active 77 DOM
-
2026-05-30days on market $169,999 Active 76 DOM
-
2026-05-18price $169,999 695-char remark
Show marketing remark (695 chars)
Seller is OFFERING $10,000 in SELLER CONCESSIONS with an appropriate offer. Built in 1940, this 1,784 sq ft home sits on a desirable corner lot and offers 4 bedrooms, 2 baths, and a flexible office space that could also be used as a dining room. The kitchen features an eat-in area for casual meals. The additional lot to the right of the home is part of the property, providing extra space and the opportunity to expand the home or add improvements. Located just minutes from downtown Denison, the property offers convenient access to shopping, dining, and local amenities. Being sold as is, this property presents a strong opportunity for investors or buyers looking to renovate and add value.
-
2026-03-14$179,000 Active 695-char remark
Show marketing remark (695 chars)
Seller is OFFERING $10,000 in SELLER CONCESSIONS with an appropriate offer. Built in 1940, this 1,784 sq ft home sits on a desirable corner lot and offers 4 bedrooms, 2 baths, and a flexible office space that could also be used as a dining room. The kitchen features an eat-in area for casual meals. The additional lot to the right of the home is part of the property, providing extra space and the opportunity to expand the home or add improvements. Located just minutes from downtown Denison, the property offers convenient access to shopping, dining, and local amenities. Being sold as is, this property presents a strong opportunity for investors or buyers looking to renovate and add value.
-
2024-09-19soldstatus
-
2021-11-03soldstatus
-
2018-02-01historical
-
2017-12-20soldstatus
-
2017-11-30$79,000 Active
-
2016-09-12soldstatus
-
2016-08-29soldstatus
-
2012-11-28soldstatus Closed
-
2012-11-02status Pending
-
2012-10-17price $16,150
-
2012-09-07$19,000 Active
-
2006-12-14soldstatus
-
2006-11-16historical
-
2006-07-15$45,000
-
1992-01-03soldstatus
ⓘ Source: listings_history table (triggers on properties + properties_extension) + one-shot
backfill from property_details.listing_events for pre-trigger history.
Tax reassessment forecast TX · Resets to sale price
- Current annual tax
- $3,777 · $315/mo
- Projected year-2 tax
- $3,777 · $315/mo
- Expected delta
- $0/yr ($0/mo · 0.0%)
ⓘ Screening estimate from a state-policy table — verify with the county assessor before closing.
Climate risk First Street
- Flood 1/10 Low FEMA zone X (unshaded) · 0% chance over 30 yrs
- Wildfire 4/10 Moderate
- Heat 6/10 Major 7 d/yr ≥109°F today · 21 d/yr by 30 yrs out
- Wind 4/10 Moderate 20% chance of damaging wind over 30 yrs
- Air quality 3/10 Moderate 3 unhealthy d/yr today · 3 by 30 yrs out
Nearby sold comps map
Loading sold comps map…
Walkable amenities ~0.75 mi
Loading nearby amenities…
Taxation est. · year 1
- Rental income
- $20,322
- − Mortgage interest
- −$9,523
- − Property taxes
- −$3,777
- − Insurance
- −$850
- − Repairs & maintenance
- −$1,626
- − Management
- −$1,626
- − Depreciation
- −$4,945
- Taxable loss
- −$2,024
- Est. tax savings @ 24.0%
- +$486
- After-tax cash flow
- $1,216/yr
For passive investors: Depreciation is non-cash, so a rental often shows a tax loss while cash-flowing — sheltering income. Rental losses are passive: they offset passive income freely, and up to $25,000/yr can offset ordinary (W-2) income if you actively participate and your MAGI is under $100k (phasing out to $0 by $150k); unused losses carry forward. On sale, claimed depreciation is recaptured at up to 25%, and gains may owe capital-gains tax (a 1031 exchange can defer both). Figures are a year-1 estimate at your 24.0% rate — not tax advice; consult a CPA.
Schools (NCES district)
- District
- Denison ISD
- NCES district ID
- 4816710
- Math proficiency
- 43% ▼ -7.00%
- Reading proficiency
- 44% ▼ -3.00%
- Median HH income
- $41,650
- Composite
- 36.6/100
- National rank
- #4629
- State rank
- #315 of 826 in TX
Livability — Denison
- Score
- 73/100
- State rank
- #221
- US rank
- #5428
Category grades
Schools grade is shown separately in the Schools card above.
Census & demographics
- Census place
- Denison, TX
- County
- Grayson County · 108,053 people
- City population
- 34,008
- Metro
- Sherman-Denison, TX
- Population (ZIP)
- 24,835
- Household income
- $71,605
- Rent vs Own
- Severe rent burden
- 997.0
Population outlook (Grayson County) Hauer SSP2
- Today (2025)
- 134,540 people
- By 2030
- 138,653 · +3.1%
- By 2040
- 145,958 · +8.5%
- By 2050
- 151,218 · +12.4%
- By 2075
- 161,802 · +20.3%
- By 2100
- 159,036 · +18.2%
Race, ethnicity, and origin ACS 2023
- Neighborhood character
- Predominantly White (73%)
- Race & ethnicity
- White 73% Hispanic / Latino 13% Two or more races 9% Black 6%
- Hispanic origin (detail)
- Mexican 11%
- Common ancestry
- Slovak 5% Serbian 2% Portuguese 2%
- Foreign-born
- 4% · Canada
- Languages at home
- 93% English-only · Spanish 6%
Political lean MEDSL · Grayson
- 2024 margin
- Solid R (+54.3) · D 22.5% · R 76.7%
- 2008→2024 swing
- -16.4pp toward R · 2008: -37.9pp · 2024: -54.3pp
- All cycles
- 2024: R+54.3 2020: R+49.9 2016: R+53.1 2012: R+48.0 2008: R+37.9
Not yet ingested
- Civics
- —
Market trends
- HPI YoY
- ▼ -295.96%
- Current HPI
- 257.1806
- Rent YoY
- ▬ 0.05%
- Metro
- Sherman-Denison, TX
- State GDP YoY
- ▲ 3.95%
- F500 in state
- 110
Industry mix (Fortune 500 HQ in TX)
| Industry | F500 HQs | Revenue |
|---|---|---|
| Energy | 16 | $1,198B |
|
||
| Technology | 5 | $198B |
|
||
| Engineering / Construction | 4 | $72B |
|
||
| Energy Services | 3 | $60B |
|
||
| Utilities | 3 | $41B |
|
||
| Healthcare | 2 | $330B |
|
||
Price history
+277.8% since first listed17 events — show timeline
- 2026-05-18 Price Changed $169,999 NTREIS
- 2026-03-14 Listed $179,000 NTREIS
- 2024-09-19 Sold (Public Records) — Public Records
- 2021-11-03 Sold (Public Records) — Public Records
- 2018-02-01 Listing Removed — NTREIS
- 2017-12-20 Sold (Public Records) — Public Records
- 2017-11-30 Listed $79,000 NTREIS
- 2016-09-12 Sold (Public Records) — Public Records
- 2016-08-29 Sold (Public Records) — Public Records
- 2012-11-28 Sold (MLS) — NTREIS
- 2012-11-02 Pending — NTREIS
- 2012-10-17 Price Changed $16,150 NTREIS
- 2012-09-07 Listed $19,000 NTREIS
- 2006-12-14 Sold (Public Records) — Public Records
- 2006-11-16 Listing Removed — NTREIS
- 2006-07-15 Listed $45,000 NTREIS
- 1992-01-03 Sold (Public Records) — Public Records
Property tax history
+8.5%/yrLatest (2025): $3,777 · -1.2% YoY. Source: county tax records.
Cash-flow waterfall
monthlySold comps — $/sqft
last 12 mo · ≤1 miLoading sold comps…