 10-Plex
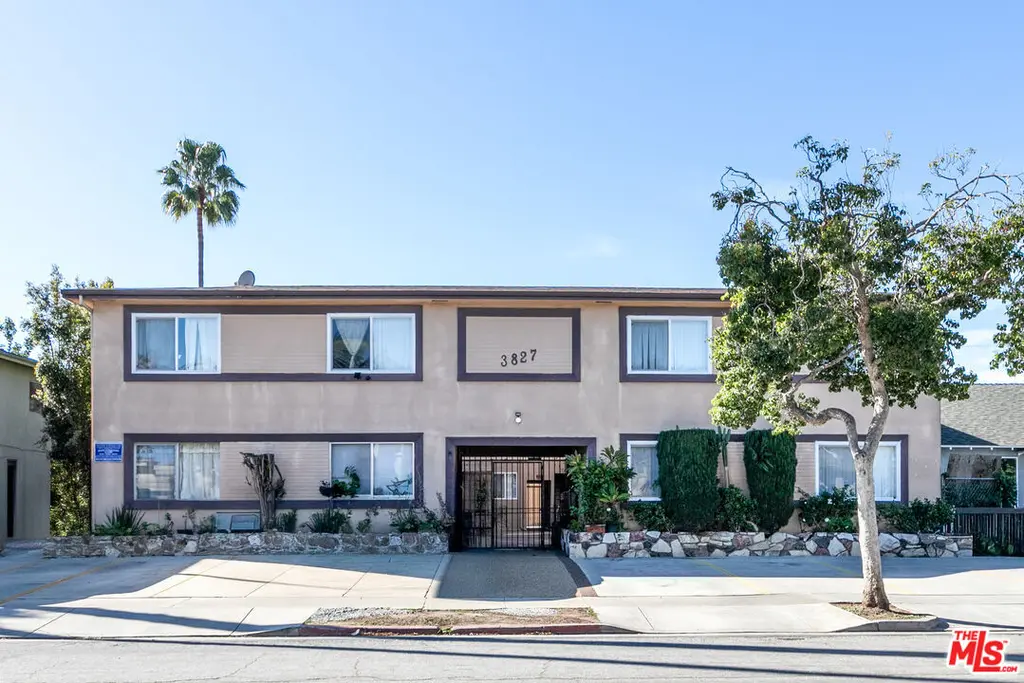
3827 Tilden Ave · Culver City, CA
Flood risk 1/10 · Minimal
- FEMA flood zone
- X (unshaded)
- Chance of flooding over 30 yrs
- 0.0%
- Est. flood insurance / yr
- $507 – $1,088
Fire risk 1/10 · Minimal
- Est. fire insurance / yr
- $659 – $1,223
Heat risk 6/10 · Moderate
- Hot days now (above 85°F)
- 7 days/yr
- Hot days in 30 yrs
- 21 days/yr
Wind risk 1/10 · Minimal
- Chance of severe wind over 30 yrs
- —
Air-quality risk 4/10 · Minor
- Unhealthy air days now
- 6 days/yr
- Unhealthy air days in 30 yrs
- 7 days/yr
Risk factors via First Street. Map © Google.
Why this score? — see what drove the B grade
The composite is a weighted blend of 9 inputs, each scored 0–100. Each bar is that input's sub-score; the figure is the points it added to the 100-point composite (weight × sub-score).
- Cash flow +30.0/30.0
- 1% rule +10.0/10.0
- DSCR +10.0/10.0
- Appreciation +6.2/10.0
- Schools +5.2/10.0
- Livability +3.7/5.0
- Condition / age +2.5/5.0
- Rent growth +2.1/5.0
- ARV discount +1.0/15.0
$3,450,000
🖨 Deal sheet 📄 Offer letter ✓ Due diligence
Multi-family units
County records classify this as Multi-Family (5+ Unit). Listing-text estimate: 10 units. confirmed
5+ unit building — per-unit beds/baths from public records are typically unavailable; the breakdown below (if shown) is an estimate from the listing text.
Listing remarks MLS
Situated on an expansive 10,927 square foot lot, this mid-century modern complex features a substantial 9,340 square feet of living area across ten units. The complex is defined by its classic 1957 architecture, featuring a gated entry, private courtyard, and 15 dedicated parking spaces. Positioned just a half-mile from the vibrant Downtown Culver City district and the upscale Helms Bakery complex, the property offers residents unparalleled walkability to Michelin-recognized dining and the new "Entertainment Zone. " Culver City, famously known as "The Heart of Screenland, " has evolved from a historic film production hub into one of Southern California's most resilient creative-tech centers. Strategically located between Santa Monica and Downtown LA, the city is anchored by the massive campuses of Amazon MGM Studios, Sony Pictures, and Apple. This concentration of global giants has fostered a thriving "creative economy" that includes architecture, design, and biotechnology, ensuring the area remains insulated from broader market volatility. With efficient transit options like the Metro E Line and the Ballona Creek Bike Path, the city offers seamless connectivity for the affluent professional demographic that now calls this "built-in" tech hub home. Beyond its economic growth, Culver City offers a sophisticated lifestyle that blends "Old Hollywood" charm with modern urban energy. The local scene is defined by premier dining destinations like The Platform and the Helms Bakery District, complemented by a nightlife centered around jazz at the historic Culver Hotel and a new pedestrian-friendly Entertainment Zone. Residents and visitors alike enjoy a diverse range of activities, from the rigorous climb of the Baldwin Hills Scenic Overlook to the quirky, cerebral exhibits at the Museum of Jurassic Technology. This unique mix of high-end amenities and quirky cultural landmarks cements Culver City's reputation as a dynamic, multifaceted destination.
Key facts
- Metro e line
- Gated entry
- Private courtyard
Tags
Neighborhood map
What this means for you Summary
Snapshot
- This is a 10 × 17-bed/10.0-bath units multifamily listed at $3.45M.
Deal economics
- At list price, monthly cash flow is $18k ($216k/yr) — positive. Per door: $2k/mo.
- The deal already cash-flows at list — no discount required.
- Meets the 1% rule at list price ($52k rent vs $3.45M).
- Recommended offer: $3.04M (12.0% below list) — sets the bar for market timing.
- Cap rate 12.6% vs local median 2.0% in Culver City — top-decile yield for the area; either an underpriced asset or a hidden risk that comps aren't pricing in. Stress-test before assuming the spread holds.
Location & tenants
- Location reads 73/100 on livability (#163 in CA) — a middle-class / working-renter tenant base. Strengths: schools A+, amenities A+, commute A+; Watch: health & safety C-, crime F, cost of living F.
- Culver City Unified (suburban): math 53% / reading 62% proficiency, ranked #79 of 517 in CA (top 15%) — acceptable for families but not a draw, mixed tenant base, ~2y average lease.
- Market conditions: Rents soft (-1.6%/yr); 29 active listings in the ZIP; high-income renter base; 19,697 units permitted in Los Angeles County in 2024 (9,426 in 5+ unit buildings).
Forward outlook
- In year one you build about $105k of equity ($24k loan paydown + $81k appreciation (2.3% local appreciation)).
- Los Angeles County population projected at +9% by 2050 — modest demand growth; plan on rents tracking national, not racing it.
- At projected returns (2.3% appreciation + 0.0% rent growth), your $966k cash investment doubles in ~3 years — after that, you're playing with house money.
- By year 3, paydown + projected appreciation supports a ~$263k cash-out refi (75% LTV) — recoverable capital for the next deal without selling this one.
Negotiation context
- It's been on market 133 days — a 12% lower offer ($3.04M) is reasonable based on typical stale-listing flexibility.
- 11 sale attempts since 13y ago with the ask held roughly flat each time — persistent listings suggest the price (not the market) is what's stuck; bring a comps-based counter.
- Current owner paid $2.61M; 32% above their basis — modest negotiation headroom, anchor on the comps not their cost.
Risks & watch-outs
- Watch-outs: built in 1957 — expect roof / HVAC / electrical / plumbing capex.
- Climate carrying-cost: extreme-heat days projected 7→21/yr by 2055 (HVAC capex compounding) — expect insurance premiums to compound above CPI over the hold.
Questions for the listing agent
- It's been on market 133 days. Have you received any prior offers? Is the seller open to a 12% concession, seller financing, or rate buy-down credit?
- Can we see the unit-by-unit rent roll, current vacancy, and any below-market leases? What's the average tenancy length?
- What capital expenditures (roof, boiler, parking lot, exteriors) have been made in the last 5 years, and what's planned in the next 2?
- Built in 1957 — when were the roof, HVAC, electrical panel, plumbing, and water heater last replaced?
- Why hasn't it sold? Are there any deal-killer items the seller is aware of (foundation, flood, title, zoning, code violations)?
- Is there a deadline driving the sale (1031 exchange, divorce, estate, relocation)? That informs how much negotiation room exists.
- Schools are A-rated — typically a magnet for longer-tenancy family renters. What's the average tenant stay here, and is there a school-zone premium baked into asking?
- Crime grade is F in this area — have there been break-ins, vandalism, or insurance claims at this property in the last 3 years? What carrier currently insures it and at what premium?
- What's the average days-on-market for RENTAL listings here right now (not sales)? A rising rental-DOM trend means longer vacancies and softer asking-rent achievability than the comps imply.
- What's the recent tenant-quality profile in this submarket — average credit score on applications, eviction rate, late-payment / NSF rate, and stable-employment percentage? A property-management company in the area should have these aggregated.
- How much new apartment / multifamily construction is in the pipeline within 1–3 miles? Heavy new supply (>2% of stock underway) typically softens rents 12–24 months out; light construction supports rent growth.
Investment metrics
- 1% rule
- 1.50% ✓
- Cap rate
- 12.57%
- Cash-on-cash
- 22.41%
- DSCR
- 2.00
- GRM
- 5.5
CMA / ARV
- ARV (median comp)
- $3,012,838
- List price
- $3,450,000
- Delta
- 14.51%
- Verdict
- OVERPRICED
- Comps
- 20 within 1.0 mi
Show comp detail 2 sales within ~0.75 mi
| Address | Dist | Beds/Ba | Sqft | Sold | Price | $/sf | Match |
|---|---|---|---|---|---|---|---|
| 11061 Venice Blvd | 0.09mi | 16/16.0 | 8,840 (-5%) | 5mo | $2,980,000 | $337 | 62 |
| 3873 College Ave | 0.22mi | 16/17.0 | 8,912 (-5%) | 17mo | $2,750,000 | $309 | 48 |
Match score weights: distance 35% · size 25% · config 20% · recency 20%. Top-matched comps best support the ARV.
Projected returns pro-forma
2.34% appreciation · 0.0% rent growth · sell at horizon
- IRR
- 25.0%
- Equity multiple
- 2.34×
- Total profit
- $1,294,432
- Equity at exit
- $1,425,424
- IRR
- 24.7%
- Equity multiple
- 4.08×
- Total profit
- $2,971,534
- Equity at exit
- $2,103,504
Cash invested: $966,000 (down + closing). Projections, not guarantees.
Landlord ↔ Tenant lean methodology
- Overall (STATE)
- 18 Strongly Tenant-Friendly
- State California
- 18 Strongly Tenant-Friendly · D+13
- County
- — inherits STATE
- City
- — inherits STATE
ZIP-level market 90232
- Home prices YoY
- 0.5%
- Rents YoY
- -1.6%
- Active inventory
- 29
- Price-to-rent
- 55.5×
Monthly cashflow live
- Estimated rent
- $51,821 medium interval (Pro) →
- Mortgage (P&I)
- −$18,092
- Tax from tax record
- −$3,372 /mo · $40,463/yr
- Insurance
- −$1,438
- HOA
- −$0
- Vacancy / Maint / Mgmt
- −$10,882
- Net cashflow
- $18,037
Break-even live
10-unit breakdown (identical units grouped — click to expand)
| Units | Beds | Baths | Est. rent |
|---|---|---|---|
| 10× units | 17 | 10 | $51,820 |
| #1 | 17 | 10 | $5,182 |
| #2 | 17 | 10 | $5,182 |
| #3 | 17 | 10 | $5,182 |
| #4 | 17 | 10 | $5,182 |
| #5 | 17 | 10 | $5,182 |
| #6 | 17 | 10 | $5,182 |
| #7 | 17 | 10 | $5,182 |
| #8 | 17 | 10 | $5,182 |
| #9 | 17 | 10 | $5,182 |
| #10 | 17 | 10 | $5,182 |
| Total (10 units) | $51,821 | ||
UW: 25.0% down · 7.5% · 30yr · 1.5% tax · 5.0% vac · 8.0% maint · 8.0% mgmt
Financing live
Cash to close
- Down payment
- $862,500
- Closing costs
- $103,500
- Reserves months
- —
- Total cash needed
- —
Loan-product check · same deal, 3 products live
Conventional
25% down · 7.5% · 30yr
- Down + closing
- —
- Monthly P&I
- —
- Monthly cashflow
- —
- DSCR
- —
- Eligible?
- —
Personal DTI + credit; lowest rate.
DSCR
20% down · 8.5% · 30yr
- Down + closing
- —
- Monthly P&I
- —
- Monthly cashflow
- —
- DSCR
- —
- Eligible?
- —
No personal income docs; deal must DSCR.
Hard money
10% down · 12.0% · 12mo
- Down + closing
- —
- Monthly P&I
- —
- Monthly cashflow
- —
- DSCR
- —
- Eligible?
- —
Short-term bridge; refi at stabilization.
Listing history 39 events
-
2026-06-18days on market $3,450,000 Active 133 DOM
-
2026-06-17days on market $3,450,000 Active 132 DOM
-
2026-06-16days on market $3,450,000 Active 131 DOM
-
2026-06-15days on market $3,450,000 Active 130 DOM
-
2026-06-13days on market $3,450,000 Active 128 DOM
-
2026-06-13days on market $3,450,000 Active 127 DOM
-
2026-06-09days on market $3,450,000 Active 124 DOM
-
2026-06-08days on market $3,450,000 Active 123 DOM
-
2026-06-07days on market $3,450,000 Active 122 DOM
-
2026-06-04days on market $3,450,000 Active 119 DOM
-
2026-06-03days on market $3,450,000 Active 118 DOM
-
2026-06-02days on market $3,450,000 Active 117 DOM
-
2026-06-01days on market $3,450,000 Active 116 DOM
-
2026-05-31days on market $3,450,000 Active 115 DOM
-
2026-02-04$3,450,000 Active 2025-char remark
Show marketing remark (2025 chars)
Situated on an expansive 10,927 square foot lot, this mid-century modern complex features a substantial 9,340 square feet of living area across ten units. The complex is defined by its classic 1957 architecture, featuring a gated entry, private courtyard, and 15 dedicated parking spaces. Positioned just a half-mile from the vibrant Downtown Culver City district and the upscale Helms Bakery complex, the property offers residents unparalleled walkability to Michelin-recognized dining and the new "Entertainment Zone. " Culver City, famously known as "The Heart of Screenland, " has evolved from a historic film production hub into one of Southern California's most resilient creative-tech centers. Strategically located between Santa Monica and Downtown LA, the city is anchored by the massive campuses of Amazon MGM Studios, Sony Pictures, and Apple. This concentration of global giants has fostered a thriving "creative economy" that includes architecture, design, and biotechnology, ensuring the area remains insulated from broader market volatility. With efficient transit options like the Metro E Line and the Ballona Creek Bike Path, the city offers seamless connectivity for the affluent professional demographic that now calls this "built-in" tech hub home. Beyond its economic growth, Culver City offers a sophisticated lifestyle that blends "Old Hollywood" charm with modern urban energy. The local scene is defined by premier dining destinations like The Platform and the Helms Bakery District, complemented by a nightlife centered around jazz at the historic Culver Hotel and a new pedestrian-friendly Entertainment Zone. Residents and visitors alike enjoy a diverse range of activities, from the rigorous climb of the Baldwin Hills Scenic Overlook to the quirky, cerebral exhibits at the Museum of Jurassic Technology. This unique mix of high-end amenities and quirky cultural landmarks cements Culver City's reputation as a dynamic, multifaceted destination.
-
2025-08-07historical $2,095
-
2025-07-30$2,095
-
2025-06-02price
-
2025-04-17price
-
2025-03-20Active
-
2024-08-08price
-
2024-07-17Active
-
2023-07-31Active
-
2023-05-25price
-
2023-03-02Active
-
2018-07-27historical Expired
-
2018-07-27historical
-
2018-05-28Active
-
2018-05-28$4,550,000
-
2016-06-17historical Expired
-
2016-06-17historical
-
2016-04-28price
-
2016-03-17Active
-
2016-03-17$4,095,000
-
2013-12-27soldstatus $2,610,000 Closed
-
2013-09-16status Pending
-
2013-07-16status Backup Offers Accepted
-
2013-06-13$2,000,000 Active
-
1991-01-02soldstatus $129,000
ⓘ Source: listings_history table (triggers on properties + properties_extension) + one-shot
backfill from property_details.listing_events for pre-trigger history.
Tax reassessment forecast CA · Resets to sale price
- Current annual tax
- $40,463 · $3,372/mo
- Projected year-2 tax
- $40,463 · $3,372/mo
- Expected delta
- $0/yr ($0/mo · 0.0%)
ⓘ Screening estimate from a state-policy table — verify with the county assessor before closing.
Climate risk First Street
- Flood 1/10 Low FEMA zone X (unshaded) · 0% chance over 30 yrs
- Wildfire 1/10 Low
- Heat 6/10 Major 7 d/yr ≥85°F today · 21 d/yr by 30 yrs out
- Wind 1/10 Low
- Air quality 4/10 Moderate 6 unhealthy d/yr today · 7 by 30 yrs out
Nearby sold comps map
Loading sold comps map…
Walkable amenities ~0.75 mi
Loading nearby amenities…
Taxation est. · year 1
- Rental income
- $621,852
- − Mortgage interest
- −$193,254
- − Property taxes
- −$40,463
- − Insurance
- −$17,250
- − Repairs & maintenance
- −$49,748
- − Management
- −$49,748
- − Depreciation
- −$100,364
- Taxable income
- $171,025
- Est. tax owed @ 24.0%
- −$41,046
- After-tax cash flow
- $175,398/yr
For passive investors: Depreciation is non-cash, so a rental often shows a tax loss while cash-flowing — sheltering income. Rental losses are passive: they offset passive income freely, and up to $25,000/yr can offset ordinary (W-2) income if you actively participate and your MAGI is under $100k (phasing out to $0 by $150k); unused losses carry forward. On sale, claimed depreciation is recaptured at up to 25%, and gains may owe capital-gains tax (a 1031 exchange can defer both). Figures are a year-1 estimate at your 24.0% rate — not tax advice; consult a CPA.
Schools (NCES district)
- District
- Culver City Unified
- NCES district ID
- 0610260
- Math proficiency
- 53% ▼ -3.00%
- Reading proficiency
- 62% ▼ -8.00%
- Median HH income
- $78,489
- Composite
- 51.7/100
- National rank
- #1689
- State rank
- #79 of 517 in CA
Livability — Culver City
- Score
- 73/100
- State rank
- #163
- US rank
- #5340
Category grades
Schools grade is shown separately in the Schools card above.
Census & demographics
- Census place
- Culver City, CA
- County
- Los Angeles County · 9,444,647 people
- City population
- 47,563
- Metro
- Los Angeles-Long Beach-Anaheim, CA
- Population (ZIP)
- 16,554
- Household income
- $122,396
- Rent vs Own
- Severe rent burden
- 1159.0
Population outlook (Los Angeles County) Hauer SSP2
- Today (2025)
- 10,940,515 people
- By 2030
- 11,256,481 · +2.9%
- By 2040
- 11,729,929 · +7.2%
- By 2050
- 11,948,407 · +9.2%
- By 2075
- 11,818,114 · +8.0%
- By 2100
- 10,842,928 · -0.9%
Race, ethnicity, and origin ACS 2023
- Neighborhood character
- Diverse neighborhood (Simpson 0.67)
- Race & ethnicity
- White 50% Asian 21% Hispanic / Latino 19% Two or more races 16% Black 4%
- Hispanic origin (detail)
- Mexican 12%
- Common ancestry
- Scotch-Irish 4% Romanian 4% Lithuanian 3%
- Foreign-born
- 22% · Canada, China, Philippines
- Languages at home
- 67% English-only · Spanish 16% Chinese 4% Other Indo-European 4%
Political lean MEDSL · Los Angeles
- 2024 margin
- Solid D (+32.9) · D 64.8% · R 31.9% · Other 3.3%
- 2008→2024 swing
- -7.4pp toward R · 2008: 40.4pp · 2024: 32.9pp
- All cycles
- 2024: D+32.9 2020: D+44.2 2016: D+48.0 2012: D+40.0 2008: D+40.4
Not yet ingested
- Civics
- —
Market trends
- HPI YoY
- ▲ 2.34%
- Current HPI
- 473.1563
- Rent YoY
- ▼ -1.65%
- Metro
- Los Angeles-Long Beach-Anaheim, CA
- State GDP YoY
- ▲ 3.21%
- F500 in state
- 116
Industry mix (Fortune 500 HQ in CA)
| Industry | F500 HQs | Revenue |
|---|---|---|
| Technology | 27 | $1,492B |
|
||
| Financial Services | 3 | $174B |
|
||
| Retail | 3 | $44B |
|
||
| Insurance | 3 | $26B |
|
||
| Media / Entertainment | 2 | $115B |
|
||
| Pharmaceuticals / Biotech | 2 | $62B |
|
||
Price history
+2574.4% since first listed25 events — show timeline
- 2026-02-04 Listed $3,450,000 TheMLS
- 2025-08-07 Rental Removed $2,095 SHOWMOJO
- 2025-07-30 Listed for Rent $2,095 SHOWMOJO
- 2025-06-02 Price Changed — TheMLS
- 2025-04-17 Price Changed — TheMLS
- 2025-03-20 Listed — TheMLS
- 2024-08-08 Price Changed — TheMLS
- 2024-07-17 Listed — TheMLS
- 2023-07-31 Listed — TheMLS
- 2023-05-25 Price Changed — TheMLS
- 2023-03-02 Listed — TheMLS
- 2018-07-27 Listing Removed — SDMLS
- 2018-07-27 Delisted — TheMLS
- 2018-05-28 Listed $4,550,000 SDMLS
- 2018-05-28 Listed — TheMLS
- 2016-06-17 Listing Removed — SDMLS
- 2016-06-17 Delisted — TheMLS
- 2016-04-28 Price Changed — TheMLS
- 2016-03-17 Listed — TheMLS
- 2016-03-17 Listed $4,095,000 SDMLS
- 2013-12-27 Sold (MLS) $2,610,000 CRMLS
- 2013-09-16 Pending — CRMLS
- 2013-07-16 Pending — CRMLS
- 2013-06-13 Listed $2,000,000 CRMLS
- 1991-01-02 Sold (Public Records) $129,000 Public Records
Property tax history
+8.5%/yrLatest (2025): $40,463 · +2.6% YoY. Source: county tax records.
Cash-flow waterfall
monthlySold comps — $/sqft
last 12 mo · ≤1 miLoading sold comps…