 🏷️ Likely Rental
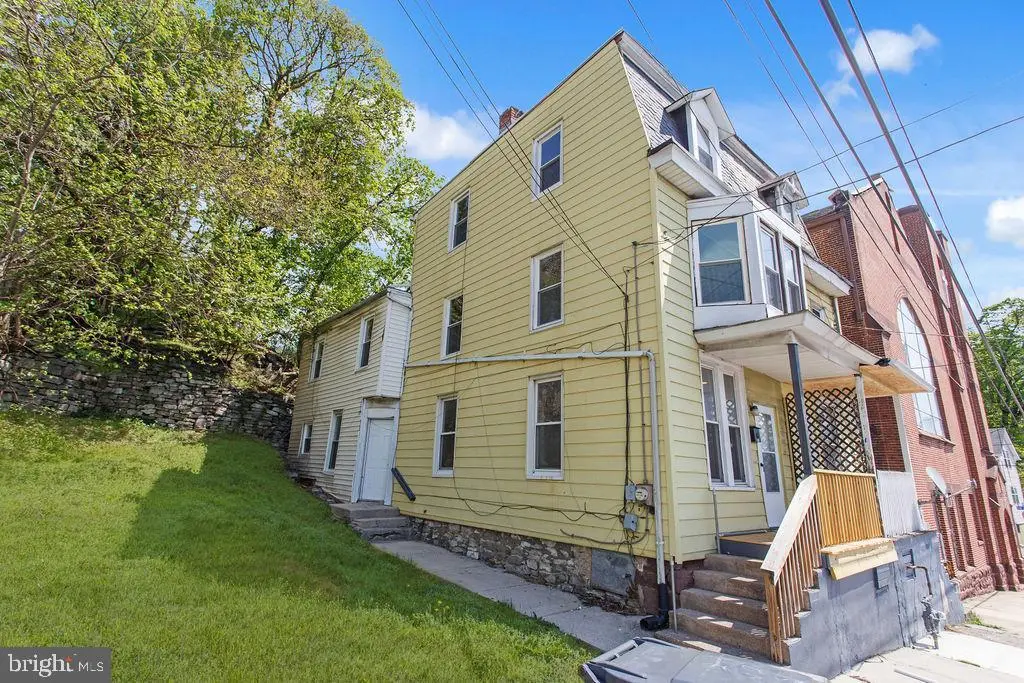
211 N 2nd St · Harrisburg, PA
Flood risk No data
- FEMA flood zone
- —
- Chance of flooding over 30 yrs
- —
- Est. flood insurance / yr
- —
Fire risk No data
- Est. fire insurance / yr
- —
Heat risk No data
- Hot days now (above threshold)
- —
- Hot days in 30 yrs
- —
Wind risk No data
- Chance of severe wind over 30 yrs
- —
Air-quality risk No data
- Unhealthy air days now
- —
- Unhealthy air days in 30 yrs
- —
Risk factors via First Street. Map © Google.
Why this score? — see what drove the B- grade
The composite is a weighted blend of 9 inputs, each scored 0–100. Each bar is that input's sub-score; the figure is the points it added to the 100-point composite (weight × sub-score).
- Cash flow +26.0/30.0
- ARV discount +15.0/15.0
- DSCR +8.8/10.0
- 1% rule +6.3/10.0
- Livability +4.2/5.0
- Rent growth +2.5/5.0
- Condition / age +2.5/5.0
- Schools +0.8/10.0
- Appreciation +0.0/10.0
$159,999
🖨 Deal sheet 📄 Offer letter ✓ Due diligence
Listing remarks MLS
Now being sold individually or as part of a package of single or multi family homes in Steelton. This building is a 4 bedrooms/1 bath. Currently rents at $973/month with potential rent of $1155. Tenant pays all utilities. Long term lease with lease going through 5/31/2022.
Key facts
- Built 1900
- Listed 32 days
Property features AI
Exterior
- Parking: On-street parking
- Utilities: Public water; Public sewer; Natural gas heating and hot water
- Home design: Semi-detached; Frame construction
- Construction: Stone foundation; Above-grade and below-grade structures
- Exterior features: Not in a federal flood zone; Ground rent paid annually
Interior
- Bedrooms: Three bedrooms on the first upper level; One bedroom on the second upper level
- Bathrooms: One full bathroom
- Heating & cooling: Forced air heating; Natural gas hot water
- Interior features: Full basement; Multiple access exits
Neighborhood map
What this means for you Summary
Snapshot
- This is a 4-bed/1.0-bath single-family listed at $160k.
Deal economics
- At list price, monthly cash flow is $400 ($5k/yr) — positive.
- The deal already cash-flows at list — no discount required.
- Meets the 1% rule at list price ($2k rent vs $160k).
- Recommended offer: $155k (3.0% below list) — sets the bar for market timing.
- Cap rate 9.3% vs local median 6.6% in Harrisburg — top-decile yield for the area; either an underpriced asset or a hidden risk that comps aren't pricing in. Stress-test before assuming the spread holds.
Location & tenants
- Location reads 84/100 on livability (#107 in PA, #826 nationally) — a professional / high-income tenant draw. Strengths: amenities A+, commute A+, cost of living A+; Watch: schools C-, employment D, crime F.
- Harrisburg City SD (urban): math 6% / reading 13% proficiency, ranked #535 of 539 in PA (top 99%) — low school quality limits family demand, transient renter base, plan for 1-2y turnover; 82% free/reduced lunch — lower-income household profile, screen leases tightly.
- Market conditions: 68 active listings in the ZIP; 25 comparable units currently listed for rent nearby; rentals at typical pace (median 24d on market — plan ~3-4 weeks tenant-placement turnaround); 40% of comp listings sitting > 30 days — soft ceiling on asking rent; 540 units permitted in Dauphin County in 2024 (194 in 5+ unit buildings).
- This rent runs 32% of the median local income ($68k/yr) — at the standard rent-burdened threshold; future hikes will face affordability resistance.
Forward outlook
- Local home prices are declining (-3.0%/yr); year-one equity from $1k of loan paydown is wiped out by about $5k of value loss. Plan a longer hold.
Negotiation context
- It's been on market 32 days — a 3% lower offer ($155k) is reasonable based on typical stale-listing flexibility.
- 3 sale attempts since 5y ago with the ask held roughly flat each time — persistent listings suggest the price (not the market) is what's stuck; bring a comps-based counter.
Risks & watch-outs
- Watch-outs: built in 1900 — expect roof / HVAC / electrical / plumbing capex.
Questions for the listing agent
- It's been on market 32 days. Have you received any prior offers? Is the seller open to a 3% concession, seller financing, or rate buy-down credit?
- Built in 1900 — when were the roof, HVAC, electrical panel, plumbing, and water heater last replaced?
- Is there a deadline driving the sale (1031 exchange, divorce, estate, relocation)? That informs how much negotiation room exists.
- Crime grade is F in this area — have there been break-ins, vandalism, or insurance claims at this property in the last 3 years? What carrier currently insures it and at what premium?
- What's the average days-on-market for RENTAL listings here right now (not sales)? A rising rental-DOM trend means longer vacancies and softer asking-rent achievability than the comps imply.
- What's the recent tenant-quality profile in this submarket — average credit score on applications, eviction rate, late-payment / NSF rate, and stable-employment percentage? A property-management company in the area should have these aggregated.
- How much new for-sale + rental construction is in the pipeline within 1–3 miles? Heavy new supply typically softens prices + rents 12–24 months out; constrained supply supports both.
Investment metrics
- 1% rule
- 1.13% ✓
- Cap rate
- 9.29%
- Cash-on-cash
- 10.72%
- DSCR
- 1.48
- GRM
- 7.4
CMA / ARV
- ARV (median comp)
- $213,075
- List price
- $159,999
- Delta
- -24.91%
- Verdict
- UNDERPRICED
- Comps
- 20 within 1.0 mi
Show comp detail 1 sale within ~0.75 mi
| Address | Dist | Beds/Ba | Sqft | Sold | Price | $/sf | Match |
|---|---|---|---|---|---|---|---|
| 228 Boas St | 0.46mi | 3/3.5 (-1) | 2,011 (-2%) | 12mo | $225,000 | $112 | 50 |
Match score weights: distance 35% · size 25% · config 20% · recency 20%. Top-matched comps best support the ARV.
Projected returns pro-forma
-3.0% appreciation · 3.0% rent growth · sell at horizon
- IRR
- -0.3%
- Equity multiple
- 0.99×
- Total profit
- $-467
- Equity at exit
- $23,856
- IRR
- 9.4%
- Equity multiple
- 1.72×
- Total profit
- $32,322
- Equity at exit
- $13,834
Cash invested: $44,800 (down + closing). Projections, not guarantees.
Landlord ↔ Tenant lean methodology
- Overall (STATE)
- 62 Landlord-Friendly
- State Pennsylvania
- 62 Landlord-Friendly · EVEN
- County
- — inherits STATE
- City
- — inherits STATE
ZIP-level market 17113
- Home prices YoY
- -16.3%
- Active inventory
- 68
- Price-to-rent
- 7.4×
Monthly cashflow live
- Estimated rent
- $1,809 high interval (Pro) →
- Mortgage (P&I)
- −$839
- Tax from tax record
- −$123 /mo · $1,481/yr
- Insurance
- −$67
- HOA
- −$0
- Vacancy / Maint / Mgmt
- −$380
- Net cashflow
- $400
Break-even live
UW: 25.0% down · 7.5% · 30yr · 1.5% tax · 5.0% vac · 8.0% maint · 8.0% mgmt
Financing live
Cash to close
- Down payment
- $40,000
- Closing costs
- $4,800
- Reserves months
- —
- Total cash needed
- —
Loan-product check · same deal, 3 products live
Conventional
25% down · 7.5% · 30yr
- Down + closing
- —
- Monthly P&I
- —
- Monthly cashflow
- —
- DSCR
- —
- Eligible?
- —
Personal DTI + credit; lowest rate.
DSCR
20% down · 8.5% · 30yr
- Down + closing
- —
- Monthly P&I
- —
- Monthly cashflow
- —
- DSCR
- —
- Eligible?
- —
No personal income docs; deal must DSCR.
Hard money
10% down · 12.0% · 12mo
- Down + closing
- —
- Monthly P&I
- —
- Monthly cashflow
- —
- DSCR
- —
- Eligible?
- —
Short-term bridge; refi at stabilization.
Rent comps 25 comps
| Address | Beds | Baths | Sqft | Rent | $/sqft | DOM | Units | Dist |
|---|---|---|---|---|---|---|---|---|
| 301 Chestnut St Harrisburg, PA | 1.0–4.0 | 1.0–2.5 | 1437 | $2,600 | $1.81 | 43d | 1 | 0.30mi |
| 301 Chestnut St Harrisburg, PA | 4.0 | 1.0–2.5 | 1437 | $3,000 | $2.09 | 14d | 10 | 0.30mi |
| 919 Penn St Harrisburg, PA | 3.0 | 2.0 | 1458 | $1,795 | $1.23 | 23d | 1 | 0.44mi |
| 1202 Penn St Harrisburg, PA | 4.0 | 1.0 | 1706 | $1,495 | $0.88 | 43d | 1 | 0.60mi |
| 1330 Susquehanna St Harrisburg, PA | 4.0 | 1.5 | 2280 | $1,895 | $0.83 | 23d | 1 | 0.71mi |
| 1207 Market St Harrisburg, PA | 4.0 | 1.5 | 1423 | $1,995 | $1.40 | 43d | 1 | 0.72mi |
| 52 Balm St Harrisburg, PA | 3.0 | 1.0 | 1950 | $1,495 | $0.77 | 21d | 1 | 0.75mi |
| 227 Hummel St Harrisburg, PA | 5.0 | 2.0 | 2696 | $1,600 | $0.59 | 43d | 1 | 0.76mi |
| 331 Hummel St Unit B Harrisburg, PA | 3.0 | 1.0 | 1590 | $1,800 | $1.13 | 43d | 1 | 0.80mi |
| 349 S 14th St Harrisburg, PA | 3.0 | 1.0 | 1544 | $1,450 | $0.94 | 23d | 1 | 0.94mi |
| 1414 Berryhill St Harrisburg, PA | 5.0 | 2.0 | 1786 | $1,700 | $0.95 | 23d | 1 | 1.00mi |
| 337 S 15th St Harrisburg, PA | 3.0 | 1.0 | 1440 | $1,195 | $0.83 | 21d | 1 | 1.01mi |
| 1716 N 6th St Harrisburg, PA | 4.0 | 3.5 | 2400 | $2,200 | $0.92 | 43d | 1 | 1.07mi |
| 1716 N 6th St Unit NA Harrisburg, PA | 4.0 | 4.0 | 2400 | $2,000 | $0.83 | 23d | 1 | 1.07mi |
| 14 S 17th St Harrisburg, PA | 5.0 | 2.0 | 2136 | $1,695 | $0.79 | 14d | 1 | 1.09mi |
| 66 N 17th St Harrisburg, PA | 5.0 | 2.0 | 1845 | $2,195 | $1.19 | 43d | 1 | 1.11mi |
| 1610 Hunter St Harrisburg, PA | 4.0 | 1.0 | 1776 | $1,450 | $0.82 | 23d | 1 | 1.13mi |
| 111 N 17th St Harrisburg, PA | 5.0 | 1.0 | 1800 | $1,850 | $1.03 | 14d | 1 | 1.16mi |
| 1834 Green St Harrisburg, PA | 4.0 | 1.0 | 1792 | $1,495 | $0.83 | 23d | 1 | 1.17mi |
| 1708 State St Harrisburg, PA | 5.0 | 1.5 | 2320 | $1,745 | $0.75 | 21d | 1 | 1.19mi |
| 616 N Front St Lemoyne, PA | 3.0 | 1.0 | 1408 | $1,650 | $1.17 | 43d | 1 | 1.23mi |
| 407 Herman Ave Lemoyne, PA | 3.0 | 2.0 | 1400 | $2,100 | $1.50 | 21d | 1 | 1.33mi |
| 2032 Susquehanna St Harrisburg, PA | 4.0 | 1.5 | 1600 | $1,595 | $1.00 | 43d | 1 | 1.34mi |
| 320 Maclay St Harrisburg, PA | 3.0 | 2.5 | 2237 | $1,750 | $0.78 | 14d | 1 | 1.40mi |
| 2153 Penn St Harrisburg, PA | 4.0 | 2.0 | 1620 | $1,995 | $1.23 | 43d | 1 | 1.50mi |
Listing history 12 events
-
2026-04-25$159,999 Active 323-char remark
-
2024-10-08historical
-
2024-04-10$120,000 Active
-
2022-05-31soldstatus $55,000
-
2022-05-27soldstatus $67,500 Closed
Show marketing remark (274 chars)
Now being sold individually or as part of a package of single or multi family homes in Steelton. This building is a 4 bedrooms/1 bath. Currently rents at $973/month with potential rent of $1155. Tenant pays all utilities. Long term lease with lease going through 5/31/2022.
-
2022-01-11status Pending
Show marketing remark (274 chars)
Now being sold individually or as part of a package of single or multi family homes in Steelton. This building is a 4 bedrooms/1 bath. Currently rents at $973/month with potential rent of $1155. Tenant pays all utilities. Long term lease with lease going through 5/31/2022.
-
2021-12-14price $82,500
Show marketing remark (274 chars)
Now being sold individually or as part of a package of single or multi family homes in Steelton. This building is a 4 bedrooms/1 bath. Currently rents at $973/month with potential rent of $1155. Tenant pays all utilities. Long term lease with lease going through 5/31/2022.
-
2021-10-25price $1,950,000
Show marketing remark (274 chars)
Now being sold individually or as part of a package of single or multi family homes in Steelton. This building is a 4 bedrooms/1 bath. Currently rents at $973/month with potential rent of $1155. Tenant pays all utilities. Long term lease with lease going through 5/31/2022.
-
2021-10-12$2,150,000 Active
Show marketing remark (274 chars)
Now being sold individually or as part of a package of single or multi family homes in Steelton. This building is a 4 bedrooms/1 bath. Currently rents at $973/month with potential rent of $1155. Tenant pays all utilities. Long term lease with lease going through 5/31/2022.
-
2020-05-22soldstatus $735,000
-
1994-09-30soldstatus $19,290
-
1986-08-04soldstatus $17,500
ⓘ Source: listings_history table (triggers on properties + properties_extension) + one-shot
backfill from property_details.listing_events for pre-trigger history.
Tax reassessment forecast PA · Partial reset (capped growth)
- Current annual tax
- $1,481 · $123/mo
- Projected year-2 tax
- $2,004 · $167/mo
- Expected delta
- +$524/yr (+$44/mo · 35.4%)
ⓘ Screening estimate from a state-policy table — verify with the county assessor before closing.
Nearby sold comps map
Loading sold comps map…
Walkable amenities ~0.75 mi
Loading nearby amenities…
Taxation est. · year 1
- Rental income
- $21,709
- − Mortgage interest
- −$8,962
- − Property taxes
- −$1,481
- − Insurance
- −$800
- − Repairs & maintenance
- −$1,737
- − Management
- −$1,737
- − Depreciation
- −$4,655
- Taxable income
- $2,338
- Est. tax owed @ 24.0%
- −$561
- After-tax cash flow
- $4,240/yr
For passive investors: Depreciation is non-cash, so a rental often shows a tax loss while cash-flowing — sheltering income. Rental losses are passive: they offset passive income freely, and up to $25,000/yr can offset ordinary (W-2) income if you actively participate and your MAGI is under $100k (phasing out to $0 by $150k); unused losses carry forward. On sale, claimed depreciation is recaptured at up to 25%, and gains may owe capital-gains tax (a 1031 exchange can defer both). Figures are a year-1 estimate at your 24.0% rate — not tax advice; consult a CPA.
Schools (NCES district)
- District
- Harrisburg City SD
- NCES district ID
- 4211580
- Math proficiency
- 6% ▼ -6.00%
- Reading proficiency
- 13% ▼ -10.00%
- Median HH income
- $33,432
- Composite
- 7.6/100
- National rank
- #9945
- State rank
- #535 of 539 in PA
Livability — Harrisburg
- Score
- 84/100
- State rank
- #107
- US rank
- #826
Category grades
Schools grade is shown separately in the Schools card above.
Census & demographics
- Census place
- Harrisburg, PA
- County
- Dauphin County · 247,857 people
- City population
- 19,401
- Metro
- Harrisburg-Carlisle, PA
- Population (ZIP)
- 11,724
- Household income
- $68,244
- Rent vs Own
- Severe rent burden
- 338.0
Population outlook (Dauphin County) Hauer SSP2
- Today (2025)
- 281,628 people
- By 2030
- 283,549 · +0.7%
- By 2040
- 285,385 · +1.3%
- By 2050
- 286,188 · +1.6%
- By 2075
- 291,053 · +3.3%
- By 2100
- 282,374 · +0.3%
Race, ethnicity, and origin ACS 2023
- Neighborhood character
- Diverse neighborhood (Simpson 0.67)
- Race & ethnicity
- White 48% Hispanic / Latino 24% Black 22% Two or more races 19% Native American 2% Asian 2%
- Hispanic origin (detail)
- Mexican 7% Puerto Rican 11% Cuban 2%
- Common ancestry
- Romanian 1% Lithuanian 1% Iranian 1%
- Foreign-born
- 7% · Canada, India
- Languages at home
- 80% English-only · Spanish 17% Other Indo-European 1% Russian/Polish/Slavic 1%
Political lean MEDSL · Dauphin
- 2024 margin
- Lean D (+5.9) · D 52.4% · R 46.5% · Other 1.1%
- 2008→2024 swing
- -3.1pp toward R · 2008: 9.1pp · 2024: 5.9pp
- All cycles
- 2024: D+5.9 2020: D+8.5 2016: D+2.8 2012: D+6.0 2008: D+9.1
Not yet ingested
- Civics
- —
Market trends
- HPI YoY
- ▼ -54.73%
- Current HPI
- 281.6906
- Rent YoY
- —
- Metro
- Harrisburg-Carlisle, PA
- State GDP YoY
- ▲ 1.68%
- F500 in state
- 34
Industry mix (Fortune 500 HQ in PA)
| Industry | F500 HQs | Revenue |
|---|---|---|
| Healthcare | 2 | $309B |
|
||
| Insurance | 2 | $27B |
|
||
| Telecommunications / Media | 1 | $124B |
|
||
| Industrial Distribution | 1 | $22B |
|
||
| Financial Services | 1 | $20B |
|
||
| Chemicals / Materials | 1 | $18B |
|
||
Price history
+842.9% since first listed14 events — show timeline
- 2026-06-05 Sold (MLS) $165,000 BRIGHT MLS
- 2026-05-27 Pending — BRIGHT MLS
- 2026-04-25 Listed $159,999 BRIGHT MLS
- 2024-10-08 Listing Removed — BRIGHT MLS
- 2024-04-10 Listed $120,000 BRIGHT MLS
- 2022-05-31 Sold (Public Records) $55,000 Public Records
- 2022-05-27 Sold (MLS) $67,500 BRIGHT MLS
- 2022-01-11 Pending — BRIGHT MLS
- 2021-12-14 Price Changed $82,500 BRIGHT MLS
- 2021-10-25 Price Changed $1,950,000 BRIGHT MLS
- 2021-10-12 Listed $2,150,000 BRIGHT MLS
- 2020-05-22 Sold (Public Records) $735,000 Public Records
- 1994-09-30 Sold (Public Records) $19,290 Public Records
- 1986-08-04 Sold (Public Records) $17,500 Public Records
Property tax history
+1.2%/yrLatest (2026): $1,481 · +7.2% YoY. Source: county tax records.
Cash-flow waterfall
monthlySold comps — $/sqft
last 12 mo · ≤1 miLoading sold comps…