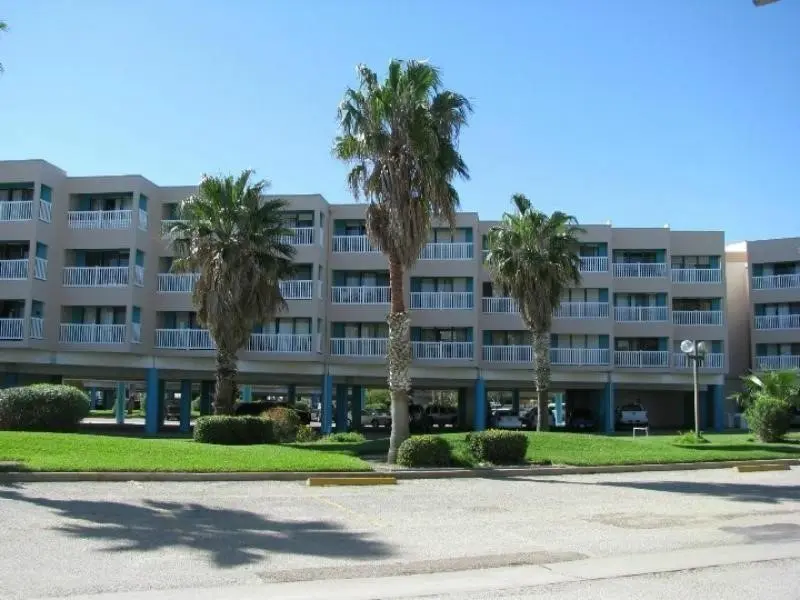
3938 Surfside Blvd #3106 · Corpus Christi, TX
Flood risk No data
- FEMA flood zone
- —
- Chance of flooding over 30 yrs
- —
- Est. flood insurance / yr
- —
Fire risk No data
- Est. fire insurance / yr
- —
Heat risk No data
- Hot days now (above threshold)
- —
- Hot days in 30 yrs
- —
Wind risk No data
- Chance of severe wind over 30 yrs
- —
Air-quality risk No data
- Unhealthy air days now
- —
- Unhealthy air days in 30 yrs
- —
Risk factors via First Street. Map © Google.
Why this score? — see what drove the D grade
The composite is a weighted blend of 9 inputs, each scored 0–100. Each bar is that input's sub-score; the figure is the points it added to the 100-point composite (weight × sub-score).
- Cash flow +10.2/30.0
- 1% rule +10.0/10.0
- ARV discount +7.5/15.0
- Condition / age +4.0/5.0
- Livability +3.9/5.0
- DSCR +2.9/10.0
- Schools +2.8/10.0
- Rent growth +2.5/5.0
- Appreciation +0.1/10.0
$55,000
🖨 Deal sheet 📄 Offer letter ✓ Due diligence
Listing remarks
GREAT RENTAL INVESTMENT OPPORTUNITY! Step into coastal living with this nicely decorated 1-bedroom, 1-bath condo located right on the beach. Enjoy breathtaking sunrise and sunset views from your private balcony, where the salt air, rolling waves, and sandy shoreline create the perfect backdrop for relaxation. Inside, the condo is move-in ready, offering tasteful décor and a warm, inviting atmosphere ideal for full-time living, a weekend getaway, or a short-term rental. With the beach just steps away, you’ll experience the true essence of coastal living every day. Conveniently located near the Texas State Aquarium, USS Lexington, and just over the New Bridge from downtown Corpus
Key facts
- Private balcony
- Near uss lexington
- $575 HOA
Tags
Property features AI
Finance
- HOA & community: Homeowners association with monthly fee; Association fee includes common areas, cable TV, insurance, internet, grounds maintenance, structure maintenance, security, trash, and water; Community amenities: beach rights, beach access, controlled access, gated entry, laundry, pool, trails; Short-term rentals allowed
Exterior
- Parking: Covered parking with asphalt and concrete surfaces; 2 total parking spaces
- Security: Gated community; Smoke detector(s)
- Utilities: Public water; Public sewer
- Home design: Single-story; Pillar/post/pier foundation
- Construction: Stucco construction
- Exterior features: Covered patio; Patio; Chain link and wood fencing; Automatic gate; Private in-ground pool; Bay front waterfront; Has a view
Interior
- Kitchen: Electric cooktop; Refrigerator
- Flooring: Laminate flooring
- Bathrooms: 1 full bathroom
- Heating & cooling: Central heating (electric); Central air conditioning
- Interior features: Window coverings; Air filtration; Cable TV; Window treatments
Neighborhood map
What this means for you Summary
Snapshot
- This is a 1-bed/1.0-bath condo listed at $55k. Condition is rated good.
Deal economics
- At list price, monthly cash flow is $-32 ($-379/yr) — negative.
- To cash-flow at today's rent, offer at most $50k (8.3% below list).
- Meets the 1% rule at list price ($1k rent vs $55k).
- Recommended offer: $50k (8.3% below list) — sets the bar for cash-flow.
- Cap rate 5.6% vs local median 3.6% in Corpus Christi — top-decile yield for the area; either an underpriced asset or a hidden risk that comps aren't pricing in. Stress-test before assuming the spread holds.
Location & tenants
- Location reads 78/100 on livability (#66 in TX, #2,404 nationally) — a middle-class / working-renter tenant base. Strengths: commute A+, cost of living A+, housing A+; Watch: crime F.
- Corpus Christi ISD (urban): math 31% / reading 35% proficiency, ranked #562 of 826 in TX (top 68%) — families likely to look elsewhere, expect single-tenant / working-renter base with shorter leases; 63% free/reduced lunch — lower-income household profile, screen leases tightly.
- Market conditions: 72 active listings in the ZIP; 1,397 units permitted in Nueces County in 2024 (47 in 5+ unit buildings).
Forward outlook
- Local home prices are declining (-3.0%/yr); year-one equity from $380 of loan paydown is wiped out by about $2k of value loss. Plan a longer hold.
- Nueces County population projected at +36% by 2050 — long-run rental-demand tailwind backs the buy-and-hold thesis.
Negotiation context
- It's been on market 41 days — a 3% lower offer ($53k) is reasonable based on typical stale-listing flexibility.
- 6 sale attempts since 15y ago; this cycle's ask has dropped $14k (20%) from the opening price — seller is motivated, your offer sets the floor, not the list.
Risks & watch-outs
- Watch-outs: HOA is 49% of rent.
Questions for the listing agent
- What do current leases actually rent for vs. the listed asking? Can we see a recent rent roll and the last 12 months of T-12 income?
- It's been on market 41 days. Have you received any prior offers? Is the seller open to a 8% concession, seller financing, or rate buy-down credit?
- What does the HOA fee cover, when was the last increase, and are there any pending special assessments or reserve-fund shortfalls?
- Any open or pending special assessments — roof, HVAC, plumbing, elevator, façade? What's the per-unit balance and payoff schedule, and is the seller paying it off at close or rolling it to the buyer?
- Is there a deadline driving the sale (1031 exchange, divorce, estate, relocation)? That informs how much negotiation room exists.
- Crime grade is F in this area — have there been break-ins, vandalism, or insurance claims at this property in the last 3 years? What carrier currently insures it and at what premium?
- The area grade is low — what's the realistic commute time and amenity access for the typical tenant pool here? Any planned neighborhood developments (good or bad) we should know about?
- What's the average days-on-market for RENTAL listings here right now (not sales)? A rising rental-DOM trend means longer vacancies and softer asking-rent achievability than the comps imply.
- What's the recent tenant-quality profile in this submarket — average credit score on applications, eviction rate, late-payment / NSF rate, and stable-employment percentage? A property-management company in the area should have these aggregated.
- How much new apartment / multifamily construction is in the pipeline within 1–3 miles? Heavy new supply (>2% of stock underway) typically softens rents 12–24 months out; light construction supports rent growth.
Investment metrics
- 1% rule
- 2.13% ✓
- Cap rate
- 5.60%
- Cash-on-cash
- -2.46%
- DSCR
- 0.89
- GRM
- 3.9
CMA / ARV
- ARV (median comp)
- $118,173
- List price
- $55,000
- Delta
- -53.46%
- Verdict
- UNDERPRICED
- Comps
- 20 within 1.0 mi
Projected returns pro-forma
-3.0% appreciation · 3.0% rent growth · sell at horizon
- IRR
- -19.5%
- Equity multiple
- 0.31×
- Total profit
- $-10,555
- Equity at exit
- $8,201
- IRR
- -10.7%
- Equity multiple
- 0.33×
- Total profit
- $-10,277
- Equity at exit
- $4,755
Cash invested: $15,400 (down + closing). Projections, not guarantees.
Landlord ↔ Tenant lean methodology
- Overall (STATE)
- 87 Strongly Landlord-Friendly
- State Texas
- 87 Strongly Landlord-Friendly · R+5
- County
- — inherits STATE
- City
- — inherits STATE
ZIP-level market 78402
- Home prices YoY
- -8.8%
- Active inventory
- 72
- Price-to-rent
- 3.9×
Monthly cashflow live
- Estimated rent
- $1,169 medium interval (Pro) →
- Mortgage (P&I)
- −$288
- Tax est. 1.5%
- −$69 /mo · $825/yr
- Insurance
- −$23
- HOA
- −$575
- Vacancy / Maint / Mgmt
- −$245
- Net cashflow
- $-32
Break-even live
UW: 25.0% down · 7.5% · 30yr · 1.5% tax · 5.0% vac · 8.0% maint · 8.0% mgmt
Financing live
Cash to close
- Down payment
- $13,750
- Closing costs
- $1,650
- Reserves months
- —
- Total cash needed
- —
Loan-product check · same deal, 3 products live
Conventional
25% down · 7.5% · 30yr
- Down + closing
- —
- Monthly P&I
- —
- Monthly cashflow
- —
- DSCR
- —
- Eligible?
- —
Personal DTI + credit; lowest rate.
DSCR
20% down · 8.5% · 30yr
- Down + closing
- —
- Monthly P&I
- —
- Monthly cashflow
- —
- DSCR
- —
- Eligible?
- —
No personal income docs; deal must DSCR.
Hard money
10% down · 12.0% · 12mo
- Down + closing
- —
- Monthly P&I
- —
- Monthly cashflow
- —
- DSCR
- —
- Eligible?
- —
Short-term bridge; refi at stabilization.
HOA detail condo
- Monthly dues
- $575 · $6,900/yr
- Assessments
- None detected in remarks — confirm with the listing agent.
Listing history 24 events
-
2026-06-18days on market $55,000 Active 41 DOM
-
2026-06-17days on market $55,000 Active 40 DOM
-
2026-06-16days on market $55,000 Active 39 DOM
-
2026-06-15remarks 686-char remark
-
2026-06-15pricedays on market $55,000 Active 38 DOM
-
2026-06-14days on market $65,000 Active 36 DOM
-
2026-06-10days on market $65,000 Active 33 DOM
-
2026-06-09days on market $65,000 Active 32 DOM
-
2026-06-08days on market $65,000 Active 31 DOM
-
2026-06-07days on market $65,000 Active 30 DOM
-
2026-06-05days on market $65,000 Active 27 DOM
-
2026-06-03days on market $65,000 Active 26 DOM
-
2026-06-02days on market $65,000 Active 25 DOM
-
2026-06-01days on market $65,000 Active 24 DOM
-
2026-05-31days on market $65,000 Active 23 DOM
-
2026-05-30days on market $65,000 Active 22 DOM
-
2026-05-08$68,500 Active 771-char remark
-
2024-11-07status Active
-
2024-04-18price $115,000
-
2024-03-26$120,000 Active
-
2023-09-05price $130,000
-
2023-09-04$150,000 Active
-
2014-03-22$69,500
-
2011-09-22$65,000
ⓘ Source: listings_history table (triggers on properties + properties_extension) + one-shot
backfill from property_details.listing_events for pre-trigger history.
Nearby sold comps map
Loading sold comps map…
Walkable amenities ~0.75 mi
Loading nearby amenities…
Taxation est. · year 1
- Rental income
- $14,028
- − Mortgage interest
- −$3,081
- − Property taxes
- −$825
- − Insurance
- −$275
- − Repairs & maintenance
- −$1,122
- − Management
- −$1,122
- − HOA
- −$6,900
- − Depreciation
- −$1,600
- Taxable loss
- −$898
- Est. tax savings @ 24.0%
- +$215
- After-tax cash flow
- $-164/yr
For passive investors: Depreciation is non-cash, so a rental often shows a tax loss while cash-flowing — sheltering income. Rental losses are passive: they offset passive income freely, and up to $25,000/yr can offset ordinary (W-2) income if you actively participate and your MAGI is under $100k (phasing out to $0 by $150k); unused losses carry forward. On sale, claimed depreciation is recaptured at up to 25%, and gains may owe capital-gains tax (a 1031 exchange can defer both). Figures are a year-1 estimate at your 24.0% rate — not tax advice; consult a CPA.
Condition & rehab AI · 12 photos
This move-in ready beachfront condo offers stunning views and a cozy, well-maintained interior. Minor updates to the kitchen and bathroom would significantly enhance its value.
Repairs flagged
- Minor kitchen cabinets — Light scratches and wear
- Minor bathroom tiles — Some minor staining
Value-add opportunities
- Both Paint exterior — Enhances curb appeal and value
- Both Replace kitchen cabinets — Improves functionality and aesthetics
- Both Replace bathroom tiles — Enhances functionality and aesthetics
Renovation cost estimate screening
| Repair item | Severity | Est. cost |
|---|---|---|
| kitchen cabinets · Light scratches and wear | Minor | $500–3,000 |
| bathroom tiles · Some minor staining | Minor | $500–3,000 |
| Total estimated repair cost · 2 items | $1,000–6,000 |
Value-add ROI direction
- Both Paint exterior — Enhances curb appeal and value ↑
- Both Replace kitchen cabinets — Improves functionality and aesthetics ↑
- Both Replace bathroom tiles — Enhances functionality and aesthetics ↑
ⓘ Cost ranges are severity-bucket heuristics (US national rule-of-thumb). Get contractor quotes + a written scope before underwriting a rehab budget.
Schools (NCES district)
- District
- Corpus Christi ISD
- NCES district ID
- 4815270
- Math proficiency
- 31% ▼ -18.00%
- Reading proficiency
- 35% ▼ -7.00%
- Median HH income
- $45,672
- Composite
- 28.27/100
- National rank
- #6793
- State rank
- #562 of 826 in TX
Livability — Corpus Christi
- Score
- 78/100
- State rank
- #66
- US rank
- #2404
Category grades
Schools grade is shown separately in the Schools card above.
Census & demographics
- Census place
- Corpus Christi, TX
- City population
- 296,836
- Population (ZIP)
- 392
Population outlook (Nueces County) Hauer SSP2
- Today (2025)
- 418,037 people
- By 2030
- 447,123 · +7.0%
- By 2040
- 505,911 · +21.0%
- By 2050
- 567,522 · +35.8%
- By 2075
- 729,686 · +74.6%
- By 2100
- 847,087 · +102.6%
Race, ethnicity, and origin ACS 2023
- Neighborhood character
- Diverse neighborhood (Simpson 0.57)
- Race & ethnicity
- White 62% Hispanic / Latino 19% Two or more races 17% Black 9%
- Hispanic origin (detail)
- Mexican 16%
- Common ancestry
- Slovak 2%
- Foreign-born
- 3% · Canada
- Languages at home
- 91% English-only · Spanish 7% German/W. Germanic 2%
Political lean MEDSL · Nueces
- 2024 margin
- R (+11.5) · D 43.8% · R 55.3%
- 2008→2024 swing
- -7.1pp toward R · 2008: -4.4pp · 2024: -11.5pp
- All cycles
- 2024: R+11.5 2020: R+2.9 2016: R+1.5 2012: R+3.2 2008: R+4.4
Not yet ingested
- Civics
- —
Market trends
- HPI YoY
- ▼ -9.74%
- Current HPI
- 101.5421
- Rent YoY
- —
- Metro
- —
- State GDP YoY
- ▲ 3.95%
- F500 in state
- 110
Industry mix (Fortune 500 HQ in TX)
| Industry | F500 HQs | Revenue |
|---|---|---|
| Energy | 16 | $1,198B |
|
||
| Technology | 5 | $198B |
|
||
| Engineering / Construction | 4 | $72B |
|
||
| Energy Services | 3 | $60B |
|
||
| Utilities | 3 | $41B |
|
||
| Healthcare | 2 | $330B |
|
||
Price history
-15.4% since first listed10 events — show timeline
- 2026-06-10 Price Changed $55,000 CBMLS
- 2026-05-28 Price Changed $65,000 CBMLS
- 2026-05-08 Listed $68,500 CBMLS
- 2024-11-07 Relisted — CBMLS
- 2024-04-18 Price Changed $115,000 CBMLS
- 2024-03-26 Listed $120,000 CBMLS
- 2023-09-05 Price Changed $130,000 CBMLS
- 2023-09-04 Listed $150,000 CBMLS
- 2014-03-22 Listed $69,500 CBMLS
- 2011-09-22 Listed $65,000 CBMLS
Cash-flow waterfall
monthlySold comps — $/sqft
last 12 mo · ≤1 miLoading sold comps…