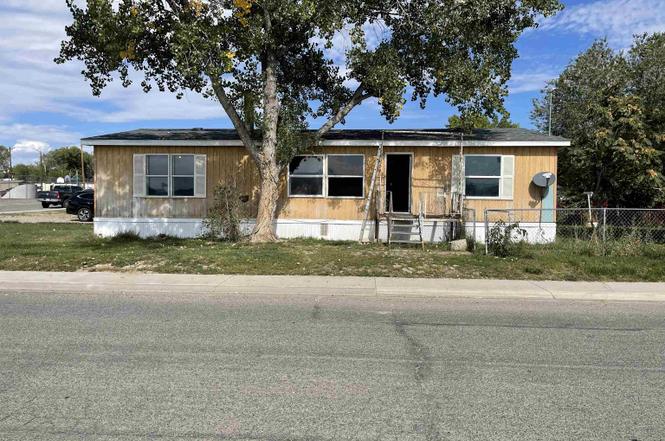
576 Stewart St · De Beque, CO
Flood risk 1/10 · Minimal
- FEMA flood zone
- X (unshaded)
- Chance of flooding over 30 yrs
- 0.0%
- Est. flood insurance / yr
- $507 – $1,088
Fire risk 5/10 · Moderate
- Est. fire insurance / yr
- $939 – $1,743
Heat risk 5/10 · Moderate
- Hot days now (above 94°F)
- 7 days/yr
- Hot days in 30 yrs
- 19 days/yr
Wind risk 1/10 · Minimal
- Chance of severe wind over 30 yrs
- —
Air-quality risk 1/10 · Minimal
- Unhealthy air days now
- 0 days/yr
- Unhealthy air days in 30 yrs
- 0 days/yr
Risk factors via First Street. Map © Google.
Why this score? — see what drove the C- grade
The composite is a weighted blend of 9 inputs, each scored 0–100. Each bar is that input's sub-score; the figure is the points it added to the 100-point composite (weight × sub-score).
- Cash flow +13.5/30.0
- ARV discount +12.1/15.0
- Appreciation +10.0/10.0
- DSCR +4.1/10.0
- 1% rule +3.8/10.0
- Schools +2.7/10.0
- Livability +2.7/5.0
- Rent growth +2.5/5.0
- Condition / age +2.5/5.0
$169,000
🖨 Deal sheet (PDF) 📄 Offer letter ✓ Due diligence
Listing remarks
Great quiet street in little town of Debeque across from the school. Mobile home is not purged, but Seller will issue Bill of sale. All information is subject to buyer checking sq footage
Key facts
- Quiet street
- Across from school
- 6,250 sq ft lot
Tags
Property features AI
Finance
- Other: Property currently used as a single-family residence; Elevation approximately 4,380 ft
Exterior
- Utilities: Public water; Sewer connected
- Home design: Double wide mobile home; Residential property; Faces north
- Construction: Metal siding; Asphalt/composition roof
- Exterior features: Deck; Landscaped corner lot; Gravel road frontage (public maintained city street)
Interior
- Kitchen: Dishwasher; Electric oven; Electric range; Garbage disposal; Refrigerator
- Flooring: Laminate flooring; Linoleum flooring
- Heating & cooling: Forced air heating; Wood stove heating; Ceiling fans for cooling; Evaporative cooling
- Interior features: Ceiling fans throughout; Wood-burning stove fireplace
Neighborhood map
What this means for you Summary
Snapshot
- This is a 3-bed/2.0-bath manufactured listed at $169k.
Deal economics
- At list price, monthly cash flow is $5 ($58/yr) — positive.
- The deal already cash-flows at list — no discount required.
- To meet the 1% rule (rent ≥ 1% of price), the offer needs to be $148k (12.2% below list).
- Recommended offer: $148k (12.2% below list) — sets the bar for 1% rule.
Location & tenants
- Location reads 53/100 on livability (#365 in CO) — a working-class tenant base; expect higher turnover. Strengths: housing A+, cost of living A; Watch: schools F, crime F, amenities F.
- De Beque Joint District No. 49 Of The Counties Of Mesa And (rural): math 15% / reading 40% proficiency, ranked #119 of 176 in CO (top 68%) — low school quality limits family demand, transient renter base, plan for 1-2y turnover.
- Market conditions: 23 active listings in the ZIP; 1,014 units permitted in Mesa County in 2024 (240 in 5+ unit buildings).
Forward outlook
- In year one you build about $18k of equity ($1k loan paydown + $17k appreciation (10.0% local appreciation)).
- At projected returns (10.0% appreciation + 3.0% rent growth), your $47k cash investment doubles in ~3 years — after that, you're playing with house money.
- By year 3, paydown + projected appreciation supports a ~$46k cash-out refi (75% LTV) — recoverable capital for the next deal without selling this one.
Negotiation context
- It's been on market 629 days — a 12% lower offer ($149k) is reasonable based on typical stale-listing flexibility.
Risks & watch-outs
- Climate carrying-cost: moderate wildfire risk; extreme-heat days projected 7→19/yr by 2055 (HVAC capex compounding) — expect insurance premiums to compound above CPI over the hold.
Questions for the listing agent
- It's been on market 629 days. Have you received any prior offers? Is the seller open to a 12% concession, seller financing, or rate buy-down credit?
- Why hasn't it sold? Are there any deal-killer items the seller is aware of (foundation, flood, title, zoning, code violations)?
- Is there a deadline driving the sale (1031 exchange, divorce, estate, relocation)? That informs how much negotiation room exists.
- Schools are F-rated, which usually means shorter tenancies and higher turnover. Who's the typical renter profile here, and what's been the actual vacancy rate?
- Crime grade is F in this area — have there been break-ins, vandalism, or insurance claims at this property in the last 3 years? What carrier currently insures it and at what premium?
- What's the average days-on-market for RENTAL listings here right now (not sales)? A rising rental-DOM trend means longer vacancies and softer asking-rent achievability than the comps imply.
- What's the recent tenant-quality profile in this submarket — average credit score on applications, eviction rate, late-payment / NSF rate, and stable-employment percentage? A property-management company in the area should have these aggregated.
- How much new for-sale + rental construction is in the pipeline within 1–3 miles? Heavy new supply typically softens prices + rents 12–24 months out; constrained supply supports both.
Investment metrics
- 1% rule
- 0.88% ✗
- Cap rate
- 6.33%
- Cash-on-cash
- 0.12%
- DSCR
- 1.01
- GRM
- 9.5
CMA / ARV
- ARV (on-the-fly)
- $188,160
- Comps found
- 1
Show comp detail 1 sale within ~0.75 mi
| Address | Dist | Beds/Ba | Sqft | Sold | Price | $/sf | Match |
|---|---|---|---|---|---|---|---|
| 548 Lena Ln | 0.05mi | 3/2.0 | 1,536 (+14%) | 1mo | $215,000 | $140 | 73 |
Match score weights: distance 35% · size 25% · config 20% · recency 20%. Top-matched comps best support the ARV.
Projected returns pro-forma
10.0% appreciation · 3.0% rent growth · sell at horizon
- IRR
- 24.4%
- Equity multiple
- 2.95×
- Total profit
- $92,372
- Equity at exit
- $152,249
- IRR
- 21.6%
- Equity multiple
- 6.74×
- Total profit
- $271,823
- Equity at exit
- $328,330
Cash invested: $47,320 (down + closing). Projections, not guarantees.
Landlord ↔ Tenant lean methodology
- Overall (STATE)
- 38 Tenant-Leaning
- State Colorado
- 38 Tenant-Leaning · D+4
- County
- — inherits STATE
- City
- — inherits STATE
ZIP-level market 81630
- Home prices YoY
- 10.1%
- Active inventory
- 23
- Price-to-rent
- 9.5×
Monthly cashflow live
- Estimated rent
- $1,484 medium interval (Pro) →
- Mortgage (P&I)
- −$886
- Tax est. 1.5%
- −$211 /mo · $2,535/yr
- Insurance
- −$70
- HOA
- −$0
- Vacancy / Maint / Mgmt
- −$312
- Net cashflow
- $5
Break-even live
Sensitivity live
| Price | -10% $122 | -5% $63 | +0% $5 | +5% $-54 | +10% $-112 |
|---|---|---|---|---|---|
| Rent | -10% $-112 | -5% $-54 | +0% $5 | +5% $63 | +10% $122 |
| Rate | -1.0pp $90 | -0.5pp $48 | base $5 | +0.5pp $-39 | +1.0pp $-84 |
UW: 25.0% down · 7.5% · 30yr · 1.5% tax · 5.0% vac · 8.0% maint · 8.0% mgmt
Financing live
Cash to close
- Down payment
- $42,250
- Closing costs
- $5,070
- Reserves months
- —
- Total cash needed
- —
Loan-product check · same deal, 3 products live
Conventional
25% down · 7.5% · 30yr
- Down + closing
- —
- Monthly P&I
- —
- Monthly cashflow
- —
- DSCR
- —
- Eligible?
- —
Personal DTI + credit; lowest rate.
DSCR
20% down · 8.5% · 30yr
- Down + closing
- —
- Monthly P&I
- —
- Monthly cashflow
- —
- DSCR
- —
- Eligible?
- —
No personal income docs; deal must DSCR.
Hard money
10% down · 12.0% · 12mo
- Down + closing
- —
- Monthly P&I
- —
- Monthly cashflow
- —
- DSCR
- —
- Eligible?
- —
Short-term bridge; refi at stabilization.
Listing history 24 events
-
2026-06-21days on market $169,000 Active 629 DOM
-
2026-06-19days on market $169,000 Active 627 DOM
-
2026-06-18days on market $169,000 Active 626 DOM
-
2026-06-17days on market $169,000 Active 625 DOM
-
2026-06-16days on market $169,000 Active 624 DOM
-
2026-06-15days on market $169,000 Active 623 DOM
-
2026-06-13days on market $169,000 Active 621 DOM
-
2026-06-12pricedays on market $169,000 Active 620 DOM
-
2026-06-09days on market $169,900 Active 617 DOM
-
2026-06-08days on market $169,900 Active 616 DOM
-
2026-06-07days on market $169,900 Active 615 DOM
-
2026-06-05days on market $169,900 Active 613 DOM
-
2026-06-04days on market $169,900 Active 611 DOM
-
2026-06-02days on market $169,900 Active 610 DOM
-
2026-06-01days on market $169,900 Active 609 DOM
-
2026-05-31days on market $169,900 Active 608 DOM
-
2026-05-31days on market $169,900 Active 607 DOM
-
2025-12-09price $169,900
-
2025-10-13price $199,900
-
2025-08-08price $225,000
-
2025-06-02price $255,000
-
2025-03-28price $269,000
-
2025-02-21price $279,000
-
2024-09-28$299,000 Active
ⓘ Source: listings_history table (triggers on properties + properties_extension) + one-shot
backfill from property_details.listing_events for pre-trigger history.
Climate risk First Street
- Flood 1/10 Low FEMA zone X (unshaded) · 0% chance over 30 yrs
- Wildfire 5/10 Major
- Heat 5/10 Major 7 d/yr ≥94°F today · 19 d/yr by 30 yrs out
- Wind 1/10 Low
- Air quality 1/10 Low 0 unhealthy d/yr today · 0 by 30 yrs out
Nearby sold comps map
Loading sold comps map…
Walkable amenities ~0.75 mi
Loading nearby amenities…
Taxation est. · year 1
- Rental income
- $17,814
- − Mortgage interest
- −$9,467
- − Property taxes
- −$2,535
- − Insurance
- −$845
- − Repairs & maintenance
- −$1,425
- − Management
- −$1,425
- − Depreciation
- −$4,916
- Taxable loss
- −$2,799
- Est. tax savings @ 24.0%
- +$672
- After-tax cash flow
- $730/yr
For passive investors: Depreciation is non-cash, so a rental often shows a tax loss while cash-flowing — sheltering income. Rental losses are passive: they offset passive income freely, and up to $25,000/yr can offset ordinary (W-2) income if you actively participate and your MAGI is under $100k (phasing out to $0 by $150k); unused losses carry forward. On sale, claimed depreciation is recaptured at up to 25%, and gains may owe capital-gains tax (a 1031 exchange can defer both). Figures are a year-1 estimate at your 24.0% rate — not tax advice; consult a CPA.
Schools (NCES district)
- District
- De Beque Joint District No. 49 Of The Counties Of Mesa And
- NCES district ID
- 0803240
- Math proficiency
- 15% ▼ -5.00%
- Reading proficiency
- 40% ▲ 10.00%
- Median HH income
- $54,591
- Composite
- 27.46/100
- National rank
- #12381
- State rank
- #119 of 176 in CO
Livability — De Beque
- Score
- 53/100
- State rank
- #365
- US rank
- #24269
Category grades
Schools grade is shown separately in the Schools card above.
Census & demographics
- Census place
- De Beque, CO
- Population (ZIP)
- 1,052
Population outlook (Mesa County) Hauer SSP2
- Today (2025)
- 153,000 people
- By 2030
- 154,479 · +1.0%
- By 2040
- 155,257 · +1.5%
- By 2050
- 153,384 · +0.3%
- By 2075
- 144,735 · -5.4%
- By 2100
- 123,825 · -19.1%
Race, ethnicity, and origin ACS 2023
- Neighborhood character
- Predominantly White (79%)
- Race & ethnicity
- White 79% Two or more races 17% Hispanic / Latino 15%
- Hispanic origin (detail)
- Mexican 9%
- Common ancestry
- Lithuanian 5% Slovak 4% Romanian 4%
- Foreign-born
- 3% · Canada
- Languages at home
- 96% English-only · Spanish 3%
Political lean MEDSL · Mesa
- 2024 margin
- Strong R (+24.3) · D 36.6% · R 61.0% · Other 2.4%
- 2008→2024 swing
- +5.2pp toward D · 2008: -29.5pp · 2024: -24.3pp
- All cycles
- 2024: R+24.3 2020: R+28.0 2016: R+36.3 2012: R+32.8 2008: R+29.5
Not yet ingested
- Civics
- —
Market trends
- HPI YoY
- ▲ 28.53%
- Current HPI
- 311.6725
- Rent YoY
- —
- Metro
- —
- State GDP YoY
- ▲ 1.95%
- F500 in state
- 14
Industry mix (Fortune 500 HQ in CO)
| Industry | F500 HQs | Revenue |
|---|---|---|
| Technology Distribution | 1 | $31B |
|
||
| Food / Agriculture | 1 | $18B |
|
||
| Packaging | 1 | $14B |
|
||
| Healthcare | 1 | $13B |
|
||
| Energy | 1 | $10B |
|
||
| Technology | 1 | $4B |
|
||
Price history
-43.2% since first listed7 events — show timeline
- 2025-12-09 Price Changed $169,900 GJARA
- 2025-10-13 Price Changed $199,900 GJARA
- 2025-08-08 Price Changed $225,000 GJARA
- 2025-06-02 Price Changed $255,000 GJARA
- 2025-03-28 Price Changed $269,000 GJARA
- 2025-02-21 Price Changed $279,000 GJARA
- 2024-09-28 Listed $299,000 GJARA
Property tax history
-4.3%/yrLatest (2025): $81 · +104.6% YoY. Source: county tax records.
Cash-flow waterfall
monthlySold comps — $/sqft
last 12 mo · ≤1 miLoading sold comps…