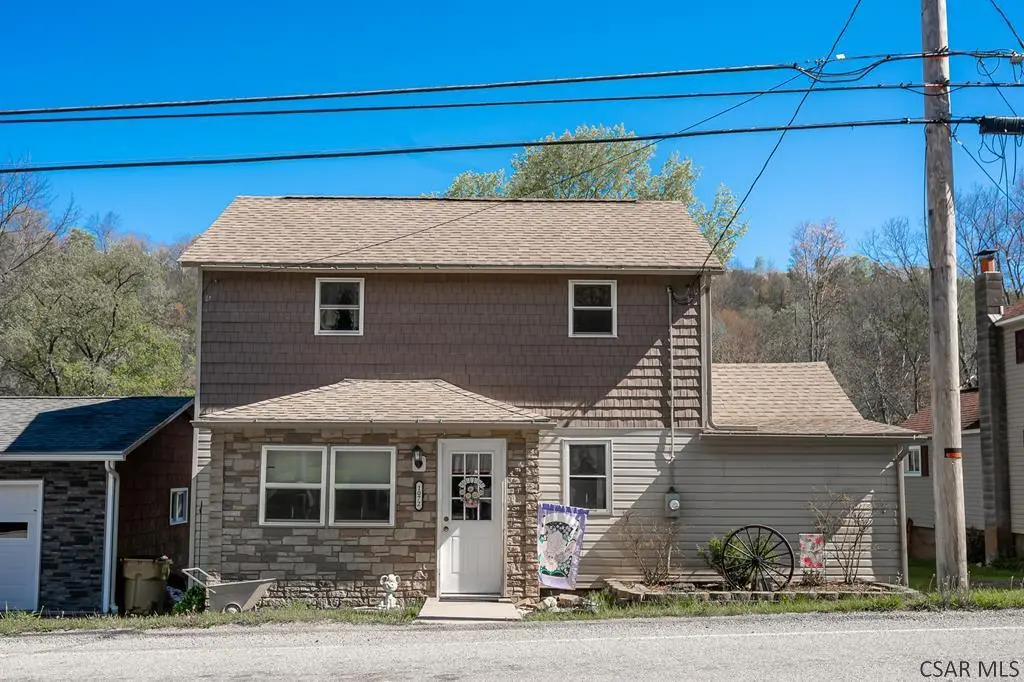
1072 Beaver Run Ave · Beaverdale, PA
Flood risk 9/10 · Severe
- FEMA flood zone
- X (unshaded)
- Chance of flooding over 30 yrs
- 0.99%
- Est. flood insurance / yr
- $473 – $860
Fire risk 2/10 · Minimal
- Est. fire insurance / yr
- $511 – $949
Heat risk 2/10 · Minimal
- Hot days now (above 89°F)
- 7 days/yr
- Hot days in 30 yrs
- 18 days/yr
Wind risk 2/10 · Minimal
- Chance of severe wind over 30 yrs
- —
Air-quality risk 2/10 · Minimal
- Unhealthy air days now
- 1 days/yr
- Unhealthy air days in 30 yrs
- 2 days/yr
Risk factors via First Street. Map © Google.
Why this score? — see what drove the C+ grade
The composite is a weighted blend of 9 inputs, each scored 0–100. Each bar is that input's sub-score; the figure is the points it added to the 100-point composite (weight × sub-score).
- Cash flow +24.3/30.0
- DSCR +7.8/10.0
- ARV discount +7.5/15.0
- 1% rule +5.4/10.0
- Appreciation +5.4/10.0
- Schools +3.7/10.0
- Livability +3.0/5.0
- Rent growth +2.5/5.0
- Condition / age +2.5/5.0
$113,000
🖨 Deal sheet 📄 Offer letter ✓ Due diligence
Listing remarks
Welcome home to this beautifully updated 3-bedroom, 2-story vinyl-sided home in Forest Hills School District. This energy efficient home featuresa newer roof, new windows and siding, and upgraded electrical and plumbing systems. The main floor has a stylish mix of luxury vinyl and classic hardwood flooring. The updated kitchen would not be complete without the stylish hickory cabinets, ample counter space, and new black stainless steel appliances. In addition to the kitchen, the main floor is designed for convenience, featuring a cozy living room, a separate dining room, an updated full bathroom with walk-in shower, and a first-floor laundry area. Conveniently, all three bedrooms are locate
Key facts
- Hardwood flooring
- Composite rear deck
- Hickory cabinets
Tags
Property features AI
Exterior
- Parking: Off-street parking; Paved parking
- Security: Smoke detector(s)
- Utilities: Public water; Public sewer; Sewer available
- Home design: Single family residence; Two levels
- Construction: Vinyl siding; Shingle roof; Full unfinished basement
- Exterior features: Deck; Porch; Irregular lot; Public maintained road frontage on a city street
Interior
- Kitchen: Dishwasher; Microwave; Range; Oven; Refrigerator
- Flooring: Hardwood; Vinyl; Wood
- Bathrooms: 1 full bathroom
- Heating & cooling: Forced air heating; Oil heating; Ceiling fan(s) for cooling
- Interior features: Pantry; High-speed internet; Double pane windows
- Laundry & utility: Main level laundry
Neighborhood map
What this means for you Summary
Snapshot
- This is a 3-bed/1.0-bath single-family listed at $113k.
Deal economics
- At list price, monthly cash flow is $171 ($2k/yr) — positive.
- The deal already cash-flows at list — no discount required.
- Meets the 1% rule at list price ($1k rent vs $113k).
Location & tenants
- Location reads 60/100 on livability (#1,446 in PA) — a middle-class / working-renter tenant base. Strengths: cost of living A+, housing A+; Watch: crime D+, schools F, amenities F.
- Forest Hills SD (rural): math 40% / reading 47% proficiency, ranked #293 of 539 in PA (top 54%) — families likely to look elsewhere, expect single-tenant / working-renter base with shorter leases.
- Market conditions: 4 active listings in the ZIP; 64 units permitted in Cambria County in 2024 (0 in 5+ unit buildings).
Forward outlook
- In year one you build about $2k of equity ($781 loan paydown + $943 appreciation (0.8% local appreciation)).
- Cambria County population projected at -28% by 2050 — secular population decline; favor cash flow + early exit over multi-decade hold.
- At projected returns (0.8% appreciation + 3.0% rent growth), your $32k cash investment doubles in ~7 years — after that, you're playing with house money.
Negotiation context
- Only 5 days on market — expect competitive offers; lowballing is unlikely to land.
Risks & watch-outs
- Watch-outs: flood insurance adds $56/mo; built in 1909 — expect roof / HVAC / electrical / plumbing capex.
- Climate carrying-cost: severe flood risk — expect insurance premiums to compound above CPI over the hold.
Questions for the listing agent
- Built in 1909 — when were the roof, HVAC, electrical panel, plumbing, and water heater last replaced?
- What's the actual annual flood-insurance premium (NFIP or private), and is the property in a SFHA with mandatory coverage?
- Is there a deadline driving the sale (1031 exchange, divorce, estate, relocation)? That informs how much negotiation room exists.
- Schools are F-rated, which usually means shorter tenancies and higher turnover. Who's the typical renter profile here, and what's been the actual vacancy rate?
- Crime grade is D in this area — have there been break-ins, vandalism, or insurance claims at this property in the last 3 years? What carrier currently insures it and at what premium?
- What's the average days-on-market for RENTAL listings here right now (not sales)? A rising rental-DOM trend means longer vacancies and softer asking-rent achievability than the comps imply.
- What's the recent tenant-quality profile in this submarket — average credit score on applications, eviction rate, late-payment / NSF rate, and stable-employment percentage? A property-management company in the area should have these aggregated.
- How much new for-sale + rental construction is in the pipeline within 1–3 miles? Heavy new supply typically softens prices + rents 12–24 months out; constrained supply supports both.
Investment metrics
- 1% rule
- 1.04% ✓
- Cap rate
- 8.70%
- Cash-on-cash
- 8.60%
- DSCR
- 1.38
- GRM
- 8.0
CMA / ARV
- ARV (median comp)
- $44,350
- List price
- $113,000
- Delta
- 154.79%
- Verdict
- OVERPRICED
- Comps
- 13 within 1.0 mi
Show comp detail 2 sales within ~0.75 mi
| Address | Dist | Beds/Ba | Sqft | Sold | Price | $/sf | Match |
|---|---|---|---|---|---|---|---|
| 629 Stewart St | 0.50mi | 3/1.0 | 1,280 (+3%) | 4mo | $15,000 | $12 | 67 |
| 213 Stewart St | 0.52mi | 2/1.0 (-1) | 1,296 (+5%) | 16mo | $66,500 | $51 | 50 |
Match score weights: distance 35% · size 25% · config 20% · recency 20%. Top-matched comps best support the ARV.
Projected returns pro-forma
0.83% appreciation · 3.0% rent growth · sell at horizon
- IRR
- 7.6%
- Equity multiple
- 1.38×
- Total profit
- $12,110
- Equity at exit
- $37,604
- IRR
- 11.8%
- Equity multiple
- 2.41×
- Total profit
- $44,698
- Equity at exit
- $49,230
Cash invested: $31,640 (down + closing). Projections, not guarantees.
Landlord ↔ Tenant lean methodology
- Overall (STATE)
- 62 Landlord-Friendly
- State Pennsylvania
- 62 Landlord-Friendly · EVEN
- County
- — inherits STATE
- City
- — inherits STATE
ZIP-level market 15955
- Home prices YoY
- 0.8%
- Active inventory
- 4
- Price-to-rent
- 8.0×
Monthly cashflow live
- Estimated rent
- $1,171 medium interval (Pro) →
- Mortgage (P&I)
- −$593
- Tax from tax record
- −$58 /mo · $699/yr
- Insurance
- −$47
- Flood insurance flood zone
- −$56 /mo · $666/yr
- HOA
- −$0
- Vacancy / Maint / Mgmt
- −$246
- Net cashflow
- $171
Break-even live
UW: 25.0% down · 7.5% · 30yr · 1.5% tax · 5.0% vac · 8.0% maint · 8.0% mgmt
Financing live
Cash to close
- Down payment
- $28,250
- Closing costs
- $3,390
- Reserves months
- —
- Total cash needed
- —
Loan-product check · same deal, 3 products live
Conventional
25% down · 7.5% · 30yr
- Down + closing
- —
- Monthly P&I
- —
- Monthly cashflow
- —
- DSCR
- —
- Eligible?
- —
Personal DTI + credit; lowest rate.
DSCR
20% down · 8.5% · 30yr
- Down + closing
- —
- Monthly P&I
- —
- Monthly cashflow
- —
- DSCR
- —
- Eligible?
- —
No personal income docs; deal must DSCR.
Hard money
10% down · 12.0% · 12mo
- Down + closing
- —
- Monthly P&I
- —
- Monthly cashflow
- —
- DSCR
- —
- Eligible?
- —
Short-term bridge; refi at stabilization.
Listing history 2 events
-
2026-05-04status Pending 982-char remark
-
2026-04-28$113,000 Active 982-char remark
ⓘ Source: listings_history table (triggers on properties + properties_extension) + one-shot
backfill from property_details.listing_events for pre-trigger history.
Tax reassessment forecast PA · Partial reset (capped growth)
- Current annual tax
- $699 · $58/mo
- Projected year-2 tax
- $1,242 · $104/mo
- Expected delta
- +$543/yr (+$45/mo · 77.7%)
ⓘ Screening estimate from a state-policy table — verify with the county assessor before closing.
Climate risk First Street
- Flood 9/10 Extreme FEMA zone X (unshaded) · 99% chance over 30 yrs
- Wildfire 2/10 Low
- Heat 2/10 Low 7 d/yr ≥89°F today · 18 d/yr by 30 yrs out
- Wind 2/10 Low
- Air quality 2/10 Low 1 unhealthy d/yr today · 2 by 30 yrs out
Nearby sold comps map
Loading sold comps map…
Walkable amenities ~0.75 mi
Loading nearby amenities…
Taxation est. · year 1
- Rental income
- $14,047
- − Mortgage interest
- −$6,330
- − Property taxes
- −$699
- − Insurance
- −$1,232
- − Repairs & maintenance
- −$1,124
- − Management
- −$1,124
- − Depreciation
- −$3,287
- Taxable income
- $252
- Est. tax owed @ 24.0%
- −$60
- After-tax cash flow
- $1,995/yr
For passive investors: Depreciation is non-cash, so a rental often shows a tax loss while cash-flowing — sheltering income. Rental losses are passive: they offset passive income freely, and up to $25,000/yr can offset ordinary (W-2) income if you actively participate and your MAGI is under $100k (phasing out to $0 by $150k); unused losses carry forward. On sale, claimed depreciation is recaptured at up to 25%, and gains may owe capital-gains tax (a 1031 exchange can defer both). Figures are a year-1 estimate at your 24.0% rate — not tax advice; consult a CPA.
Schools (NCES district)
- District
- Forest Hills SD
- NCES district ID
- 4209940
- Math proficiency
- 40% ▼ -8.00%
- Reading proficiency
- 47% ▼ -20.00%
- Median HH income
- $48,950
- Composite
- 37.27/100
- National rank
- #4452
- State rank
- #293 of 539 in PA
Livability — Beaverdale
- Score
- 60/100
- State rank
- #1446
- US rank
- #18543
Category grades
Schools grade is shown separately in the Schools card above.
Census & demographics
- Census place
- Beaverdale, PA
- City population
- 2,508
- Population (ZIP)
- 2,241
Population outlook (Cambria County) Hauer SSP2
- Today (2025)
- 122,754 people
- By 2030
- 115,827 · -5.6%
- By 2040
- 101,309 · -17.5%
- By 2050
- 88,379 · -28.0%
- By 2075
- 65,237 · -46.9%
- By 2100
- 46,909 · -61.8%
Race, ethnicity, and origin ACS 2023
- Neighborhood character
- Predominantly White (98%)
- Race & ethnicity
- White 98% Black 1%
- Common ancestry
- Romanian 7% Danish 3% Slovak 3%
- Foreign-born
- 0% · China
Political lean MEDSL · Cambria
- 2024 margin
- Solid R (+39.7) · D 29.8% · R 69.5%
- 2008→2024 swing
- -40.4pp toward R · 2008: 0.7pp · 2024: -39.7pp
- All cycles
- 2024: R+39.7 2020: R+37.3 2016: R+37.8 2012: R+17.8 2008: D+0.7
Not yet ingested
- Civics
- —
Market trends
- HPI YoY
- ▲ 0.83%
- Current HPI
- 105.6731
- Rent YoY
- —
- Metro
- —
- State GDP YoY
- ▲ 1.68%
- F500 in state
- 34
Industry mix (Fortune 500 HQ in PA)
| Industry | F500 HQs | Revenue |
|---|---|---|
| Healthcare | 2 | $309B |
|
||
| Insurance | 2 | $27B |
|
||
| Telecommunications / Media | 1 | $124B |
|
||
| Industrial Distribution | 1 | $22B |
|
||
| Financial Services | 1 | $20B |
|
||
| Chemicals / Materials | 1 | $18B |
|
||
Price history
2 events — show timeline
- 2026-05-04 Pending — CSMLS
- 2026-04-28 Listed $113,000 CSMLS
Property tax history
+1.6%/yrLatest (2026): $699 · +3.3% YoY. Source: county tax records.
Cash-flow waterfall
monthlySold comps — $/sqft
last 12 mo · ≤1 miLoading sold comps…