2950 Fountainville Rd · Andersonville, GA
Flood risk 1/10 · Minimal
- FEMA flood zone
- X (unshaded)
- Chance of flooding over 30 yrs
- 0.0%
- Est. flood insurance / yr
- $507 – $1,088
Fire risk 5/10 · Moderate
- Est. fire insurance / yr
- $963 – $1,789
Heat risk 7/10 · Major
- Hot days now (above 108°F)
- 7 days/yr
- Hot days in 30 yrs
- 18 days/yr
Wind risk 8/10 · Major
- Chance of severe wind over 30 yrs
- 80.0%
Air-quality risk 3/10 · Minor
- Unhealthy air days now
- 3 days/yr
- Unhealthy air days in 30 yrs
- 3 days/yr
Risk factors via First Street. Map © Google.
Why this score? — see what drove the D grade
The composite is a weighted blend of 9 inputs, each scored 0–100. Each bar is that input's sub-score; the figure is the points it added to the 100-point composite (weight × sub-score).
- Cash flow +14.5/30.0
- ARV discount +7.5/15.0
- Appreciation +6.6/10.0
- DSCR +4.4/10.0
- 1% rule +3.2/10.0
- Rent growth +2.5/5.0
- Livability +2.5/5.0
- Condition / age +2.5/5.0
- Schools +0.7/10.0
$139,000
🖨 Deal sheet (PDF) 📄 Offer letter ✓ Due diligence
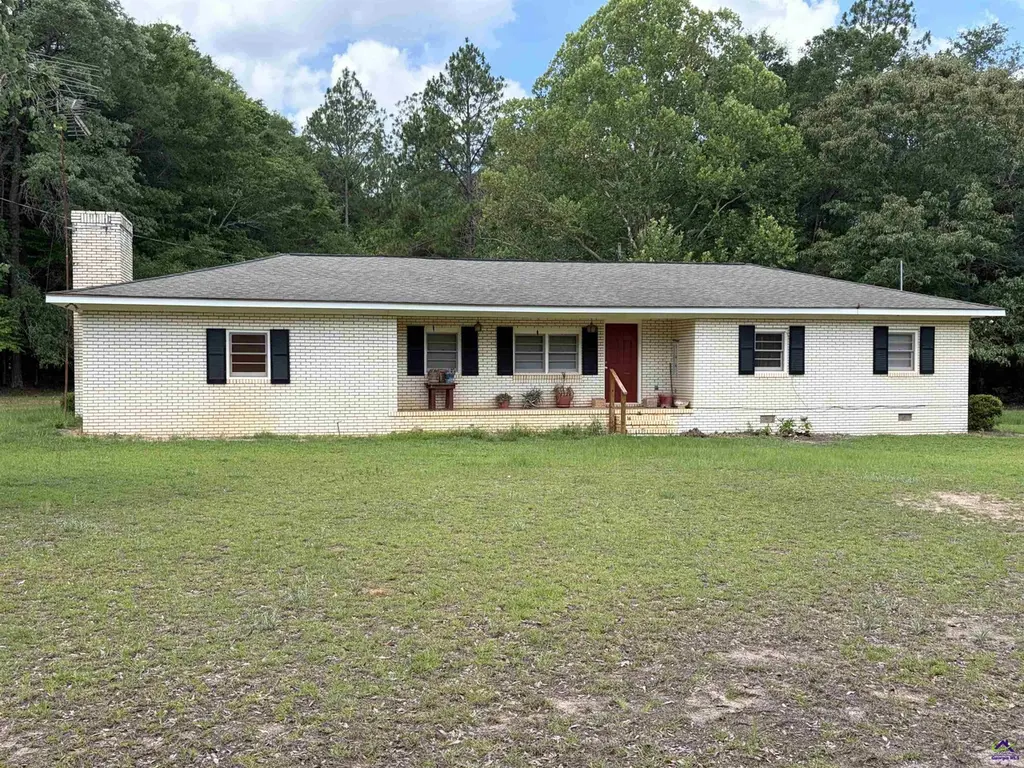
Listing remarks
Enjoy the serenity of country living in this all-brick home nestled on 2 acres. Bring your pets and plant the garden you've always wanted! Home offers 3 bedrooms, 2 full baths, spacious living area, wood burning fireplace, formal dining and living room. If you're looking for a home to make your own, then look no further. With a little imagination and renovation there's endless possibilities. Located only minutes from Ellaville and Oglethorpe. Pictures of inside coming soon. Call and schedule your showing today!
Key facts
- Formal dining
- 2 acres
- All brick home
Tags
Property features AI
Exterior
- Parking: Attached garage (1 covered parking space, total 1 parking space)
- Utilities: Well water; Septic tank
- Home design: Single-family residence; One level
- Construction: Brick construction
- Exterior features: Approximately 2-acre lot
Interior
- Kitchen: Electric range; Refrigerator
- Flooring: Carpet; Vinyl
- Bathrooms: Two full bathrooms
- Heating & cooling: Central heating; Central air conditioning
- Interior features: Wood-burning stove fireplace (1); Crawl space basement
Neighborhood map
What this means for you Summary
Snapshot
- This is a 3-bed/1.5-bath single-family listed at $139k.
Deal economics
- At list price, monthly cash flow is $31 ($377/yr) — positive.
- The deal already cash-flows at list — no discount required.
- To meet the 1% rule (rent ≥ 1% of price), the offer needs to be $113k (18.4% below list).
- Recommended offer: $113k (18.4% below list) — sets the bar for 1% rule.
Location & tenants
- Location reads 49/100 on livability (#588 in GA) — a working-class tenant base; expect higher turnover. Strengths: cost of living A+, crime A; Watch: amenities F, commute F, employment F.
- Macon County (town): math 5% / reading 14% proficiency, ranked #169 of 174 in GA (top 97%) — low school quality limits family demand, transient renter base, plan for 1-2y turnover; 78% free/reduced lunch — lower-income household profile, screen leases tightly.
- Zoned schools: Macon County Elementary School (math 8% / reading 12%, grade F, #1,092 of 1,228 statewide, top 91%, 511 students, 100% FRL); Macon County Middle School (math 6% / reading 18%, grade F, #417 of 470 statewide, top 90%, 263 students, 100% FRL); Macon County High School (math 5% / reading 5%, grade F, #394 of 424 statewide, top 97%, 340 students, 100% FRL) — zoned schools average 100% FRL vs 78% district-wide (22 pts higher); higher-poverty schools than district average — tighter screening recommended.
- Market conditions: 4 active listings in the ZIP; 13 units permitted in Macon County in 2024 (0 in 5+ unit buildings).
Forward outlook
- In year one you build about $5k of equity ($961 loan paydown + $4k appreciation (3.2% local appreciation)).
- Macon County population projected at -30% by 2050 — secular population decline; favor cash flow + early exit over multi-decade hold.
- At projected returns (3.2% appreciation + 3.0% rent growth), your $39k cash investment doubles in ~6 years — after that, you're playing with house money.
- By year 7, paydown + projected appreciation supports a ~$35k cash-out refi (75% LTV) — recoverable capital for the next deal without selling this one.
Negotiation context
- It's been on market 15 days — a 2% lower offer ($137k) is reasonable based on typical stale-listing flexibility.
- Current owner paid $14k; list at $139k implies a 872% gain — meaningful room to come down on a strong offer.
Risks & watch-outs
- Watch-outs: built in 1900 — expect roof / HVAC / electrical / plumbing capex.
- Climate carrying-cost: severe wind risk, 80% chance of damaging wind over 30y; moderate wildfire risk; extreme-heat days projected 7→18/yr by 2055 (HVAC capex compounding) — expect insurance premiums to compound above CPI over the hold.
Questions for the listing agent
- Built in 1900 — when were the roof, HVAC, electrical panel, plumbing, and water heater last replaced?
- Is there a deadline driving the sale (1031 exchange, divorce, estate, relocation)? That informs how much negotiation room exists.
- Schools are F-rated, which usually means shorter tenancies and higher turnover. Who's the typical renter profile here, and what's been the actual vacancy rate?
- The area grade is low — what's the realistic commute time and amenity access for the typical tenant pool here? Any planned neighborhood developments (good or bad) we should know about?
- What's the average days-on-market for RENTAL listings here right now (not sales)? A rising rental-DOM trend means longer vacancies and softer asking-rent achievability than the comps imply.
- What's the recent tenant-quality profile in this submarket — average credit score on applications, eviction rate, late-payment / NSF rate, and stable-employment percentage? A property-management company in the area should have these aggregated.
- How much new for-sale + rental construction is in the pipeline within 1–3 miles? Heavy new supply typically softens prices + rents 12–24 months out; constrained supply supports both.
Investment metrics
- 1% rule
- 0.82% ✗
- Cap rate
- 6.56%
- Cash-on-cash
- 0.97%
- DSCR
- 1.04
- GRM
- 10.2
CMA / ARV
No comps found within radius.
Projected returns pro-forma
3.23% appreciation · 3.0% rent growth · sell at horizon
- IRR
- 9.0%
- Equity multiple
- 1.53×
- Total profit
- $20,436
- Equity at exit
- $64,345
- IRR
- 11.4%
- Equity multiple
- 2.74×
- Total profit
- $67,782
- Equity at exit
- $100,623
Cash invested: $38,920 (down + closing). Projections, not guarantees.
Landlord ↔ Tenant lean methodology
- Overall (STATE)
- 90 Strongly Landlord-Friendly
- State Georgia
- 90 Strongly Landlord-Friendly · R+3
- County
- — inherits STATE
- City
- — inherits STATE
ZIP-level market 31711
- Home prices YoY
- 2.2%
- Active inventory
- 4
- Price-to-rent
- 10.2×
Monthly cashflow live
- Estimated rent
- $1,134 medium interval (Pro) →
- Mortgage (P&I)
- −$729
- Tax from tax record
- −$78 /mo · $930/yr
- Insurance
- −$58
- HOA
- −$0
- Vacancy / Maint / Mgmt
- −$238
- Net cashflow
- $31
Break-even live
Sensitivity live
| Price | -10% $110 | -5% $71 | +0% $31 | +5% $-8 | +10% $-47 |
|---|---|---|---|---|---|
| Rent | -10% $-58 | -5% $-13 | +0% $31 | +5% $76 | +10% $121 |
| Rate | -1.0pp $101 | -0.5pp $67 | base $31 | +0.5pp $-5 | +1.0pp $-41 |
UW: 25.0% down · 7.5% · 30yr · 1.5% tax · 5.0% vac · 8.0% maint · 8.0% mgmt
Financing live
Cash to close
- Down payment
- $34,750
- Closing costs
- $4,170
- Reserves months
- —
- Total cash needed
- —
Loan-product check · same deal, 3 products live
Conventional
25% down · 7.5% · 30yr
- Down + closing
- —
- Monthly P&I
- —
- Monthly cashflow
- —
- DSCR
- —
- Eligible?
- —
Personal DTI + credit; lowest rate.
DSCR
20% down · 8.5% · 30yr
- Down + closing
- —
- Monthly P&I
- —
- Monthly cashflow
- —
- DSCR
- —
- Eligible?
- —
No personal income docs; deal must DSCR.
Hard money
10% down · 12.0% · 12mo
- Down + closing
- —
- Monthly P&I
- —
- Monthly cashflow
- —
- DSCR
- —
- Eligible?
- —
Short-term bridge; refi at stabilization.
Listing history 13 events
-
2026-06-21days on market $139,000 Active 15 DOM
-
2026-06-19days on market $139,000 Active 13 DOM
-
2026-06-18days on market $139,000 Active 12 DOM
-
2026-06-17days on market $139,000 Active 11 DOM
-
2026-06-16days on market $139,000 Active 10 DOM
-
2026-06-15days on market $139,000 Active 9 DOM
-
2026-06-14days on market $139,000 Active 7 DOM
-
2026-06-13days on market $139,000 Active 6 DOM
-
2026-06-10days on market $139,000 Active 4 DOM
-
2026-06-09days on market $139,000 Active 3 DOM
-
2026-06-08days on market $139,000 Active 2 DOM
-
2026-06-07remarks 516-char remark
-
2026-06-07$139,000 Active 1 DOM
ⓘ Source: listings_history table (triggers on properties + properties_extension) + one-shot
backfill from property_details.listing_events for pre-trigger history.
Tax reassessment forecast GA · Resets to sale price
- Current annual tax
- $930 · $78/mo
- Projected year-2 tax
- $1,279 · $107/mo
- Expected delta
- +$349/yr (+$29/mo · 37.5%)
ⓘ Screening estimate from a state-policy table — verify with the county assessor before closing.
Climate risk First Street
- Flood 1/10 Low FEMA zone X (unshaded) · 0% chance over 30 yrs
- Wildfire 5/10 Major
- Heat 7/10 Severe 7 d/yr ≥108°F today · 18 d/yr by 30 yrs out
- Wind 8/10 Severe 80% chance of damaging wind over 30 yrs
- Air quality 3/10 Moderate 3 unhealthy d/yr today · 3 by 30 yrs out
Nearby sold comps map
Loading sold comps map…
Walkable amenities ~0.75 mi
Loading nearby amenities…
Taxation est. · year 1
- Rental income
- $13,606
- − Mortgage interest
- −$7,786
- − Property taxes
- −$930
- − Insurance
- −$695
- − Repairs & maintenance
- −$1,088
- − Management
- −$1,088
- − Depreciation
- −$4,044
- Taxable loss
- −$2,026
- Est. tax savings @ 24.0%
- +$486
- After-tax cash flow
- $863/yr
For passive investors: Depreciation is non-cash, so a rental often shows a tax loss while cash-flowing — sheltering income. Rental losses are passive: they offset passive income freely, and up to $25,000/yr can offset ordinary (W-2) income if you actively participate and your MAGI is under $100k (phasing out to $0 by $150k); unused losses carry forward. On sale, claimed depreciation is recaptured at up to 25%, and gains may owe capital-gains tax (a 1031 exchange can defer both). Figures are a year-1 estimate at your 24.0% rate — not tax advice; consult a CPA.
Schools (NCES district)
- District
- Macon County
- NCES district ID
- 1303450
- Math proficiency
- 5% ▼ -7.00%
- Reading proficiency
- 14% ▼ -4.00%
- Median HH income
- $29,832
- Composite
- 7.25/100
- National rank
- #9957
- State rank
- #169 of 174 in GA
Livability — Andersonville
- Score
- 49/100
- State rank
- #588
- US rank
- #25980
Category grades
Schools grade is shown separately in the Schools card above.
Census & demographics
- Population (ZIP)
- 783
Population outlook (Macon County) Hauer SSP2
- Today (2025)
- 12,210 people
- By 2030
- 11,442 · -6.3%
- By 2040
- 9,901 · -18.9%
- By 2050
- 8,575 · -29.8%
- By 2075
- 6,047 · -50.5%
- By 2100
- 4,043 · -66.9%
Race, ethnicity, and origin ACS 2023
- Neighborhood character
- Predominantly White (66%)
- Race & ethnicity
- White 66% Black 25% Hispanic / Latino 9%
- Hispanic origin (detail)
- Mexican 8% Cuban 1%
- Common ancestry
- Romanian 1% Scotch-Irish 1% Lithuanian 1%
- Foreign-born
- 6% · Canada
- Languages at home
- 91% English-only · Spanish 9%
Political lean MEDSL · Macon
- 2024 margin
- D (+17.9) · D 58.8% · R 40.9%
- 2008→2024 swing
- -13.0pp toward R · 2008: 30.9pp · 2024: 17.9pp
- All cycles
- 2024: D+17.9 2020: D+23.1 2016: D+27.2 2012: D+34.8 2008: D+30.9
Not yet ingested
- Civics
- —
Market trends
- HPI YoY
- ▲ 3.23%
- Current HPI
- 150.556
- Rent YoY
- —
- Metro
- —
- State GDP YoY
- ▲ 2.66%
- F500 in state
- 28
Industry mix (Fortune 500 HQ in GA)
| Industry | F500 HQs | Revenue |
|---|---|---|
| Paper / Packaging | 2 | $29B |
|
||
| Retail | 1 | $160B |
|
||
| Transportation / Logistics | 1 | $91B |
|
||
| Airlines | 1 | $62B |
|
||
| Consumer Goods | 1 | $47B |
|
||
| Utilities | 1 | $25B |
|
||
Price history
+872.0% since first listed2 events — show timeline
- 2026-06-06 Listed $139,000 CGMLS
- 1977-05-17 Sold (Public Records) $14,300 Public Records
Property tax history
+6.2%/yrLatest (2025): $930 · +0.9% YoY. Source: county tax records.
Cash-flow waterfall
monthlySold comps — $/sqft
last 12 mo · ≤1 miLoading sold comps…