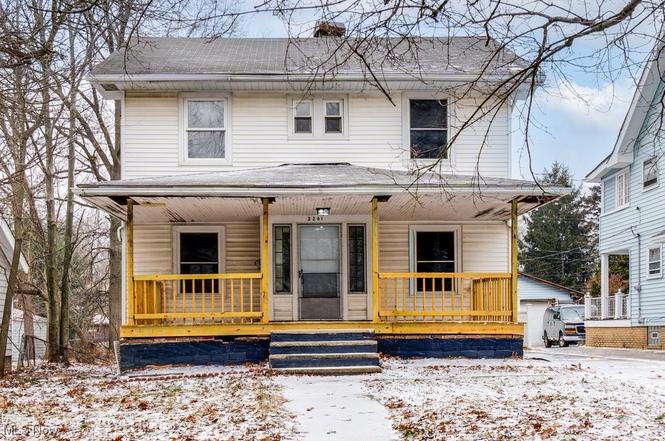
3261 Altamont Ave · Cleveland Heights, OH
Flood risk 1/10 · Minimal
- FEMA flood zone
- X (unshaded)
- Chance of flooding over 30 yrs
- 0.0%
- Est. flood insurance / yr
- $473 – $860
Fire risk 1/10 · Minimal
- Est. fire insurance / yr
- $713 – $1,323
Heat risk 2/10 · Minimal
- Hot days now (above 95°F)
- 7 days/yr
- Hot days in 30 yrs
- 16 days/yr
Wind risk 1/10 · Minimal
- Chance of severe wind over 30 yrs
- —
Air-quality risk 3/10 · Minor
- Unhealthy air days now
- 3 days/yr
- Unhealthy air days in 30 yrs
- 5 days/yr
Risk factors via First Street. Map © Google.
Why this score? — see what drove the C- grade
The composite is a weighted blend of 9 inputs, each scored 0–100. Each bar is that input's sub-score; the figure is the points it added to the 100-point composite (weight × sub-score).
- ARV discount +15.0/15.0
- Cash flow +12.5/30.0
- 1% rule +6.0/10.0
- Livability +4.5/5.0
- Rent growth +3.9/5.0
- DSCR +3.7/10.0
- Schools +2.8/10.0
- Condition / age +2.5/5.0
- Appreciation +0.0/10.0
$144,900
🖨 Deal sheet (PDF) 📄 Offer letter ✓ Due diligence
Listing remarks MLS
Clean, Move-in!cleve Hts Compliances!newer Energy Effic Windows+bath * 10 Yr Roof * Low Maintenance * Gas Budget $47 Fenced Yard * Roxboro Middle School * Front Porch * Hrwd Flrs
Key facts
- Remodeled kitchen
- Full basement
- Laundry hook ups
Tags
Neighborhood map
What this means for you Summary
Snapshot
- This is a 3-bed/1.0-bath single-family listed at $145k.
Deal economics
- At list price, monthly cash flow is $-22 ($-260/yr) — negative.
- To cash-flow at today's rent, offer at most $141k (2.6% below list).
- Meets the 1% rule at list price ($2k rent vs $145k).
- Recommended offer: $132k (9.0% below list) — sets the bar for market timing.
- Cap rate 6.1% vs local median 4.3% in Cleveland Heights — top-decile yield for the area; either an underpriced asset or a hidden risk that comps aren't pricing in. Stress-test before assuming the spread holds.
Location & tenants
- Location reads 89/100 on livability (#12 in OH, #124 nationally) — a professional / high-income tenant draw. Strengths: amenities A+, commute A+, cost of living A+.
- Cleveland Heights-University Heights City (suburban): math 23% / reading 41% proficiency, ranked #568 of 656 in OH (top 87%) — families likely to look elsewhere, expect single-tenant / working-renter base with shorter leases; 64% free/reduced lunch — lower-income household profile, screen leases tightly.
- Zoned schools: Cleveland Heights High School (math 12% / reading 46%, grade F, #627 of 781 statewide, top 81%, 1,664 students, 0% FRL) — zoned schools average 0% FRL vs 64% district-wide (64 pts lower); this property's tenant base skews higher-income than the district average.
- Market conditions: Rents rising fast (+5.7%/yr); 257 active listings in the ZIP; 40 comparable units currently listed for rent nearby; rentals at typical pace (median 26d on market — plan ~3-4 weeks tenant-placement turnaround); solid renter incomes; 1,441 units permitted in Cuyahoga County in 2024 (700 in 5+ unit buildings).
Forward outlook
- Local home prices are declining (-3.0%/yr); year-one equity from $1k of loan paydown is wiped out by about $4k of value loss. Plan a longer hold.
- Cuyahoga County population projected to shrink 8% by 2050 — rents likely to lag national; underwrite the cash flow, not the appreciation.
Negotiation context
- It's been on market 113 days — a 9% lower offer ($132k) is reasonable based on typical stale-listing flexibility.
- 7 sale attempts since 36y ago; this cycle's ask has dropped $24k (14%) from the opening price — seller is motivated, your offer sets the floor, not the list.
Risks & watch-outs
- Watch-outs: property tax is 3.8% of price; built in 1926 — expect roof / HVAC / electrical / plumbing capex.
Questions for the listing agent
- What do current leases actually rent for vs. the listed asking? Can we see a recent rent roll and the last 12 months of T-12 income?
- It's been on market 113 days. Have you received any prior offers? Is the seller open to a 9% concession, seller financing, or rate buy-down credit?
- Built in 1926 — when were the roof, HVAC, electrical panel, plumbing, and water heater last replaced?
- Property tax is high relative to price — has the assessment been appealed recently, and will the sale trigger a re-assessment?
- Why hasn't it sold? Are there any deal-killer items the seller is aware of (foundation, flood, title, zoning, code violations)?
- Is there a deadline driving the sale (1031 exchange, divorce, estate, relocation)? That informs how much negotiation room exists.
- Schools are A-rated — typically a magnet for longer-tenancy family renters. What's the average tenant stay here, and is there a school-zone premium baked into asking?
- What's the average days-on-market for RENTAL listings here right now (not sales)? A rising rental-DOM trend means longer vacancies and softer asking-rent achievability than the comps imply.
- What's the recent tenant-quality profile in this submarket — average credit score on applications, eviction rate, late-payment / NSF rate, and stable-employment percentage? A property-management company in the area should have these aggregated.
- How much new for-sale + rental construction is in the pipeline within 1–3 miles? Heavy new supply typically softens prices + rents 12–24 months out; constrained supply supports both.
Investment metrics
- 1% rule
- 1.10% ✓
- Cap rate
- 6.11%
- Cash-on-cash
- -0.64%
- DSCR
- 0.97
- GRM
- 7.6
CMA / ARV
- ARV (on-the-fly)
- $192,780
- Comps found
- 12
Show comp detail 12 sales within ~0.75 mi
| Address | Dist | Beds/Ba | Sqft | Sold | Price | $/sf | Match |
|---|---|---|---|---|---|---|---|
| 3163 Sycamore Rd | 0.27mi | 3/1.0 | 1,472 (+3%) | 3mo | $110,000 | $75 | 79 |
| 3412 Euclid Heights Blvd | 0.31mi | 3/1.5 | 1,460 (+2%) | 2mo | $230,000 | $158 | 78 |
| 3322 Altamont Ave | 0.12mi | 3/2.0 | 1,322 (-7%) | 2mo | $183,000 | $138 | 76 |
| 2534 Newbury Dr | 0.49mi | 3/1.5 | 1,448 (+1%) | 2mo | $270,000 | $186 | 71 |
| 3383 Beechwood Ave | 0.25mi | 4/1.5 (+1) | 1,520 (+6%) | 3mo | $182,000 | $120 | 68 |
| 3130 E Overlook Rd | 0.47mi | 4/2.0 (+1) | 1,448 (+1%) | 1mo | $165,000 | $114 | 66 |
| 1514 Rydalmount Rd | 0.55mi | 4/1.0 (+1) | 1,474 (+3%) | 2mo | $200,000 | $136 | 62 |
| 3623 Bainbridge Rd | 0.71mi | 3/1.5 | 1,410 (-1%) | 3mo | $235,000 | $167 | 60 |
| 1898 Powell Ave | 0.54mi | 4/2.0 (+1) | 1,382 (-3%) | 3mo | $187,000 | $135 | 58 |
| 2017 Goodnor Rd | 0.50mi | 3/1.5 | 1,605 (+12%) | 1mo | $140,000 | $87 | 53 |
| 3484 Bainbridge Rd | 0.47mi | 3/1.5 | 1,631 (+14%) | 1mo | $155,600 | $95 | 52 |
| 3357 Washington Blvd | 0.59mi | 4/2.0 (+1) | 1,591 (+11%) | 3mo | $170,000 | $107 | 42 |
Match score weights: distance 35% · size 25% · config 20% · recency 20%. Top-matched comps best support the ARV.
Projected returns pro-forma
-3.0% appreciation · 5.7% rent growth · sell at horizon
- IRR
- -13.4%
- Equity multiple
- 0.50×
- Total profit
- $-20,229
- Equity at exit
- $21,605
- IRR
- 0.2%
- Equity multiple
- 1.02×
- Total profit
- $636
- Equity at exit
- $12,528
Cash invested: $40,572 (down + closing). Projections, not guarantees.
Landlord ↔ Tenant lean methodology
- Overall (STATE)
- 73 Landlord-Friendly
- State Ohio
- 73 Landlord-Friendly · R+6
- County
- — inherits STATE
- City
- — inherits STATE
ZIP-level market 44118
- Rents YoY
- 5.7%
- Active inventory
- 257
- Price-to-rent
- 7.6×
Monthly cashflow live
- Estimated rent
- $1,590 high interval (Pro) →
- Mortgage (P&I)
- −$760
- Tax from tax record
- −$457 /mo · $5,489/yr
- Insurance
- −$60
- HOA
- −$0
- Vacancy / Maint / Mgmt
- −$334
- Net cashflow
- $-22
Break-even live
Sensitivity live
| Price | -10% $60 | -5% $19 | +0% $-22 | +5% $-63 | +10% $-104 |
|---|---|---|---|---|---|
| Rent | -10% $-147 | -5% $-84 | +0% $-22 | +5% $41 | +10% $104 |
| Rate | -1.0pp $51 | -0.5pp $15 | base $-22 | +0.5pp $-59 | +1.0pp $-97 |
UW: 25.0% down · 7.5% · 30yr · 1.5% tax · 5.0% vac · 8.0% maint · 8.0% mgmt
Financing live
Cash to close
- Down payment
- $36,225
- Closing costs
- $4,347
- Reserves months
- —
- Total cash needed
- —
Loan-product check · same deal, 3 products live
Conventional
25% down · 7.5% · 30yr
- Down + closing
- —
- Monthly P&I
- —
- Monthly cashflow
- —
- DSCR
- —
- Eligible?
- —
Personal DTI + credit; lowest rate.
DSCR
20% down · 8.5% · 30yr
- Down + closing
- —
- Monthly P&I
- —
- Monthly cashflow
- —
- DSCR
- —
- Eligible?
- —
No personal income docs; deal must DSCR.
Hard money
10% down · 12.0% · 12mo
- Down + closing
- —
- Monthly P&I
- —
- Monthly cashflow
- —
- DSCR
- —
- Eligible?
- —
Short-term bridge; refi at stabilization.
Rent comps 40 comps
| Address | Beds | Baths | Sqft | Rent | $/sqft | DOM | Units | Dist |
|---|---|---|---|---|---|---|---|---|
| 3230 Euclid Heights Blvd Unit NA Cleveland Heights, OH | 4.0 | 1.0 | 1705 | $2,270 | $1.33 | 25d | 1 | 0.07mi |
| 3290 Desota Ave Cleveland, OH | 4.0 | 1.0 | 1094 | $1,325 | $1.21 | 25d | 1 | 0.12mi |
| 3342 Desota Ave Unit 2 Cleveland Heights, OH | 3.0 | 1.0 | 1316 | $1,299 | $0.99 | 9d | 1 | 0.18mi |
| 3407 Altamont Rd Unit 2nd Floor Cleveland, OH | 3.0 | 1.0 | 1212 | $1,095 | $0.90 | 25d | 1 | 0.27mi |
| 3411 Beechwood Ave Unit 2nd floor Cleveland Heights, OH | 3.0 | 1.0 | 1452 | $1,687 | $1.16 | 6d | 1 | 0.28mi |
| 3428 Superior Park Dr Cleveland Heights, OH | 3.0 | 2.0 | 1704 | $1,325 | $0.78 | 23d | 1 | 0.48mi |
| 30 Severance Cir Cleveland Heights, OH | 1.0–2.0 | 1.0–2.0 | 762 | $1,700 | $2.23 | 4d | 18 | 0.51mi |
| 35 Severance Cir Cleveland Heights, OH | 1.0–2.0 | 1.0–2.0 | 832 | $1,570 | $1.89 | 3d | 26 | 0.63mi |
| 14172 Superior Rd Unit 2 Cleveland Heights, OH | 2.0 | 1.0 | 1446 | $1,195 | $0.83 | 25d | 1 | 0.65mi |
| 14172 Superior Rd Unit 1 Cleveland Heights, OH | 3.0 | 1.0 | 1446 | $1,295 | $0.90 | 25d | 1 | 0.65mi |
| 1720 Middlehurst Rd Cleveland, OH | 1.0–2.0 | 1.0 | 775 | $1,200 | $1.55 | 25d | 1 | 0.66mi |
| 1605 Hillcrest Rd Cleveland, OH | 2.0 | 1.0 | 1180 | $1,245 | $1.06 | 18d | 1 | 0.70mi |
| 2878 Mayfield Rd Cleveland Heights, OH | 1.0–2.0 | 1.0 | 1060 | $1,275 | $1.20 | 25d | 1 | 0.72mi |
| 1633 Eddington Rd Unit 1 Cleveland Heights, OH | 3.0 | 1.0 | 1538 | $1,100 | $0.72 | 25d | 1 | 0.73mi |
| 3241 Kildare Rd Unit 3241 Kildare Lower Cleveland Heights, OH | 2.0 | 1.0 | 900 | $1,095 | $1.22 | 9d | 1 | 0.75mi |
| 3065 E Derbyshire Rd Cleveland Heights, OH | 4.0 | 1.0 | 1450 | $1,495 | $1.03 | 23d | 1 | 0.76mi |
| 2100 Cottage Grove Dr Cleveland Heights, OH | 4.0 | 1.5 | 1450 | $1,495 | $1.03 | 9d | 1 | 0.76mi |
| 14120 Superior Rd Cleveland, OH | 3.0 | 1.0 | 1390 | $1,400 | $1.01 | 45d | 1 | 0.78mi |
| 1635 Belmar Rd Unit 1 Cleveland Heights, OH | 2.0 | 1.0 | 900 | $1,200 | $1.33 | 25d | 1 | 0.79mi |
| 3062 E Derbyshire Rd Cleveland, OH | 3.0 | 1.0 | 1650 | $3,000 | $1.82 | 25d | 1 | 0.79mi |
| 2845 Mayfield Rd Unit 2849-3 Cleveland Heights, OH | 2.0 | 1.0 | 1000 | $1,100 | $1.10 | 25d | 1 | 0.80mi |
| 1695 Glenmont Rd Unit 1695 Glenmont Lower Cleveland Heights, OH | 3.0 | 1.0 | 1336 | $1,435 | $1.07 | 9d | 1 | 0.83mi |
| 1695 Glenmont Rd Unit Lower Cleveland Heights, OH | 3.0 | 1.0 | 1336 | $1,435 | $1.07 | 25d | 1 | 0.83mi |
| 2171 Rexwood Rd Cleveland Heights, OH | 3.0 | 1.0 | 1023 | $1,325 | $1.30 | 25d | 1 | 0.84mi |
| 3699 Bainbridge Rd Cleveland, OH | 3.0 | 1.5 | 1866 | $1,900 | $1.02 | 18d | 1 | 0.84mi |
| 2827 Avondale Ave Apt 2 Cleveland Heights, OH | 3.0 | 1.0 | 1680 | $1,275 | $0.76 | 25d | 1 | 0.86mi |
| 1771 Coventry Rd Cleveland Heights, OH | 2.0 | 1.0 | 925 | $1,250 | $1.35 | 23d | 1 | 0.87mi |
| 3412 Kildare Rd Cleveland Heights, OH | 3.0 | 1.0 | 1296 | $1,731 | $1.34 | 4d | 1 | 0.87mi |
| 2201 Oakdale Rd Unit 1 Cleveland Heights, OH | 2.0 | 1.0 | 1183 | $1,250 | $1.06 | 25d | 1 | 0.88mi |
| 3722 Bainbridge Rd Cleveland, OH | 3.0 | 1.5 | 1326 | $4,500 | $3.39 | 25d | 1 | 0.90mi |
| 2223 Lee Rd Cleveland, OH | 2.0 | 1.0–2.0 | 1015 | $2,850 | $2.81 | 3d | 60 | 0.90mi |
| 1545 Glenmont Rd Unit 1 East Cleveland, OH | 2.0 | 1.0 | 1428 | $800 | $0.56 | 25d | 1 | 0.90mi |
| 1641 Coventry Rd Cleveland, OH | 3.0 | 1.0 | 1848 | $1,200 | $0.65 | 18d | 1 | 0.92mi |
| 2772 Lancashire Rd Unit 1 Cleveland Heights, OH | 3.0 | 1.0 | 1295 | $1,400 | $1.08 | 25d | 1 | 0.94mi |
| 2772 Lancashire Rd Cleveland, OH | 3.0 | 1.0 | 1295 | $1,400 | $1.08 | 9d | 2 | 0.94mi |
| 2764 Lancashire Rd Cleveland, OH | 2.0 | 2.0 | 1750 | $1,545 | $0.88 | 25d | 1 | 0.96mi |
| 2401 N Taylor Rd Cleveland, OH | 3.0 | 1.0 | 1347 | $1,325 | $0.98 | 9d | 1 | 0.99mi |
| 1584 Maple Rd Cleveland, OH | 3.0 | 2.0 | 1359 | $1,700 | $1.25 | 25d | 1 | 1.00mi |
| 13641 Cedar Rd University Heights, OH | 2.0 | 1.0 | 1036 | $1,350 | $1.30 | 25d | 1 | 1.02mi |
| 13645 Cedar Rd University Heights, OH | 2.0 | 1.0 | 1102 | $1,395 | $1.27 | 6d | 1 | 1.02mi |
Listing history 22 events
-
2026-04-23status Pending
-
2026-03-27price $144,900
-
2026-02-02price $164,900
-
2025-12-31$169,000 Active
-
2024-12-23soldstatus $130,000
-
2024-04-22soldstatus $112,000
-
2024-03-29historical
-
2024-03-07historical Contingent
-
2024-01-31status Active
-
2024-01-29price $128,900
-
2024-01-29historical
-
2024-01-22status Active
-
2024-01-17historical Contingent
-
2023-11-17price $132,000
-
2023-10-29$135,000 Active
-
1991-08-14soldstatus $55,000 178-char remark
Show marketing remark (178 chars)
Clean, Move-in!cleve Hts Compliances!newer Energy Effic Windows+bath * 10 Yr Roof * Low Maintenance * Gas Budget $47 Fenced Yard * Roxboro Middle School * Front Porch * Hrwd Flrs
-
1991-08-14soldstatus $55,000
Show marketing remark (178 chars)
Clean, Move-in!cleve Hts Compliances!newer Energy Effic Windows+bath * 10 Yr Roof * Low Maintenance * Gas Budget $47 Fenced Yard * Roxboro Middle School * Front Porch * Hrwd Flrs
-
1991-07-12$59,900 178-char remark
Show marketing remark (178 chars)
Clean, Move-in!cleve Hts Compliances!newer Energy Effic Windows+bath * 10 Yr Roof * Low Maintenance * Gas Budget $47 Fenced Yard * Roxboro Middle School * Front Porch * Hrwd Flrs
-
1991-06-30historical
-
1991-03-21$61,900
-
1991-03-17historical
-
1990-09-13$61,900
ⓘ Source: listings_history table (triggers on properties + properties_extension) + one-shot
backfill from property_details.listing_events for pre-trigger history.
Tax reassessment forecast OH · Partial reset (capped growth)
- Current annual tax
- $5,489 · $457/mo
- Projected year-2 tax
- $5,489 · $457/mo
- Expected delta
- $0/yr ($0/mo · 0.0%)
ⓘ Screening estimate from a state-policy table — verify with the county assessor before closing.
Climate risk First Street
- Flood 1/10 Low FEMA zone X (unshaded) · 0% chance over 30 yrs
- Wildfire 1/10 Low
- Heat 2/10 Low 7 d/yr ≥95°F today · 16 d/yr by 30 yrs out
- Wind 1/10 Low
- Air quality 3/10 Moderate 3 unhealthy d/yr today · 5 by 30 yrs out
Nearby sold comps map
Loading sold comps map…
Walkable amenities ~0.75 mi
Loading nearby amenities…
Taxation est. · year 1
- Rental income
- $19,079
- − Mortgage interest
- −$8,117
- − Property taxes
- −$5,489
- − Insurance
- −$724
- − Repairs & maintenance
- −$1,526
- − Management
- −$1,526
- − Depreciation
- −$4,215
- Taxable loss
- −$2,519
- Est. tax savings @ 24.0%
- +$605
- After-tax cash flow
- $345/yr
For passive investors: Depreciation is non-cash, so a rental often shows a tax loss while cash-flowing — sheltering income. Rental losses are passive: they offset passive income freely, and up to $25,000/yr can offset ordinary (W-2) income if you actively participate and your MAGI is under $100k (phasing out to $0 by $150k); unused losses carry forward. On sale, claimed depreciation is recaptured at up to 25%, and gains may owe capital-gains tax (a 1031 exchange can defer both). Figures are a year-1 estimate at your 24.0% rate — not tax advice; consult a CPA.
Schools (NCES district)
- District
- Cleveland Heights-University Heights City
- NCES district ID
- 3904379
- Math proficiency
- 23% ▼ -22.00%
- Reading proficiency
- 41% ▼ -12.00%
- Median HH income
- $53,451
- Composite
- 28.12/100
- National rank
- #6822
- State rank
- #568 of 656 in OH
Livability — Cleveland Heights
- Score
- 89/100
- State rank
- #12
- US rank
- #124
Category grades
Schools grade is shown separately in the Schools card above.
Census & demographics
- Census place
- Cleveland Heights, OH
- County
- Cuyahoga County · 1,090,369 people
- City population
- 32,312
- Metro
- Cleveland-Elyria, OH
- Population (ZIP)
- 40,715
- Household income
- $77,555
- Rent vs Own
- Severe rent burden
- 1847.0
Population outlook (Cuyahoga County) Hauer SSP2
- Today (2025)
- 1,244,621 people
- By 2030
- 1,230,093 · -1.2%
- By 2040
- 1,189,108 · -4.5%
- By 2050
- 1,145,706 · -7.9%
- By 2075
- 1,076,557 · -13.5%
- By 2100
- 978,987 · -21.3%
Race, ethnicity, and origin ACS 2023
- Neighborhood character
- Diverse neighborhood (Simpson 0.56)
- Race & ethnicity
- White 57% Black 33% Two or more races 4% Asian 3% Hispanic / Latino 2%
- Common ancestry
- Romanian 4% Scotch-Irish 2% Italian 2%
- Foreign-born
- 6% · Canada, China
- Languages at home
- 92% English-only · Spanish 2% Russian/Polish/Slavic 1% Other Indo-European 1%
Political lean MEDSL · Cuyahoga
- 2024 margin
- Solid D (+31.5) · D 65.4% · R 33.9%
- 2008→2024 swing
- -7.4pp toward R · 2008: 38.9pp · 2024: 31.5pp
- All cycles
- 2024: D+31.5 2020: D+34.1 2016: D+35.0 2012: D+38.7 2008: D+38.9
Not yet ingested
- Civics
- —
Market trends
- HPI YoY
- ▼ -319.62%
- Current HPI
- 204.5504
- Rent YoY
- ▲ 5.70%
- Metro
- Cleveland-Elyria, OH
- State GDP YoY
- ▲ 1.98%
- F500 in state
- 48
Industry mix (Fortune 500 HQ in OH)
| Industry | F500 HQs | Revenue |
|---|---|---|
| Insurance | 3 | $145B |
|
||
| Industrial Machinery | 3 | $49B |
|
||
| Financial Services | 3 | $24B |
|
||
| Consumer Goods | 2 | $93B |
|
||
| Aerospace / Defense | 2 | $47B |
|
||
| Utilities | 2 | $33B |
|
||
Price history
+134.1% since first listed22 events — show timeline
- 2026-04-23 Pending — MLSNOW
- 2026-03-27 Price Changed $144,900 MLSNOW
- 2026-02-02 Price Changed $164,900 MLSNOW
- 2025-12-31 Listed $169,000 MLSNOW
- 2024-12-23 Sold (Public Records) $130,000 Public Records
- 2024-04-22 Sold (Public Records) $112,000 Public Records
- 2024-03-29 Listing Removed — MLSNOW
- 2024-03-07 Contingent — MLSNOW
- 2024-01-31 Relisted — MLSNOW
- 2024-01-29 Price Changed $128,900 MLSNOW
- 2024-01-29 Listing Removed — MLSNOW
- 2024-01-22 Relisted — MLSNOW
- 2024-01-17 Contingent — MLSNOW
- 2023-11-17 Price Changed $132,000 MLSNOW
- 2023-10-29 Listed $135,000 MLSNOW
- 1991-08-14 Sold (Public Records) $55,000 Public Records
- 1991-08-14 Sold (MLS) $55,000 MLSNOW
- 1991-07-12 Listed $59,900 MLSNOW
- 1991-06-30 Listing Removed — MLSNOW
- 1991-03-21 Listed $61,900 MLSNOW
- 1991-03-17 Listing Removed — MLSNOW
- 1990-09-13 Listed $61,900 MLSNOW
Property tax history
+4.6%/yrLatest (2025): $5,489 · +0.0% YoY. Source: county tax records.
Cash-flow waterfall
monthlySold comps — $/sqft
last 12 mo · ≤1 miLoading sold comps…