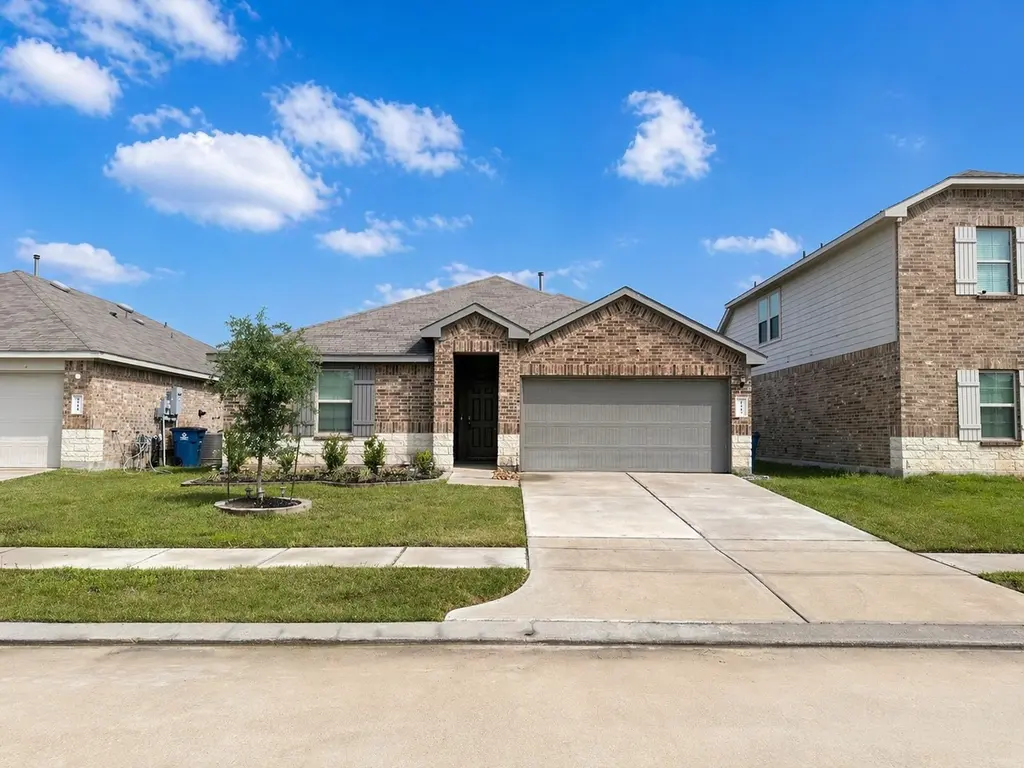
2315 Chaparrel Cliff Trl · Spring, TX
Flood risk 3/10 · Minor
- FEMA flood zone
- X (unshaded)
- Chance of flooding over 30 yrs
- 0.2%
- Est. flood insurance / yr
- $507 – $1,088
Fire risk 3/10 · Minor
- Est. fire insurance / yr
- $1,222 – $2,270
Heat risk 8/10 · Major
- Hot days now (above 110°F)
- 7 days/yr
- Hot days in 30 yrs
- 23 days/yr
Wind risk 8/10 · Major
- Chance of severe wind over 30 yrs
- 99.0%
Air-quality risk 3/10 · Minor
- Unhealthy air days now
- 3 days/yr
- Unhealthy air days in 30 yrs
- 3 days/yr
Risk factors via First Street. Map © Google.
Why this score? — see what drove the D grade
The composite is a weighted blend of 9 inputs, each scored 0–100. Each bar is that input's sub-score; the figure is the points it added to the 100-point composite (weight × sub-score).
- Cash flow +12.1/30.0
- ARV discount +10.9/15.0
- 1% rule +5.2/10.0
- Condition / age +3.8/5.0
- DSCR +3.6/10.0
- Livability +3.3/5.0
- Rent growth +2.4/5.0
- Schools +2.0/10.0
- Appreciation +0.0/10.0
$229,950
🖨 Deal sheet (PDF) 📄 Offer letter ✓ Due diligence
Listing remarks
Welcome to this beautifully maintained, move in ready home featuring modern finishes and an open concept layout filled with natural light. The kitchen boasts a large island, granite countertops, stainless steel appliances, and rich cabinetry, flowing seamlessly into the living and dining areas, perfect for entertaining. The spacious primary suite offers a private retreat with a walk in closet and ensuite bath featuring dual vanities and a tub/shower combo. Additional highlights include well sized secondary rooms, a dedicated laundry area, and durable flooring throughout. Enjoy a fully fenced backyard with endless potential for outdoor living. Conveniently located near shopping, dining, and
Key facts
- Rich cabinetry
- Walk-in closet
- Large island
Tags
Property features AI
Finance
- Other: Association-managed pool
- HOA & community: Breckenridge Forest association; Community playground and pool; Annual association fee of $600
Exterior
- Parking: Attached garage with 2 spaces
- Security: Smoke detectors
- Utilities: Public water; Public sewer; Concrete road access
- Home design: Residential property; Faces southeast; Built in 2021; Slab foundation
- Construction: Brick construction; Composition roof
- Exterior features: Covered patio; Deck; Patio; Fully fenced backyard; Sprinkler/irrigation system; Subdivision and side yard
Interior
- Kitchen: Dishwasher; Electric oven; Gas cooktop; Microwave
- Bedrooms: Primary bedroom on the first floor (14x12); Two additional bedrooms on the first floor (11x11; 10x11)
- Flooring: Carpet; Laminate; Tile
- Bathrooms: Two full bathrooms
- Heating & cooling: Central heating (gas); Central electric air conditioning; Thermostat (energy efficient)
- Interior features: Double vanities; Granite counters; Kitchen island; Pantry; Tub with shower; Programmable thermostat
- Laundry & utility: Washer hookup; Gas dryer hookup
Neighborhood map
What this means for you Summary
Snapshot
- This is a 3-bed/2.0-bath single-family listed at $230k. Condition is rated good.
Deal economics
- At list price, monthly cash flow is $-50 ($-605/yr) — negative.
- To cash-flow at today's rent, offer at most $221k (3.9% below list).
- Meets the 1% rule at list price ($2k rent vs $230k).
- Recommended offer: $221k (3.9% below list) — sets the bar for cash-flow.
- Cap rate 6.0% vs local median 4.5% in Spring — top-decile yield for the area; either an underpriced asset or a hidden risk that comps aren't pricing in. Stress-test before assuming the spread holds.
Location & tenants
- Location reads 66/100 on livability (#635 in TX) — a middle-class / working-renter tenant base. Strengths: cost of living A+, housing A+, employment B; Watch: crime D, amenities F, commute F.
- Spring ISD (suburban): math 19% / reading 26% proficiency, ranked #730 of 826 in TX (top 88%) — low school quality limits family demand, transient renter base, plan for 1-2y turnover; 66% free/reduced lunch — lower-income household profile, screen leases tightly.
- Zoned schools: Gloria Marshall El (math 15% / reading 25%, grade F, #3,536 of 4,322 statewide, top 83%, 953 students, 81% FRL); Rickey C Bailey Middle (math 15% / reading 23%, grade F, #1,466 of 1,662 statewide, top 89%, 1,065 students, 85% FRL); Spring H S (math 12% / reading 21%, grade F, #1,497 of 1,632 statewide, top 92%, 2,760 students, 72% FRL).
- Market conditions: Rents soft (-0.3%/yr); 603 active listings in the ZIP; solid renter incomes; 29,883 units permitted in Harris County in 2024 (8,621 in 5+ unit buildings).
- This rent runs 32% of the median local income ($89k/yr) — at the standard rent-burdened threshold; future hikes will face affordability resistance.
Forward outlook
- Local home prices are declining (-3.0%/yr); year-one equity from $2k of loan paydown is wiped out by about $7k of value loss. Plan a longer hold.
- Harris County population projected at +47% by 2050 — long-run rental-demand tailwind backs the buy-and-hold thesis.
Negotiation context
- It's been on market 48 days — a 3% lower offer ($223k) is reasonable based on typical stale-listing flexibility.
- 2 sale attempts with the ask held roughly flat each time — persistent listings suggest the price (not the market) is what's stuck; bring a comps-based counter.
Risks & watch-outs
- Watch-outs: property tax is 2.9% of price.
- Climate carrying-cost: severe wind risk, 99% chance of damaging wind over 30y; extreme-heat days projected 7→23/yr by 2055 (HVAC capex compounding) — expect insurance premiums to compound above CPI over the hold.
Questions for the listing agent
- What do current leases actually rent for vs. the listed asking? Can we see a recent rent roll and the last 12 months of T-12 income?
- It's been on market 48 days. Have you received any prior offers? Is the seller open to a 4% concession, seller financing, or rate buy-down credit?
- Property tax is high relative to price — has the assessment been appealed recently, and will the sale trigger a re-assessment?
- What does the HOA fee cover, when was the last increase, and are there any pending special assessments or reserve-fund shortfalls?
- Is there a deadline driving the sale (1031 exchange, divorce, estate, relocation)? That informs how much negotiation room exists.
- Crime grade is D in this area — have there been break-ins, vandalism, or insurance claims at this property in the last 3 years? What carrier currently insures it and at what premium?
- The area grade is low — what's the realistic commute time and amenity access for the typical tenant pool here? Any planned neighborhood developments (good or bad) we should know about?
- What's the average days-on-market for RENTAL listings here right now (not sales)? A rising rental-DOM trend means longer vacancies and softer asking-rent achievability than the comps imply.
- What's the recent tenant-quality profile in this submarket — average credit score on applications, eviction rate, late-payment / NSF rate, and stable-employment percentage? A property-management company in the area should have these aggregated.
- How much new for-sale + rental construction is in the pipeline within 1–3 miles? Heavy new supply typically softens prices + rents 12–24 months out; constrained supply supports both.
Investment metrics
- 1% rule
- 1.02% ✓
- Cap rate
- 6.03%
- Cash-on-cash
- -0.94%
- DSCR
- 0.96
- GRM
- 8.2
CMA / ARV
- ARV (median comp)
- $248,557
- List price
- $229,950
- Delta
- -7.49%
- Verdict
- FAIR
- Comps
- 20 within 1.0 mi
Show comp detail 7 sales within ~0.75 mi
| Address | Dist | Beds/Ba | Sqft | Sold | Price | $/sf | Match |
|---|---|---|---|---|---|---|---|
| 23614 Summer Pine Dr | 0.28mi | 3/2.0 | 1,467 (+2%) | 12mo | $240,000 | $164 | 73 |
| 22911 Pebworth Pl | 0.42mi | 3/2.0 | 1,474 (+3%) | 14mo | $165,000 | $112 | 64 |
| 22843 Spruce Summit Trl | 0.40mi | 3/2.0 | 1,380 (-4%) | 21mo | $236,000 | $171 | 57 |
| 2306 Juniper Hedge Cir | 0.26mi | 3/2.0 | 1,634 (+14%) | 15mo | $266,990 | $163 | 52 |
| 23130 Royal Tiger Rd | 0.54mi | 3/2.0 | 1,533 (+7%) | 21mo | $249,000 | $162 | 46 |
| 4227 Mossygate Dr | 0.61mi | 4/2.0 (+1) | 1,609 (+12%) | 10mo | $150,000 | $93 | 38 |
| 2514 Spring Day Ct | 0.71mi | 3/2.0 | 1,648 (+15%) | 10mo | $215,000 | $130 | 34 |
Match score weights: distance 35% · size 25% · config 20% · recency 20%. Top-matched comps best support the ARV.
Projected returns pro-forma
-3.0% appreciation · 0.0% rent growth · sell at horizon
- IRR
- -21.9%
- Equity multiple
- 0.27×
- Total profit
- $-47,111
- Equity at exit
- $34,286
- IRR
- -28.2%
- Equity multiple
- -0.10×
- Total profit
- $-70,771
- Equity at exit
- $19,882
Cash invested: $64,386 (down + closing). Projections, not guarantees.
Landlord ↔ Tenant lean methodology
- Overall (STATE)
- 87 Strongly Landlord-Friendly
- State Texas
- 87 Strongly Landlord-Friendly · R+5
- County
- — inherits STATE
- City
- — inherits STATE
ZIP-level market 77373
- Rents YoY
- -0.3%
- Active inventory
- 603
- Price-to-rent
- 8.2×
Monthly cashflow live
- Estimated rent
- $2,343 medium interval (Pro) →
- Mortgage (P&I)
- −$1,206
- Tax from tax record
- −$550 /mo · $6,599/yr
- Insurance
- −$96
- HOA
- −$50
- Vacancy / Maint / Mgmt
- −$492
- Net cashflow
- $-50
Break-even live
Sensitivity live
| Price | -10% $80 | -5% $15 | +0% $-50 | +5% $-115 | +10% $-181 |
|---|---|---|---|---|---|
| Rent | -10% $-236 | -5% $-143 | +0% $-50 | +5% $42 | +10% $135 |
| Rate | -1.0pp $65 | -0.5pp $8 | base $-50 | +0.5pp $-110 | +1.0pp $-171 |
UW: 25.0% down · 7.5% · 30yr · 1.5% tax · 5.0% vac · 8.0% maint · 8.0% mgmt
Financing live
Cash to close
- Down payment
- $57,488
- Closing costs
- $6,898
- Reserves months
- —
- Total cash needed
- —
Loan-product check · same deal, 3 products live
Conventional
25% down · 7.5% · 30yr
- Down + closing
- —
- Monthly P&I
- —
- Monthly cashflow
- —
- DSCR
- —
- Eligible?
- —
Personal DTI + credit; lowest rate.
DSCR
20% down · 8.5% · 30yr
- Down + closing
- —
- Monthly P&I
- —
- Monthly cashflow
- —
- DSCR
- —
- Eligible?
- —
No personal income docs; deal must DSCR.
Hard money
10% down · 12.0% · 12mo
- Down + closing
- —
- Monthly P&I
- —
- Monthly cashflow
- —
- DSCR
- —
- Eligible?
- —
Short-term bridge; refi at stabilization.
HOA detail
- Monthly dues
- $50 · $600/yr
Listing history 12 events
-
2026-06-13statusdays on market $229,950 Pending 48 DOM
-
2026-06-09days on market $229,950 Active 46 DOM
-
2026-06-08days on market $229,950 Active 45 DOM
-
2026-06-07days on market $229,950 Active 44 DOM
-
2026-06-04days on market $229,950 Active 41 DOM
-
2026-06-03days on market $229,950 Active 40 DOM
-
2026-06-02days on market $229,950 Active 39 DOM
-
2026-06-01days on market $229,950 Active 38 DOM
-
2026-05-31days on market $229,950 Active 37 DOM
-
2026-04-24$239,950 Active 763-char remark
-
2025-03-14historical
-
2025-03-13$244,900 Active
ⓘ Source: listings_history table (triggers on properties + properties_extension) + one-shot
backfill from property_details.listing_events for pre-trigger history.
Tax reassessment forecast TX · Resets to sale price
- Current annual tax
- $6,599 · $550/mo
- Projected year-2 tax
- $6,599 · $550/mo
- Expected delta
- $0/yr ($0/mo · 0.0%)
ⓘ Screening estimate from a state-policy table — verify with the county assessor before closing.
Climate risk First Street
- Flood 3/10 Moderate FEMA zone X (unshaded) · 20% chance over 30 yrs
- Wildfire 3/10 Moderate
- Heat 8/10 Severe 7 d/yr ≥110°F today · 23 d/yr by 30 yrs out
- Wind 8/10 Severe 99% chance of damaging wind over 30 yrs
- Air quality 3/10 Moderate 3 unhealthy d/yr today · 3 by 30 yrs out
Nearby sold comps map
Loading sold comps map…
Walkable amenities ~0.75 mi
Loading nearby amenities…
Taxation est. · year 1
- Rental income
- $28,120
- − Mortgage interest
- −$12,881
- − Property taxes
- −$6,599
- − Insurance
- −$1,150
- − Repairs & maintenance
- −$2,250
- − Management
- −$2,250
- − HOA
- −$600
- − Depreciation
- −$6,689
- Taxable loss
- −$4,298
- Est. tax savings @ 24.0%
- +$1,032
- After-tax cash flow
- $427/yr
For passive investors: Depreciation is non-cash, so a rental often shows a tax loss while cash-flowing — sheltering income. Rental losses are passive: they offset passive income freely, and up to $25,000/yr can offset ordinary (W-2) income if you actively participate and your MAGI is under $100k (phasing out to $0 by $150k); unused losses carry forward. On sale, claimed depreciation is recaptured at up to 25%, and gains may owe capital-gains tax (a 1031 exchange can defer both). Figures are a year-1 estimate at your 24.0% rate — not tax advice; consult a CPA.
Condition & rehab AI · 1 photo
This move-in ready home features modern finishes and an open concept layout, with good condition and minimal repairs needed.
Value-add opportunities
- Both Landscaping and curb appeal improvements — Enhances curb appeal and could attract more buyers
- Both Painting exterior and interior walls — Fresh paint can make the home look newer and more appealing
Renovation cost estimate screening
Value-add ROI direction
- Both Landscaping and curb appeal improvements — Enhances curb appeal and could attract more buyers ↑
- Both Painting exterior and interior walls — Fresh paint can make the home look newer and more appealing ↑
ⓘ Cost ranges are severity-bucket heuristics (US national rule-of-thumb). Get contractor quotes + a written scope before underwriting a rehab budget.
Schools (NCES district)
- District
- Spring ISD
- NCES district ID
- 4841220
- Math proficiency
- 19% ▼ -13.00%
- Reading proficiency
- 26% ▼ -6.00%
- Median HH income
- $51,584
- Composite
- 20.12/100
- National rank
- #8643
- State rank
- #730 of 826 in TX
Livability — Spring
- Score
- 66/100
- State rank
- #635
- US rank
- #12101
Category grades
Schools grade is shown separately in the Schools card above.
Census & demographics
- Census place
- Spring, TX
- County
- Harris County · 4,702,590 people
- City population
- 430,529
- Metro
- Houston-The Woodlands-Sugar Land, TX
- Population (ZIP)
- 69,739
- Household income
- $88,617
- Rent vs Own
- Severe rent burden
- 1050.0
Population outlook (Harris County) Hauer SSP2
- Today (2025)
- 5,571,493 people
- By 2030
- 6,089,821 · +9.3%
- By 2040
- 7,142,806 · +28.2%
- By 2050
- 8,185,864 · +46.9%
- By 2075
- 10,574,329 · +89.8%
- By 2100
- 12,109,958 · +117.4%
Race, ethnicity, and origin ACS 2023
- Neighborhood character
- Diverse neighborhood (Simpson 0.69)
- Race & ethnicity
- Hispanic / Latino 40% White 30% Black 23% Two or more races 22% Asian 3%
- Hispanic origin (detail)
- Mexican 27% Puerto Rican 2% Cuban 2% Dominican 2%
- Common ancestry
- Lithuanian 2% Italian 1% Slovak 1%
- Foreign-born
- 17% · Canada, Jamaica, Vietnam
- Languages at home
- 64% English-only · Spanish 32% Vietnamese 1% Other Indo-European 1%
Political lean MEDSL · Harris
- 2024 margin
- Lean D (+5.5) · D 52.0% · R 46.4% · Other 1.6%
- 2008→2024 swing
- +3.9pp toward D · 2008: 1.6pp · 2024: 5.5pp
- All cycles
- 2024: D+5.5 2020: D+13.3 2016: D+12.4 2012: D+0.1 2008: D+1.6
Not yet ingested
- Civics
- —
Market trends
- HPI YoY
- ▼ -142.98%
- Current HPI
- 251.7231
- Rent YoY
- ▼ -0.30%
- Metro
- Houston-The Woodlands-Sugar Land, TX
- State GDP YoY
- ▲ 3.95%
- F500 in state
- 110
Industry mix (Fortune 500 HQ in TX)
| Industry | F500 HQs | Revenue |
|---|---|---|
| Energy | 16 | $1,198B |
|
||
| Technology | 5 | $198B |
|
||
| Engineering / Construction | 4 | $72B |
|
||
| Energy Services | 3 | $60B |
|
||
| Utilities | 3 | $41B |
|
||
| Healthcare | 2 | $330B |
|
||
Price history
-6.1% since first listed5 events — show timeline
- 2026-06-11 Pending — HARMLS
- 2026-05-29 Price Changed $229,950 HARMLS
- 2026-04-24 Listed $239,950 HARMLS
- 2025-03-14 Listing Removed — HARMLS
- 2025-03-13 Listed $244,900 HARMLS
Property tax history
+84.2%/yrLatest (2025): $6,599 · -2.1% YoY. Source: county tax records.
Cash-flow waterfall
monthlySold comps — $/sqft
last 12 mo · ≤1 miLoading sold comps…