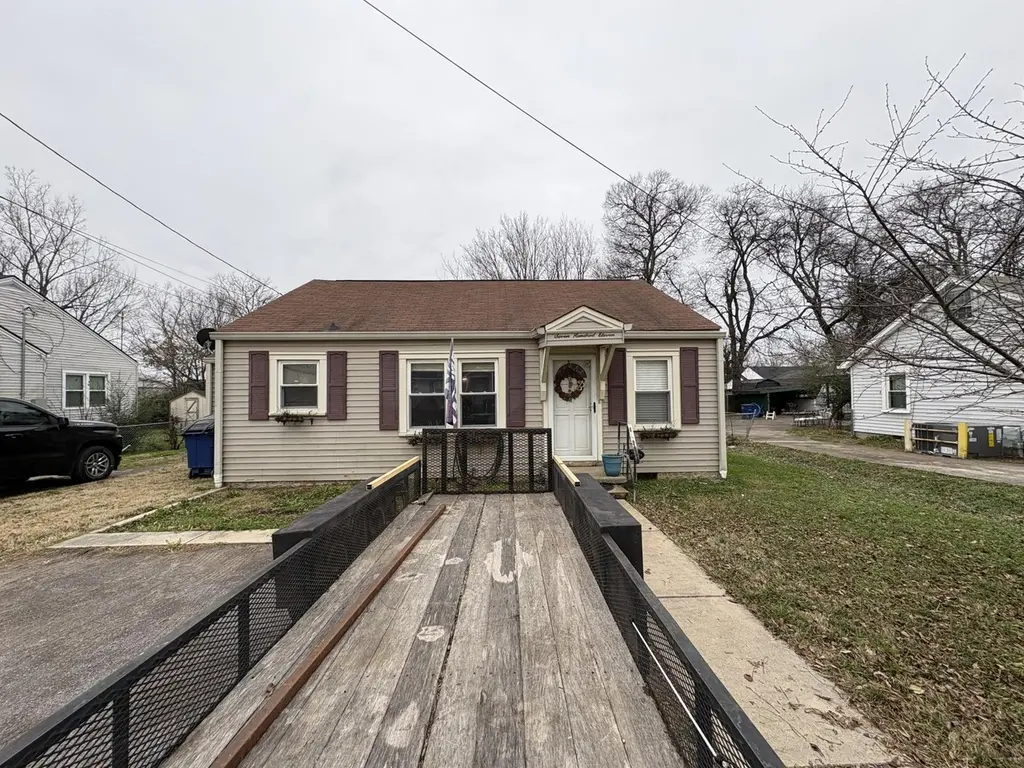
711 Hoover St · Shelbyville, TN
Flood risk 1/10 · Minimal
- FEMA flood zone
- X (unshaded)
- Chance of flooding over 30 yrs
- 0.0%
- Est. flood insurance / yr
- $507 – $1,088
Fire risk 3/10 · Minor
- Est. fire insurance / yr
- $949 – $1,763
Heat risk 6/10 · Moderate
- Hot days now (above 107°F)
- 7 days/yr
- Hot days in 30 yrs
- 21 days/yr
Wind risk 4/10 · Minor
- Chance of severe wind over 30 yrs
- 11.0%
Air-quality risk 2/10 · Minimal
- Unhealthy air days now
- 1 days/yr
- Unhealthy air days in 30 yrs
- 1 days/yr
Risk factors via First Street. Map © Google.
Why this score? — see what drove the D grade
The composite is a weighted blend of 9 inputs, each scored 0–100. Each bar is that input's sub-score; the figure is the points it added to the 100-point composite (weight × sub-score).
- ARV discount +14.8/15.0
- Cash flow +12.3/30.0
- DSCR +3.6/10.0
- Livability +3.2/5.0
- 1% rule +2.5/10.0
- Rent growth +2.5/5.0
- Condition / age +2.5/5.0
- Schools +2.0/10.0
- Appreciation +0.0/10.0
$188,900
🖨 Deal sheet (PDF) 📄 Offer letter ✓ Due diligence
Listing remarks MLS
Charming single-tribe home located in a serene neighborhood of Shelbyville. This well-maintained property provides spacious living areas, a modern kitchen, and ample natural light throughout. The backyard is appropriate for outdoor entertaining, with a patio and lush landscaping. Conveniently located near local amenities and schools, this home provides both comfort and accessibility. Don't miss the opportunity to explore this delightful residence.
Key facts
- Outdoor entertaining
- Modern kitchen
- Lush landscaping
Tags
Neighborhood map
What this means for you Summary
Snapshot
- This is a 2-bed/1.0-bath single-family listed at $189k.
Deal economics
- At list price, monthly cash flow is $-35 ($-417/yr) — negative.
- To cash-flow at today's rent, offer at most $183k (3.3% below list).
- To meet the 1% rule (rent ≥ 1% of price), the offer needs to be $141k (25.4% below list).
- Recommended offer: $141k (25.4% below list) — sets the bar for 1% rule.
- Cap rate 6.1% vs local median 3.6% in Shelbyville — top-decile yield for the area; either an underpriced asset or a hidden risk that comps aren't pricing in. Stress-test before assuming the spread holds.
Location & tenants
- Location reads 64/100 on livability (#183 in TN) — a middle-class / working-renter tenant base. Strengths: cost of living A+, housing A+; Watch: health & safety C-, crime D, employment D.
- Bedford County (rural): math 24% / reading 23% proficiency, ranked #97 of 139 in TN (top 70%) — low school quality limits family demand, transient renter base, plan for 1-2y turnover.
- Zoned schools: Learning Way Elementary (math 12% / reading 12%, grade F, #786 of 952 statewide, top 84%, 675 students, 0% FRL); Harris Middle School (math 16% / reading 13%, grade F, #231 of 333 statewide, top 70%, 963 students, 0% FRL); Shelbyville Central High School (math 2% / reading 28%, grade F, #236 of 332 statewide, top 71%, 1,553 students, 0% FRL) — zoned schools average 0% FRL vs 56% district-wide (56 pts lower); this property's tenant base skews higher-income than the district average.
- Market conditions: 354 active listings in the ZIP; 5 comparable units currently listed for rent nearby; rentals lingering (median 46d on market — plan ~5-8 weeks vacancy on turnover, expect pricing pressure); 80% of comp listings sitting > 30 days — soft ceiling on asking rent; 630 units permitted in Bedford County in 2024 (6 in 5+ unit buildings).
Forward outlook
- Local home prices are declining (-3.0%/yr); year-one equity from $1k of loan paydown is wiped out by about $6k of value loss. Plan a longer hold.
- Bedford County population projected at +16% by 2050 — long-run rental-demand tailwind backs the buy-and-hold thesis.
Negotiation context
- It's been on market 195 days — a 12% lower offer ($166k) is reasonable based on typical stale-listing flexibility.
- 4 sale attempts since 9y ago; this cycle's ask has dropped $26k (12%) from the opening price — seller is motivated, your offer sets the floor, not the list.
- Current owner paid $120k; list at $189k implies a 57% gain — meaningful room to come down on a strong offer.
Risks & watch-outs
- Watch-outs: built in 1950 — expect roof / HVAC / electrical / plumbing capex.
- Climate carrying-cost: extreme-heat days projected 7→21/yr by 2055 (HVAC capex compounding) — expect insurance premiums to compound above CPI over the hold.
Questions for the listing agent
- What do current leases actually rent for vs. the listed asking? Can we see a recent rent roll and the last 12 months of T-12 income?
- It's been on market 195 days. Have you received any prior offers? Is the seller open to a 25% concession, seller financing, or rate buy-down credit?
- Built in 1950 — when were the roof, HVAC, electrical panel, plumbing, and water heater last replaced?
- Why hasn't it sold? Are there any deal-killer items the seller is aware of (foundation, flood, title, zoning, code violations)?
- Is there a deadline driving the sale (1031 exchange, divorce, estate, relocation)? That informs how much negotiation room exists.
- Schools are F-rated, which usually means shorter tenancies and higher turnover. Who's the typical renter profile here, and what's been the actual vacancy rate?
- Crime grade is D in this area — have there been break-ins, vandalism, or insurance claims at this property in the last 3 years? What carrier currently insures it and at what premium?
- The area grade is low — what's the realistic commute time and amenity access for the typical tenant pool here? Any planned neighborhood developments (good or bad) we should know about?
- What's the average days-on-market for RENTAL listings here right now (not sales)? A rising rental-DOM trend means longer vacancies and softer asking-rent achievability than the comps imply.
- What's the recent tenant-quality profile in this submarket — average credit score on applications, eviction rate, late-payment / NSF rate, and stable-employment percentage? A property-management company in the area should have these aggregated.
- How much new for-sale + rental construction is in the pipeline within 1–3 miles? Heavy new supply typically softens prices + rents 12–24 months out; constrained supply supports both.
Investment metrics
- 1% rule
- 0.75% ✗
- Cap rate
- 6.07%
- Cash-on-cash
- -0.79%
- DSCR
- 0.96
- GRM
- 11.2
CMA / ARV
- ARV (median comp)
- $225,565
- List price
- $188,900
- Delta
- -16.25%
- Verdict
- UNDERPRICED
- Comps
- 20 within 1.0 mi
Show comp detail 12 sales within ~0.75 mi
| Address | Dist | Beds/Ba | Sqft | Sold | Price | $/sf | Match |
|---|---|---|---|---|---|---|---|
| 636 Deery St | 0.18mi | 2/1.0 | 1,124 (-4%) | 6mo | $115,000 | $102 | 80 |
| 713 King Ave | 0.05mi | 3/1.0 (+1) | 1,256 (+7%) | 3mo | $245,000 | $195 | 78 |
| 639 Deery St | 0.22mi | 3/1.0 (+1) | 1,163 (-1%) | 6mo | $245,000 | $211 | 78 |
| 110 E Cedar St | 0.46mi | 2/1.0 | 1,177 (+0%) | 4mo | $145,000 | $123 | 74 |
| 1017 Fairfield Pike | 0.58mi | 3/2.0 (+1) | 1,167 (-0%) | 6mo | $168,000 | $144 | 59 |
| 207 Martha St | 0.54mi | 3/2.0 (+1) | 1,200 (+2%) | 7mo | $230,000 | $192 | 56 |
| 104 Enden Ave | 0.50mi | 3/1.0 (+1) | 1,308 (+12%) | 1mo | $215,000 | $164 | 52 |
| 112 Elizabeth St | 0.62mi | 2/1.0 | 1,033 (-12%) | 7mo | $199,700 | $193 | 46 |
| 202 Maplewood Dr | 0.60mi | 2/1.0 | 1,008 (-14%) | 10mo | $225,000 | $223 | 40 |
| 113 S Thompson St | 0.65mi | 3/1.5 (+1) | 1,040 (-11%) | 10mo | $150,000 | $144 | 36 |
| 200 Cedar River Rd | 0.63mi | 3/2.0 (+1) | 1,340 (+14%) | 7mo | $245,000 | $183 | 32 |
| 204 Wade Dr | 0.68mi | 3/1.5 (+1) | 1,335 (+14%) | 10mo | $262,000 | $196 | 30 |
Match score weights: distance 35% · size 25% · config 20% · recency 20%. Top-matched comps best support the ARV.
Projected returns pro-forma
-3.0% appreciation · 3.0% rent growth · sell at horizon
- IRR
- -17.7%
- Equity multiple
- 0.38×
- Total profit
- $-32,900
- Equity at exit
- $28,166
- IRR
- -9.8%
- Equity multiple
- 0.40×
- Total profit
- $-31,808
- Equity at exit
- $16,333
Cash invested: $52,892 (down + closing). Projections, not guarantees.
Landlord ↔ Tenant lean methodology
- Overall (STATE)
- 87 Strongly Landlord-Friendly
- State Tennessee
- 87 Strongly Landlord-Friendly · R+13
- County
- — inherits STATE
- City
- — inherits STATE
ZIP-level market 37160
- Home prices YoY
- -23.1%
- Active inventory
- 354
- Price-to-rent
- 11.2×
Monthly cashflow live
- Estimated rent
- $1,409 high interval (Pro) →
- Mortgage (P&I)
- −$991
- Tax from tax record
- −$79 /mo · $944/yr
- Insurance
- −$79
- HOA
- −$0
- Vacancy / Maint / Mgmt
- −$296
- Net cashflow
- $-35
Break-even live
Sensitivity live
| Price | -10% $72 | -5% $19 | +0% $-35 | +5% $-88 | +10% $-142 |
|---|---|---|---|---|---|
| Rent | -10% $-146 | -5% $-90 | +0% $-35 | +5% $21 | +10% $77 |
| Rate | -1.0pp $60 | -0.5pp $13 | base $-35 | +0.5pp $-84 | +1.0pp $-134 |
UW: 25.0% down · 7.5% · 30yr · 1.5% tax · 5.0% vac · 8.0% maint · 8.0% mgmt
Financing live
Cash to close
- Down payment
- $47,225
- Closing costs
- $5,667
- Reserves months
- —
- Total cash needed
- —
Loan-product check · same deal, 3 products live
Conventional
25% down · 7.5% · 30yr
- Down + closing
- —
- Monthly P&I
- —
- Monthly cashflow
- —
- DSCR
- —
- Eligible?
- —
Personal DTI + credit; lowest rate.
DSCR
20% down · 8.5% · 30yr
- Down + closing
- —
- Monthly P&I
- —
- Monthly cashflow
- —
- DSCR
- —
- Eligible?
- —
No personal income docs; deal must DSCR.
Hard money
10% down · 12.0% · 12mo
- Down + closing
- —
- Monthly P&I
- —
- Monthly cashflow
- —
- DSCR
- —
- Eligible?
- —
Short-term bridge; refi at stabilization.
Rent comps 5 comps
| Address | Beds | Baths | Sqft | Rent | $/sqft | DOM | Units | Dist |
|---|---|---|---|---|---|---|---|---|
| 125 Sunlite Rd Shelbyville, TN | 2.0–3.0 | 2.0 | 1147 | $990 | $0.86 | 25d | 1 | 0.57mi |
| 105 Kingwood Ave Shelbyville, TN | 3.0 | 2.0 | 1250 | $1,650 | $1.32 | 45d | 1 | 0.95mi |
| 228 Coney Island Rd Shelbyville, TN | 3.0 | 2.0 | 1046 | $1,525 | $1.46 | 45d | 1 | 1.04mi |
| 107 Pickle St Unit C Shelbyville, TN | 2.0 | 1.0 | 1025 | $1,225 | $1.20 | 45d | 1 | 1.10mi |
| 111 W End Ave Shelbyville, TN | 3.0 | 2.0 | 1120 | $1,675 | $1.50 | 45d | 1 | 1.18mi |
Listing history 39 events
-
2026-06-21days on market $188,900 Active 195 DOM
-
2026-06-19days on market $188,900 Active 193 DOM
-
2026-06-18days on market $188,900 Active 192 DOM
-
2026-06-17days on market $188,900 Active 191 DOM
-
2026-06-16days on market $188,900 Active 190 DOM
-
2026-06-15days on market $188,900 Active 189 DOM
-
2026-06-14days on market $188,900 Active 187 DOM
-
2026-06-13days on market $188,900 Active 186 DOM
-
2026-06-10days on market $188,900 Active 184 DOM
-
2026-06-09days on market $188,900 Active 183 DOM
-
2026-06-08days on market $188,900 Active 182 DOM
-
2026-06-07days on market $188,900 Active 181 DOM
-
2026-06-03days on market $188,900 Active 177 DOM
-
2026-06-02days on market $188,900 Active 176 DOM
-
2026-06-01days on market $188,900 Active 175 DOM
-
2026-05-31days on market $188,900 Active 174 DOM
-
2026-05-30days on market $188,900 Active 173 DOM
-
2026-02-20price $188,900 451-char remark
Show marketing remark (451 chars)
Charming single-tribe home located in a serene neighborhood of Shelbyville. This well-maintained property provides spacious living areas, a modern kitchen, and ample natural light throughout. The backyard is appropriate for outdoor entertaining, with a patio and lush landscaping. Conveniently located near local amenities and schools, this home provides both comfort and accessibility. Don't miss the opportunity to explore this delightful residence.
-
2026-02-11price $189,000 451-char remark
Show marketing remark (451 chars)
Charming single-tribe home located in a serene neighborhood of Shelbyville. This well-maintained property provides spacious living areas, a modern kitchen, and ample natural light throughout. The backyard is appropriate for outdoor entertaining, with a patio and lush landscaping. Conveniently located near local amenities and schools, this home provides both comfort and accessibility. Don't miss the opportunity to explore this delightful residence.
-
2026-02-05price $189,400 451-char remark
Show marketing remark (451 chars)
Charming single-tribe home located in a serene neighborhood of Shelbyville. This well-maintained property provides spacious living areas, a modern kitchen, and ample natural light throughout. The backyard is appropriate for outdoor entertaining, with a patio and lush landscaping. Conveniently located near local amenities and schools, this home provides both comfort and accessibility. Don't miss the opportunity to explore this delightful residence.
-
2026-01-22price $189,900 451-char remark
Show marketing remark (451 chars)
Charming single-tribe home located in a serene neighborhood of Shelbyville. This well-maintained property provides spacious living areas, a modern kitchen, and ample natural light throughout. The backyard is appropriate for outdoor entertaining, with a patio and lush landscaping. Conveniently located near local amenities and schools, this home provides both comfort and accessibility. Don't miss the opportunity to explore this delightful residence.
-
2026-01-15price $195,900 451-char remark
Show marketing remark (451 chars)
Charming single-tribe home located in a serene neighborhood of Shelbyville. This well-maintained property provides spacious living areas, a modern kitchen, and ample natural light throughout. The backyard is appropriate for outdoor entertaining, with a patio and lush landscaping. Conveniently located near local amenities and schools, this home provides both comfort and accessibility. Don't miss the opportunity to explore this delightful residence.
-
2026-01-06price $202,900 451-char remark
Show marketing remark (451 chars)
Charming single-tribe home located in a serene neighborhood of Shelbyville. This well-maintained property provides spacious living areas, a modern kitchen, and ample natural light throughout. The backyard is appropriate for outdoor entertaining, with a patio and lush landscaping. Conveniently located near local amenities and schools, this home provides both comfort and accessibility. Don't miss the opportunity to explore this delightful residence.
-
2025-12-16price $207,900 451-char remark
Show marketing remark (451 chars)
Charming single-tribe home located in a serene neighborhood of Shelbyville. This well-maintained property provides spacious living areas, a modern kitchen, and ample natural light throughout. The backyard is appropriate for outdoor entertaining, with a patio and lush landscaping. Conveniently located near local amenities and schools, this home provides both comfort and accessibility. Don't miss the opportunity to explore this delightful residence.
-
2025-12-08$214,900 Active 451-char remark
Show marketing remark (451 chars)
Charming single-tribe home located in a serene neighborhood of Shelbyville. This well-maintained property provides spacious living areas, a modern kitchen, and ample natural light throughout. The backyard is appropriate for outdoor entertaining, with a patio and lush landscaping. Conveniently located near local amenities and schools, this home provides both comfort and accessibility. Don't miss the opportunity to explore this delightful residence.
-
2021-03-16historical
-
2021-03-16historical
-
2019-09-29soldstatus $120,000 Closed
-
2019-09-09soldstatus $120,000
-
2019-08-09status Pending
-
2019-08-01status Active
-
2019-08-01historical Contingent - Financing
-
2019-07-25status Pending
-
2019-07-23$120,000 Active
-
2018-03-16soldstatus $95,000
-
2018-03-09soldstatus $95,000 Closed
-
2018-01-14historical Contingent - Financing
-
2018-01-11price $94,900
-
2017-12-28$104,900 Active
ⓘ Source: listings_history table (triggers on properties + properties_extension) + one-shot
backfill from property_details.listing_events for pre-trigger history.
Tax reassessment forecast TN · Resets to sale price
- Current annual tax
- $944 · $79/mo
- Projected year-2 tax
- $1,341 · $112/mo
- Expected delta
- +$397/yr (+$33/mo · 42.1%)
ⓘ Screening estimate from a state-policy table — verify with the county assessor before closing.
Climate risk First Street
- Flood 1/10 Low FEMA zone X (unshaded) · 0% chance over 30 yrs
- Wildfire 3/10 Moderate
- Heat 6/10 Major 7 d/yr ≥107°F today · 21 d/yr by 30 yrs out
- Wind 4/10 Moderate 11% chance of damaging wind over 30 yrs
- Air quality 2/10 Low 1 unhealthy d/yr today · 1 by 30 yrs out
Nearby sold comps map
Loading sold comps map…
Walkable amenities ~0.75 mi
Loading nearby amenities…
Taxation est. · year 1
- Rental income
- $16,910
- − Mortgage interest
- −$10,581
- − Property taxes
- −$944
- − Insurance
- −$944
- − Repairs & maintenance
- −$1,353
- − Management
- −$1,353
- − Depreciation
- −$5,495
- Taxable loss
- −$3,761
- Est. tax savings @ 24.0%
- +$903
- After-tax cash flow
- $485/yr
For passive investors: Depreciation is non-cash, so a rental often shows a tax loss while cash-flowing — sheltering income. Rental losses are passive: they offset passive income freely, and up to $25,000/yr can offset ordinary (W-2) income if you actively participate and your MAGI is under $100k (phasing out to $0 by $150k); unused losses carry forward. On sale, claimed depreciation is recaptured at up to 25%, and gains may owe capital-gains tax (a 1031 exchange can defer both). Figures are a year-1 estimate at your 24.0% rate — not tax advice; consult a CPA.
Schools (NCES district)
- District
- Bedford County
- NCES district ID
- 4700180
- Math proficiency
- 24% ▼ -4.00%
- Reading proficiency
- 23% ▼ -3.00%
- Median HH income
- $41,704
- Composite
- 20.03/100
- National rank
- #8658
- State rank
- #97 of 139 in TN
Livability — Shelbyville
- Score
- 64/100
- State rank
- #183
- US rank
- #14818
Category grades
Schools grade is shown separately in the Schools card above.
Census & demographics
- Census place
- Shelbyville, TN
- County
- Bedford County · 38,148 people
- City population
- 38,148
- Metro
- Shelbyville, TN
- Population (ZIP)
- 38,148
- Household income
- $64,800
- Rent vs Own
- Severe rent burden
- 1093.0
Population outlook (Bedford County) Hauer SSP2
- Today (2025)
- 51,064 people
- By 2030
- 52,954 · +3.7%
- By 2040
- 56,534 · +10.7%
- By 2050
- 59,482 · +16.5%
- By 2075
- 65,597 · +28.5%
- By 2100
- 68,030 · +33.2%
Race, ethnicity, and origin ACS 2023
- Neighborhood character
- Predominantly White (66%)
- Race & ethnicity
- White 66% Hispanic / Latino 21% Two or more races 11% Black 8% Native American 2%
- Hispanic origin (detail)
- Mexican 15%
- Common ancestry
- Serbian 1% Lithuanian 1% Slovak 1%
- Foreign-born
- 9% · Canada
- Languages at home
- 84% English-only · Spanish 15% Arabic 1%
Political lean MEDSL · Bedford
- 2024 margin
- Solid R (+58.0) · D 20.5% · R 78.5%
- 2008→2024 swing
- -24.5pp toward R · 2008: -33.5pp · 2024: -58.0pp
- All cycles
- 2024: R+58.0 2020: R+51.9 2016: R+52.8 2012: R+40.3 2008: R+33.5
Not yet ingested
- Civics
- —
Market trends
- HPI YoY
- ▼ -99.18%
- Current HPI
- 330.802
- Rent YoY
- —
- Metro
- Shelbyville, TN
- State GDP YoY
- ▲ 2.78%
- F500 in state
- 22
Industry mix (Fortune 500 HQ in TN)
| Industry | F500 HQs | Revenue |
|---|---|---|
| Healthcare | 3 | $91B |
|
||
| Retail | 3 | $72B |
|
||
| Transportation / Logistics | 1 | $88B |
|
||
| Paper / Packaging | 1 | $19B |
|
||
| Insurance | 1 | $13B |
|
||
| Energy | 1 | $12B |
|
||
Price history
+80.1% since first listed22 events — show timeline
- 2026-02-20 Price Changed $188,900 REALTRACS as Distributed by MLS Grid
- 2026-02-11 Price Changed $189,000 REALTRACS as Distributed by MLS Grid
- 2026-02-05 Price Changed $189,400 REALTRACS as Distributed by MLS Grid
- 2026-01-22 Price Changed $189,900 REALTRACS as Distributed by MLS Grid
- 2026-01-15 Price Changed $195,900 REALTRACS as Distributed by MLS Grid
- 2026-01-06 Price Changed $202,900 REALTRACS as Distributed by MLS Grid
- 2025-12-16 Price Changed $207,900 REALTRACS as Distributed by MLS Grid
- 2025-12-08 Listed $214,900 REALTRACS as Distributed by MLS Grid
- 2021-03-16 Coming Soon — REALTRACS as Distributed by MLS Grid
- 2021-03-16 Listing Removed — REALTRACS as Distributed by MLS Grid
- 2019-09-29 Sold (MLS) $120,000 REALTRACS as Distributed by MLS Grid
- 2019-09-09 Sold (Public Records) $120,000 Public Records
- 2019-08-09 Pending — REALTRACS as Distributed by MLS Grid
- 2019-08-01 Relisted — REALTRACS as Distributed by MLS Grid
- 2019-08-01 Contingent — REALTRACS as Distributed by MLS Grid
- 2019-07-25 Pending — REALTRACS as Distributed by MLS Grid
- 2019-07-23 Listed $120,000 REALTRACS as Distributed by MLS Grid
- 2018-03-16 Sold (Public Records) $95,000 Public Records
- 2018-03-09 Sold (MLS) $95,000 REALTRACS as Distributed by MLS Grid
- 2018-01-14 Contingent — REALTRACS as Distributed by MLS Grid
- 2018-01-11 Price Changed $94,900 REALTRACS as Distributed by MLS Grid
- 2017-12-28 Listed $104,900 REALTRACS as Distributed by MLS Grid
Property tax history
+4.5%/yrLatest (2025): $944 · +0.0% YoY. Source: county tax records.
Cash-flow waterfall
monthlySold comps — $/sqft
last 12 mo · ≤1 miLoading sold comps…