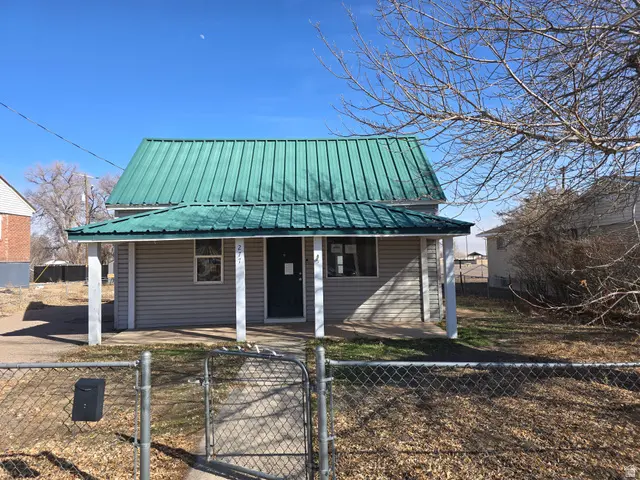
277 S 100 E · Vernal, UT
Flood risk 1/10 · Minimal
- FEMA flood zone
- X (unshaded)
- Chance of flooding over 30 yrs
- 0.0%
- Est. flood insurance / yr
- $507 – $1,088
Fire risk 5/10 · Moderate
- Est. fire insurance / yr
- $453 – $841
Heat risk 4/10 · Minor
- Hot days now (above 92°F)
- 7 days/yr
- Hot days in 30 yrs
- 22 days/yr
Wind risk 1/10 · Minimal
- Chance of severe wind over 30 yrs
- —
Air-quality risk 3/10 · Minor
- Unhealthy air days now
- 3 days/yr
- Unhealthy air days in 30 yrs
- 3 days/yr
Risk factors via First Street. Map © Google.
Why this score? — see what drove the C- grade
The composite is a weighted blend of 9 inputs, each scored 0–100. Each bar is that input's sub-score; the figure is the points it added to the 100-point composite (weight × sub-score).
- Cash flow +21.2/30.0
- ARV discount +7.5/15.0
- DSCR +6.7/10.0
- 1% rule +4.7/10.0
- Livability +3.8/5.0
- Rent growth +3.5/5.0
- Schools +3.1/10.0
- Condition / age +2.5/5.0
- Appreciation +0.0/10.0
$140,000
🖨 Deal sheet (PDF) 📄 Offer letter ✓ Due diligence
Listing remarks MLS
There are no remarks available.
Key facts
- Spacious backyard
- Near shopping
- Large yard
Tags
Property features AI
Finance
- Financial info: REO / Bank owned
Exterior
- Parking: Carport (2 spaces); 2 covered parking spaces; 2 open parking spaces; Total of 4 parking spaces
- Utilities: Public sewer and septic tank listed; Culinary water connected
- Home design: Rambler/Ranch style; Single-family property; Built/standing condition; Effective year built 1920
- Construction: Metal roof
- Exterior features: Open porch; Fully fenced lot; Paved road access
Interior
- Kitchen: Free standing range/oven
- Bedrooms: 2 main-level bedrooms
- Flooring: Carpet; Tile
- Bathrooms: 1 full bathroom
- Heating & cooling: Electric heating; Has heating
- Interior features: Free standing range/oven; Open porch
- Laundry & utility: No basement
Neighborhood map
What this means for you Summary
Snapshot
- This is a 2-bed/1.0-bath single-family listed at $140k.
Deal economics
- At list price, monthly cash flow is $201 ($2k/yr) — positive.
- The deal already cash-flows at list — no discount required.
- To meet the 1% rule (rent ≥ 1% of price), the offer needs to be $135k (3.2% below list).
- Recommended offer: $135k (3.2% below list) — sets the bar for 1% rule.
Location & tenants
- Location reads 75/100 on livability (#60 in UT, #3,813 nationally) — a middle-class / working-renter tenant base. Strengths: commute A+, cost of living A+, amenities A; Watch: crime D+, health & safety D+, employment F.
- Uintah District (town): math 34% / reading 34% proficiency, ranked #60 of 80 in UT (top 75%) — families likely to look elsewhere, expect single-tenant / working-renter base with shorter leases.
- Zoned schools: Naples School (math 39% / reading 36%, grade F, #352 of 585 statewide, top 60%, 502 students, 56% FRL); Uintah Middle School (math 37% / reading 42%, grade F, #75 of 138 statewide, top 56%, 669 students, 40% FRL); Uintah High (math 18% / reading 36%, grade F, #131 of 171 statewide, top 79%, 1,808 students, 31% FRL).
- Market conditions: Rents rising fast (+4.1%/yr); 276 active listings in the ZIP; solid renter incomes; 85 units permitted in Uintah County in 2024 (0 in 5+ unit buildings).
Forward outlook
- Local home prices are declining (-3.0%/yr); year-one equity from $968 of loan paydown is wiped out by about $4k of value loss. Plan a longer hold.
- Uintah County population projected at +72% by 2050 — long-run rental-demand tailwind backs the buy-and-hold thesis.
Negotiation context
- It's been on market 16 days — a 2% lower offer ($138k) is reasonable based on typical stale-listing flexibility.
- 4 sale attempts since 14y ago with the ask held roughly flat each time — persistent listings suggest the price (not the market) is what's stuck; bring a comps-based counter.
Risks & watch-outs
- Watch-outs: built in 1920 — expect roof / HVAC / electrical / plumbing capex.
- Climate carrying-cost: moderate wildfire risk — expect insurance premiums to compound above CPI over the hold.
Questions for the listing agent
- Built in 1920 — when were the roof, HVAC, electrical panel, plumbing, and water heater last replaced?
- Is there a deadline driving the sale (1031 exchange, divorce, estate, relocation)? That informs how much negotiation room exists.
- Schools are D-rated, which usually means shorter tenancies and higher turnover. Who's the typical renter profile here, and what's been the actual vacancy rate?
- Crime grade is D in this area — have there been break-ins, vandalism, or insurance claims at this property in the last 3 years? What carrier currently insures it and at what premium?
- What's the average days-on-market for RENTAL listings here right now (not sales)? A rising rental-DOM trend means longer vacancies and softer asking-rent achievability than the comps imply.
- What's the recent tenant-quality profile in this submarket — average credit score on applications, eviction rate, late-payment / NSF rate, and stable-employment percentage? A property-management company in the area should have these aggregated.
- How much new for-sale + rental construction is in the pipeline within 1–3 miles? Heavy new supply typically softens prices + rents 12–24 months out; constrained supply supports both.
Investment metrics
- 1% rule
- 0.97% ✗
- Cap rate
- 8.02%
- Cash-on-cash
- 6.16%
- DSCR
- 1.27
- GRM
- 8.6
CMA / ARV
No comps found within radius.
Projected returns pro-forma
-3.0% appreciation · 4.07% rent growth · sell at horizon
- IRR
- -5.7%
- Equity multiple
- 0.78×
- Total profit
- $-8,440
- Equity at exit
- $20,874
- IRR
- 5.0%
- Equity multiple
- 1.39×
- Total profit
- $15,167
- Equity at exit
- $12,105
Cash invested: $39,200 (down + closing). Projections, not guarantees.
Landlord ↔ Tenant lean methodology
- Overall (STATE)
- 86 Strongly Landlord-Friendly
- State Utah
- 86 Strongly Landlord-Friendly · R+15
- County
- — inherits STATE
- City
- — inherits STATE
ZIP-level market 84078
- Rents YoY
- 4.1%
- Active inventory
- 276
- Price-to-rent
- 8.6×
Monthly cashflow live
- Estimated rent
- $1,355 medium interval (Pro) →
- Mortgage (P&I)
- −$734
- Tax from tax record
- −$76 /mo · $917/yr
- Insurance
- −$58
- HOA
- −$0
- Vacancy / Maint / Mgmt
- −$284
- Net cashflow
- $201
Break-even live
Sensitivity live
| Price | -10% $280 | -5% $241 | +0% $201 | +5% $162 | +10% $122 |
|---|---|---|---|---|---|
| Rent | -10% $94 | -5% $148 | +0% $201 | +5% $255 | +10% $308 |
| Rate | -1.0pp $272 | -0.5pp $237 | base $201 | +0.5pp $165 | +1.0pp $128 |
UW: 25.0% down · 7.5% · 30yr · 1.5% tax · 5.0% vac · 8.0% maint · 8.0% mgmt
Financing live
Cash to close
- Down payment
- $35,000
- Closing costs
- $4,200
- Reserves months
- —
- Total cash needed
- —
Loan-product check · same deal, 3 products live
Conventional
25% down · 7.5% · 30yr
- Down + closing
- —
- Monthly P&I
- —
- Monthly cashflow
- —
- DSCR
- —
- Eligible?
- —
Personal DTI + credit; lowest rate.
DSCR
20% down · 8.5% · 30yr
- Down + closing
- —
- Monthly P&I
- —
- Monthly cashflow
- —
- DSCR
- —
- Eligible?
- —
No personal income docs; deal must DSCR.
Hard money
10% down · 12.0% · 12mo
- Down + closing
- —
- Monthly P&I
- —
- Monthly cashflow
- —
- DSCR
- —
- Eligible?
- —
Short-term bridge; refi at stabilization.
Listing history 10 events
-
2026-04-29status Under Contract
-
2026-04-13$140,000 Active
-
2025-03-12historical
-
2024-12-10price $195,000
-
2024-07-10$205,000 Active
-
2023-01-25soldstatus Closed 31-char remark
Show marketing remark (31 chars)
There are no remarks available.
-
2022-12-24status Under Contract 31-char remark
Show marketing remark (31 chars)
There are no remarks available.
-
2022-12-14$180,000 Active 31-char remark
Show marketing remark (31 chars)
There are no remarks available.
-
2012-11-15historical
-
2012-04-16$127,000
ⓘ Source: listings_history table (triggers on properties + properties_extension) + one-shot
backfill from property_details.listing_events for pre-trigger history.
Tax reassessment forecast UT · Resets to sale price
- Current annual tax
- $917 · $76/mo
- Projected year-2 tax
- $924 · $77/mo
- Expected delta
- +$7/yr (+$1/mo · 0.8%)
ⓘ Screening estimate from a state-policy table — verify with the county assessor before closing.
Climate risk First Street
- Flood 1/10 Low FEMA zone X (unshaded) · 0% chance over 30 yrs
- Wildfire 5/10 Major
- Heat 4/10 Moderate 7 d/yr ≥92°F today · 22 d/yr by 30 yrs out
- Wind 1/10 Low
- Air quality 3/10 Moderate 3 unhealthy d/yr today · 3 by 30 yrs out
Nearby sold comps map
Loading sold comps map…
Walkable amenities ~0.75 mi
Loading nearby amenities…
Taxation est. · year 1
- Rental income
- $16,254
- − Mortgage interest
- −$7,842
- − Property taxes
- −$917
- − Insurance
- −$700
- − Repairs & maintenance
- −$1,300
- − Management
- −$1,300
- − Depreciation
- −$4,073
- Taxable income
- $122
- Est. tax owed @ 24.0%
- −$29
- After-tax cash flow
- $2,385/yr
For passive investors: Depreciation is non-cash, so a rental often shows a tax loss while cash-flowing — sheltering income. Rental losses are passive: they offset passive income freely, and up to $25,000/yr can offset ordinary (W-2) income if you actively participate and your MAGI is under $100k (phasing out to $0 by $150k); unused losses carry forward. On sale, claimed depreciation is recaptured at up to 25%, and gains may owe capital-gains tax (a 1031 exchange can defer both). Figures are a year-1 estimate at your 24.0% rate — not tax advice; consult a CPA.
Schools (NCES district)
- District
- Uintah District
- NCES district ID
- 4901080
- Math proficiency
- 34% ▼ -4.00%
- Reading proficiency
- 34% ▼ -4.00%
- Median HH income
- $62,125
- Composite
- 30.69/100
- National rank
- #6177
- State rank
- #60 of 80 in UT
Livability — Vernal
- Score
- 75/100
- State rank
- #60
- US rank
- #3813
Category grades
Schools grade is shown separately in the Schools card above.
Census & demographics
- Census place
- Vernal, UT
- County
- Uintah County · 30,975 people
- City population
- 30,975
- Metro
- Vernal, UT
- Population (ZIP)
- 30,975
- Household income
- $75,113
- Rent vs Own
- Severe rent burden
- 223.0
Population outlook (Uintah County) Hauer SSP2
- Today (2025)
- 49,582 people
- By 2030
- 56,006 · +13.0%
- By 2040
- 70,034 · +41.2%
- By 2050
- 85,323 · +72.1%
- By 2075
- 124,396 · +150.9%
- By 2100
- 154,630 · +211.9%
Race, ethnicity, and origin ACS 2023
- Neighborhood character
- Predominantly White (83%)
- Race & ethnicity
- White 83% Hispanic / Latino 8% Two or more races 8% Native American 3%
- Hispanic origin (detail)
- Mexican 7%
- Common ancestry
- Italian 6% Slovak 3% Portuguese 1%
- Foreign-born
- 2% · Canada
- Languages at home
- 96% English-only · Spanish 3% Other Asian/Pacific 1%
Political lean MEDSL · Uintah
- 2024 margin
- Solid R (+73.6) · D 12.3% · R 85.9% · Other 1.8%
- 2008→2024 swing
- -4.8pp toward R · 2008: -68.8pp · 2024: -73.6pp
- All cycles
- 2024: R+73.6 2020: R+75.8 2016: R+68.9 2012: R+81.3 2008: R+68.8
Not yet ingested
- Civics
- —
Market trends
- HPI YoY
- ▼ -304.65%
- Current HPI
- 197.5429
- Rent YoY
- ▲ 4.07%
- Metro
- Vernal, UT
- State GDP YoY
- ▲ 3.54%
- F500 in state
- 2
Industry mix (Fortune 500 HQ in UT)
| Industry | F500 HQs | Revenue |
|---|---|---|
| Financial Services | 1 | $3B |
|
||
Price history
+10.2% since first listed10 events — show timeline
- 2026-04-29 Pending — WFRMLS
- 2026-04-13 Listed $140,000 WFRMLS
- 2025-03-12 Listing Removed — WFRMLS
- 2024-12-10 Price Changed $195,000 WFRMLS
- 2024-07-10 Listed $205,000 WFRMLS
- 2023-01-25 Sold (MLS) — WFRMLS
- 2022-12-24 Pending — WFRMLS
- 2022-12-14 Listed $180,000 WFRMLS
- 2012-11-15 Listing Removed — WFRMLS
- 2012-04-16 Listed $127,000 WFRMLS
Property tax history
+2.3%/yrLatest (2025): $917 · +0.3% YoY. Source: county tax records.
Cash-flow waterfall
monthlySold comps — $/sqft
last 12 mo · ≤1 miLoading sold comps…