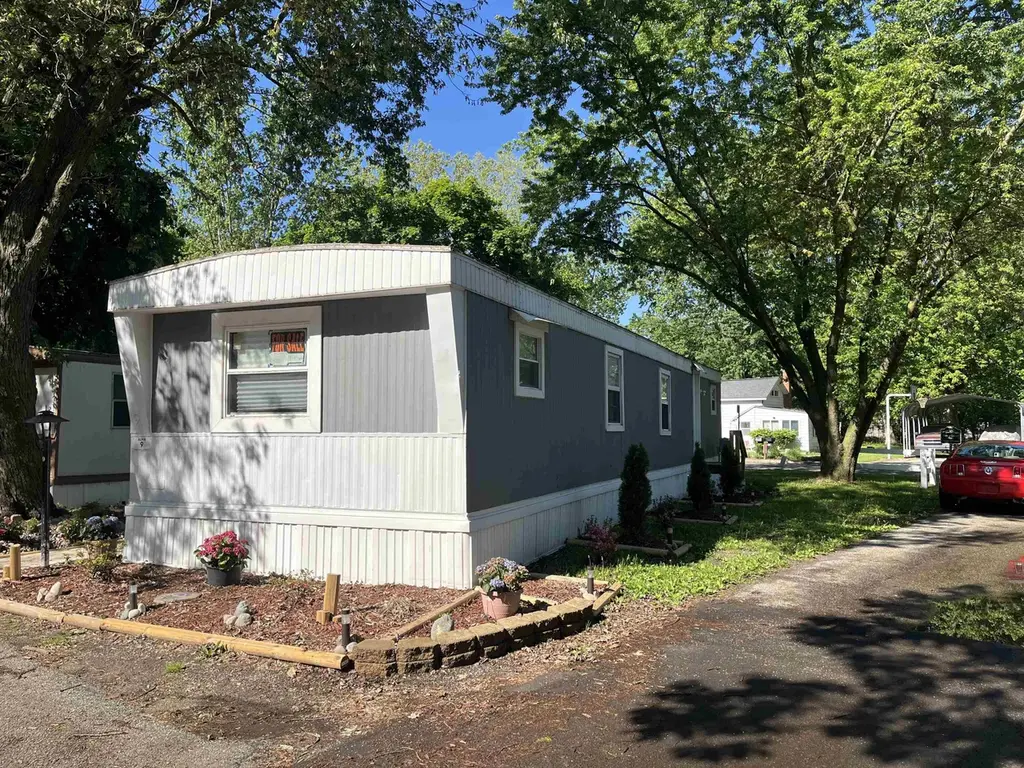
315 Linwood Ave Lot : 9 · Alma, MI
Flood risk No data
- FEMA flood zone
- —
- Chance of flooding over 30 yrs
- —
- Est. flood insurance / yr
- —
Fire risk No data
- Est. fire insurance / yr
- —
Heat risk No data
- Hot days now (above threshold)
- —
- Hot days in 30 yrs
- —
Wind risk No data
- Chance of severe wind over 30 yrs
- —
Air-quality risk No data
- Unhealthy air days now
- —
- Unhealthy air days in 30 yrs
- —
Risk factors via First Street. Map © Google.
Why this score? — see what drove the B- grade
The composite is a weighted blend of 9 inputs, each scored 0–100. Each bar is that input's sub-score; the figure is the points it added to the 100-point composite (weight × sub-score).
- Cash flow +30.0/30.0
- 1% rule +10.0/10.0
- DSCR +10.0/10.0
- ARV discount +7.5/15.0
- Livability +3.5/5.0
- Schools +3.0/10.0
- Rent growth +2.5/5.0
- Condition / age +2.5/5.0
- Appreciation +0.0/10.0
$33,000
🖨 Deal sheet 📄 Offer letter ✓ Due diligence
Listing remarks
Welcome to this recently updated home located in KC's Alma Mobile Home Community. The kitchen features modern upgrades including luxury vinyl plank flooring, a stylish backsplash, accent wall, and fresh paint. The bathroom has been fully refreshed with tongue and groove wall finishes, a new shower/tub combo, updated toilet, and a new vanity sink. Throughout the home you'll find rustic accent walls and updated trim, window frames, and screens that give the space a warm, modern feel. Outside, enjoy improved landscaping, a newly poured concrete walkway, and new entry stairs. The sale includes most furnishings. Lot rent is $445/month and does not include sewer, water, trash, electricity, or gas
Key facts
- Updated toilet
- Stylish backsplash
- New shower tub combo
Tags
Property features AI
Finance
- Other: Property located in Alma, MI
- HOA & community: Zoned residential
Exterior
- Parking: No parking details provided
- Utilities: Public water; Community sewer
- Home design: Residential manufactured home (single wide); Built in 1984; Lot: 9
- Construction: Aluminum exterior construction; Piers foundation; Manufactured single-wide
- Exterior features: Aluminum exterior; Porch; Sidewalks; Piers foundation
Interior
- Kitchen: Freezer; Microwave; Range/Oven; Refrigerator; Vinyl flooring in kitchen
- Bedrooms: First-floor bedroom; Main-level bedroom (13 x 10) with carpet; Main-level bedroom (12 x 11) with carpet
- Flooring: Carpet in living room and bedrooms; Vinyl in kitchen and laundry room
- Bathrooms: One full bathroom (main level)
- Heating & cooling: Wall heat; Natural gas
- Interior features: Porch; Sidewalks
- Laundry & utility: Main-level laundry room (10 x 5) with vinyl flooring
Neighborhood map
What this means for you Summary
Snapshot
- This is a 2-bed/1.0-bath other listed at $33k.
Deal economics
- At list price, monthly cash flow is $487 ($6k/yr) — positive.
- The deal already cash-flows at list — no discount required.
- Meets the 1% rule at list price ($872 rent vs $33k).
- Recommended offer: $33k (1.5% below list) — sets the bar for market timing.
- Cap rate 24.0% vs local median 4.2% in Alma — top-decile yield for the area; either an underpriced asset or a hidden risk that comps aren't pricing in. Stress-test before assuming the spread holds.
Location & tenants
- Location reads 69/100 on livability (#345 in MI) — a middle-class / working-renter tenant base. Strengths: cost of living A+, housing A+, health & safety A+; Watch: crime D+, amenities F, commute F.
- Alma Public Schools (town): math 28% / reading 44% proficiency, ranked #288 of 540 in MI (top 53%) — families likely to look elsewhere, expect single-tenant / working-renter base with shorter leases.
- Market conditions: 89 active listings in the ZIP; 4 comparable units currently listed for rent nearby; rentals lingering (median 44d on market — plan ~5-8 weeks vacancy on turnover, expect pricing pressure); 100% of comp listings sitting > 30 days — soft ceiling on asking rent; 47 units permitted in Gratiot County in 2024 (0 in 5+ unit buildings).
Forward outlook
- Local home prices are declining (-3.0%/yr); year-one equity from $228 of loan paydown is wiped out by about $990 of value loss. Plan a longer hold.
- Gratiot County population projected at -14% by 2050 — secular population decline; favor cash flow + early exit over multi-decade hold.
- At projected returns (-3.0% appreciation + 3.0% rent growth), your $9k cash investment doubles in ~2 years — after that, you're playing with house money.
Negotiation context
- It's been on market 22 days — a 2% lower offer ($33k) is reasonable based on typical stale-listing flexibility.
- Current owner paid $6k; list at $33k implies a 408% gain — meaningful room to come down on a strong offer.
Questions for the listing agent
- Is there a deadline driving the sale (1031 exchange, divorce, estate, relocation)? That informs how much negotiation room exists.
- Crime grade is D in this area — have there been break-ins, vandalism, or insurance claims at this property in the last 3 years? What carrier currently insures it and at what premium?
- What's the average days-on-market for RENTAL listings here right now (not sales)? A rising rental-DOM trend means longer vacancies and softer asking-rent achievability than the comps imply.
- What's the recent tenant-quality profile in this submarket — average credit score on applications, eviction rate, late-payment / NSF rate, and stable-employment percentage? A property-management company in the area should have these aggregated.
- How much new for-sale + rental construction is in the pipeline within 1–3 miles? Heavy new supply typically softens prices + rents 12–24 months out; constrained supply supports both.
Investment metrics
- 1% rule
- 2.64% ✓
- Cap rate
- 24.01%
- Cash-on-cash
- 63.27%
- DSCR
- 3.82
- GRM
- 3.2
CMA / ARV
No comps found within radius.
Projected returns pro-forma
-3.0% appreciation · 3.0% rent growth · sell at horizon
- IRR
- 62.3%
- Equity multiple
- 3.78×
- Total profit
- $25,678
- Equity at exit
- $4,920
- IRR
- 66.8%
- Equity multiple
- 7.74×
- Total profit
- $62,303
- Equity at exit
- $2,853
Cash invested: $9,240 (down + closing). Projections, not guarantees.
Landlord ↔ Tenant lean methodology
- Overall (STATE)
- 62 Landlord-Friendly
- State Michigan
- 62 Landlord-Friendly · EVEN
- County
- — inherits STATE
- City
- — inherits STATE
ZIP-level market 48801
- Home prices YoY
- -32.0%
- Active inventory
- 89
- Price-to-rent
- 3.2×
Monthly cashflow live
- Estimated rent
- $872 medium interval (Pro) →
- Mortgage (P&I)
- −$173
- Tax from tax record
- −$15 /mo · $181/yr
- Insurance
- −$14
- HOA
- −$0
- Vacancy / Maint / Mgmt
- −$183
- Net cashflow
- $487
Break-even live
UW: 25.0% down · 7.5% · 30yr · 1.5% tax · 5.0% vac · 8.0% maint · 8.0% mgmt
Financing live
Cash to close
- Down payment
- $8,250
- Closing costs
- $990
- Reserves months
- —
- Total cash needed
- —
Loan-product check · same deal, 3 products live
Conventional
25% down · 7.5% · 30yr
- Down + closing
- —
- Monthly P&I
- —
- Monthly cashflow
- —
- DSCR
- —
- Eligible?
- —
Personal DTI + credit; lowest rate.
DSCR
20% down · 8.5% · 30yr
- Down + closing
- —
- Monthly P&I
- —
- Monthly cashflow
- —
- DSCR
- —
- Eligible?
- —
No personal income docs; deal must DSCR.
Hard money
10% down · 12.0% · 12mo
- Down + closing
- —
- Monthly P&I
- —
- Monthly cashflow
- —
- DSCR
- —
- Eligible?
- —
Short-term bridge; refi at stabilization.
Rent comps 4 comps
| Address | Beds | Baths | Sqft | Rent | $/sqft | DOM | Units | Dist |
|---|---|---|---|---|---|---|---|---|
| 240 Windsor St Alma, MI | 1.0–2.0 | 1.0 | 675 | $875 | $1.30 | 43d | 1 | 0.63mi |
| 213 W Downie St Unit B Alma, MI | 2.0 | 1.0 | 580 | $800 | $1.38 | 43d | 1 | 1.27mi |
| 307 W Elizabeth St Alma, MI | 2.0 | 1.0 | 650 | $850 | $1.31 | 43d | 1 | 1.46mi |
| 307 W Elizabeth St Unit 307 Alma, MI | 2.0 | 1.0 | 750 | $950 | $1.27 | 43d | 1 | 1.46mi |
Listing history 17 events
-
2026-06-18days on market $33,000 Active 22 DOM
-
2026-06-17days on market $33,000 Active 21 DOM
-
2026-06-16days on market $33,000 Active 20 DOM
-
2026-06-15days on market $33,000 Active 19 DOM
-
2026-06-13days on market $33,000 Active 17 DOM
-
2026-06-12pricedays on market $33,000 Active 16 DOM
-
2026-06-09days on market $39,000 Active 13 DOM
-
2026-06-08days on market $39,000 Active 12 DOM
-
2026-06-07days on market $39,000 Active 11 DOM
-
2026-06-07days on market $39,000 Active 10 DOM
-
2026-06-04days on market $39,000 Active 7 DOM
-
2026-06-02days on market $39,000 Active 6 DOM
-
2026-06-01days on market $39,000 Active 5 DOM
-
2026-05-31days on market $39,000 Active 4 DOM
-
2026-05-31days on market $39,000 Active 3 DOM
-
2026-05-25$39,000 Active
-
1996-03-02soldstatus $6,500
ⓘ Source: listings_history table (triggers on properties + properties_extension) + one-shot
backfill from property_details.listing_events for pre-trigger history.
Tax reassessment forecast MI · Partial reset (capped growth)
- Current annual tax
- $181 · $15/mo
- Projected year-2 tax
- $345 · $29/mo
- Expected delta
- +$164/yr (+$14/mo · 90.4%)
ⓘ Screening estimate from a state-policy table — verify with the county assessor before closing.
Nearby sold comps map
Loading sold comps map…
Walkable amenities ~0.75 mi
Loading nearby amenities…
Taxation est. · year 1
- Rental income
- $10,467
- − Mortgage interest
- −$1,849
- − Property taxes
- −$181
- − Insurance
- −$165
- − Repairs & maintenance
- −$837
- − Management
- −$837
- − Depreciation
- −$960
- Taxable income
- $5,638
- Est. tax owed @ 24.0%
- −$1,353
- After-tax cash flow
- $4,493/yr
For passive investors: Depreciation is non-cash, so a rental often shows a tax loss while cash-flowing — sheltering income. Rental losses are passive: they offset passive income freely, and up to $25,000/yr can offset ordinary (W-2) income if you actively participate and your MAGI is under $100k (phasing out to $0 by $150k); unused losses carry forward. On sale, claimed depreciation is recaptured at up to 25%, and gains may owe capital-gains tax (a 1031 exchange can defer both). Figures are a year-1 estimate at your 24.0% rate — not tax advice; consult a CPA.
Schools (NCES district)
- District
- Alma Public Schools
- NCES district ID
- 2602640
- Math proficiency
- 28% ▼ -9.00%
- Reading proficiency
- 44% ▼ -3.00%
- Median HH income
- $36,651
- Composite
- 29.84/100
- National rank
- #6415
- State rank
- #288 of 540 in MI
Livability — Alma
- Score
- 69/100
- State rank
- #345
- US rank
- #8809
Category grades
Schools grade is shown separately in the Schools card above.
Census & demographics
- Census place
- Alma, MI
- City population
- 13,433
- Population (ZIP)
- 13,433
Population outlook (Gratiot County) Hauer SSP2
- Today (2025)
- 39,991 people
- By 2030
- 38,944 · -2.6%
- By 2040
- 36,694 · -8.2%
- By 2050
- 34,314 · -14.2%
- By 2075
- 27,693 · -30.8%
- By 2100
- 20,809 · -48.0%
Race, ethnicity, and origin ACS 2023
- Neighborhood character
- Predominantly White (85%)
- Race & ethnicity
- White 85% Hispanic / Latino 10% Two or more races 4% Black 2% Asian 1%
- Hispanic origin (detail)
- Mexican 8%
- Common ancestry
- Romanian 5% Slovak 3% Iranian 2%
- Foreign-born
- 2% · Canada, South Korea
- Languages at home
- 94% English-only · Spanish 4% French/Haitian/Cajun 1%
Political lean MEDSL · Gratiot
- 2024 margin
- Solid R (+31.3) · D 33.7% · R 65.0% · Other 1.4%
- 2008→2024 swing
- -35.7pp toward R · 2008: 4.4pp · 2024: -31.3pp
- All cycles
- 2024: R+31.3 2020: R+28.3 2016: R+25.6 2012: R+3.9 2008: D+4.4
Not yet ingested
- Civics
- —
Market trends
- HPI YoY
- ▼ -99.16%
- Current HPI
- 210.3208
- Rent YoY
- —
- Metro
- —
- State GDP YoY
- ▲ 1.37%
- F500 in state
- 28
Industry mix (Fortune 500 HQ in MI)
| Industry | F500 HQs | Revenue |
|---|---|---|
| Automotive Parts | 3 | $48B |
|
||
| Automotive | 2 | $372B |
|
||
| Chemicals | 1 | $45B |
|
||
| Automotive Retail | 1 | $29B |
|
||
| Healthcare / Medical Devices | 1 | $23B |
|
||
| Automotive Technology | 1 | $20B |
|
||
Price history
+500.0% since first listed2 events — show timeline
- 2026-05-25 Listed $39,000 MiRealSource-MiMLS
- 1996-03-02 Sold (Public Records) $6,500 Public Records
Cash-flow waterfall
monthlySold comps — $/sqft
last 12 mo · ≤1 miLoading sold comps…